A Household-Based Study of Contact
Networks Relevant for the Spread of
Infectious Diseases in the Highlands of Peru
Carlos G. Grijalva1*, Nele Goeyvaerts3,4, Hector Verastegui5, Kathryn M. Edwards2, Ana I. Gil5, Claudio F. Lanata5, Niel Hens3,4, for the RESPIRA PERU project
1Department of Health Policy, Vanderbilt University School of Medicine, Nashville, TN, United States of America,2Department of Pediatrics, Vanderbilt University School of Medicine, Nashville, TN, United States of America,3Interuniversity Institute for Biostatistics and Statistical Bioinformatics, Hasselt University, Diepenbeek, Belgium,4Centre for Health Economics Research and Modeling Infectious Diseases, and Centre for the Evaluation of Vaccination, Vaccine & Infectious Disease Institute, University of Antwerp, Wilrijk, Belgium,5Instituto de Investigación Nutricional, Lima, Peru
Abstract
Background
Few studies have quantified social mixing in remote rural areas of developing countries, where the burden of infectious diseases is usually the highest. Understanding social mixing patterns in those settings is crucial to inform the implementation of strategies for disease prevention and control. We characterized contact and social mixing patterns in rural com-munities of the Peruvian highlands.
Methods and Findings
This cross-sectional study was nested in a large prospective household-based study of re-spiratory infections conducted in the province of San Marcos, Cajamarca-Peru. Members of study households were interviewed using a structured questionnaire of social contacts (con-versation or physical interaction) experienced during the last 24 hours. We identified 9015 reported contacts from 588 study household members. The median age of respondents was 17 years (interquartile range [IQR] 4–34 years). The median number of reported con-tacts was 12 (IQR 8–20) whereas the median number of physical (i.e. skin-to-skin) contacts was 8.5 (IQR 5–14). Study participants had contacts mostly with people of similar age, and with their offspring or parents. The number of reported contacts was mainly determined by the participants’age, household size and occupation. School-aged children had more con-tacts than other age groups. Within-household reciprocity of concon-tacts reporting declined with household size (range 70%-100%). Ninety percent of household contact networks were complete, and furthermore, household members' contacts with non-household mem-bers showed significant overlap (range 33%-86%), indicating a high degree of contact clus-tering. A two-level mixing epidemic model was simulated to compare within-household OPEN ACCESS
Citation:Grijalva CG, Goeyvaerts N, Verastegui H, Edwards KM, Gil AI, Lanata CF, et al. (2015) A Household-Based Study of Contact Networks Relevant for the Spread of Infectious Diseases in the Highlands of Peru. PLoS ONE 10(3): e0118457. doi:10.1371/journal.pone.0118457
Academic Editor:Gerardo Chowell, Georgia State University, UNITED STATES
Received:July 25, 2014
Accepted:January 6, 2015
Published:March 3, 2015
Copyright:© 2015 Grijalva et al. This is an open access article distributed under the terms of the
Creative Commons Attribution License, which permits unrestricted use, distribution, and reproduction in any medium, provided the original author and source are credited.
Data Availability Statement:Due to privacy restrictions, the study data cannot be made publicly available but a fully de-identified version can be requested from the principal investigator Carlos G. Grijalva, MD MPH, Vanderbilt University, TN, USA (
mixing based on observed contact networks and within-household random mixing. No dif-ferences in the size or duration of the simulated epidemics were revealed.
Conclusion
This study of rural low-density communities in the highlands of Peru suggests contact pat-terns are highly assortative. Study findings support the use of within-household homoge-nous mixing assumptions for epidemic modeling in this setting.
Introduction
Understanding the transmission of infectious diseases in specific populations is crucial for the tailored design of effective strategies for disease prevention and control. Transmission patterns of infections among humans are closely related to patterns of social interaction.[1–3] Yet until recently, this valuable research area has received very little attention.
Studies on social mixing and contact patterns provide valuable information for mathemati-cal models of disease transmission in specific populations and settings. Measurements of social interactions provide data to inform model parameters that were traditionally based on untested assumptions. Modeling approaches can be improved with the use of auxiliary contact data, which allows a detailed characterization of the interactions among different individuals within a given population or setting.[4–7] Although households are important components in the dis-ease transmission process, relatively little work has been done to estimate contact networks within households.[8] Most transmission models assumed homogeneous mixing within house-holds.[9,10] For example, Fumanelli et al used routine socio-demographic data to compute contact matrices for 26 European countries, but postulated random mixing within households to compute within-household contact matrices.[11]
Social mixing patterns may be influenced by a number of factors including socioeconomic characteristics, the physical environment and geographical location, living and working condi-tions, social and cultural patterns and individual lifestyle choices. These factors are expected to vary by place and time.[3] Most studies on social mixing have been conducted in urban popula-tions of developed countries or highly populated areas.[1–3,12] However, few studies have quantified social mixing in remote rural areas of developing countries,[12–14] where the high prevalence of risk factors for disease and other factors that also facilitate disease transmission likely contribute to a high burden and severity of infectious diseases.[13,14] We sought to study social contact patterns in rural, high-altitude, low population-density communities of the Peruvian Andes.
Methods
Study area and population
The study was conducted in the province of San Marcos, Department of Cajamarca, in the northern highlands of Peru. Nearly all San Marcos inhabitants descend from the same ethnic group of Spaniards mixed with the local indigenous Andean population. The altitude in this province ranges from approximately 1,500 to 4,000 meters above sea level. San Marcos has a mountainous terrain and the average temperature ranges between 8 and 30°C, and varies across the different altitude settings.[13]
default.aspx). NG is beneficiary of a postdoctoral grant from the AXA Research Fund ( http://www.axa-research.org/). The funders had no role in study design, data collection and analysis, decision to publish, or preparation of the manuscript.
Competing Interests:CGG has served as consultant for GSK and Pfizer. NG is currently an employee of Janssen Pharmaceutical Companies of Johnson & Johnson. CFL is an advisor to Takeda Vaccines Division. NH has received support from the University of Antwerp Response to Reviewers Scientific Chair in Evidence-based Vaccinology, financed in 2009–2014 by a gift from Pfizer, Inc. All other authors have no potential competing interests to report. This work was supported by the Vanderbilt University CTSA grant UL1 RR024975 from National Institutes of Health, an investigator initiated research grant from Pfizer (IIR WS1898786(0887X1-4492),
San Marcos’population is comprised of separated accessible rural communities. The popu-lation is mainly low income, low educational level, with limited access to healthcare services. The estimated median age in San Marcos for 2011 was 22 years, and according to the most re-cent census, the average number of people per household was four.[15] The United Nations Development Program (UNDP) [16] estimated that in 2011, the life expectancy at birth was 69.96 years in San Marcos (73.99 years for Peru), the proportion of people 12–16 years old at-tending secondary education was 70.0% (79.9% for Peru), the proportion with secondary edu-cation among 18 years old was 26.2% (66.3% for Peru), the number of years of eduedu-cation among 25 years old or older was 4.9 years (8.8 years for Peru), and the monthly income was ap-proximately US $92 (US $235 for Peru). The estimated Human Development Index (HDI) for San Marcos was 0.2523 (0.4906 for Peru). In addition, the UNDP reported that the proportion of the San Marcos population with a personal identification document was 97.1% (98.2% for Peru), the number of physicians per 10,000 inhabitants was 4.4 (18.6 for Peru), the proportion of houses with potable water and sewage was 68.3% (67.4% for Peru) and the proportion of houses with electricity was 45.1% (82.2% for Peru).[16]
Information on social contact patterns was collected in the context of the Study of Respira-tory Infections in Andean Peruvian children (RESPIRA PERU). In brief, San Marcos’ house-holds with children younger than 3 years of age (index children) were enrolled and followed through weekly household visits from May 2009 through September 2011. The median number of people living in study households was 5, and the materials of which the houses were pre-dominantly made were typical of rural Andean settings, including dirt floors, tile roofs, and mud brick walls. Most houses used open fires or traditional stoves and wood for cooking. Most of the children (91%) in the study received health care through the public health insurance sys-tem of Peru. Most of the households’heads worked in agriculture. Trained field workers col-lected information on respiratory symptoms and gathered respiratory samples when children were ill. That study enrolled children from 58 rural communities in a dynamic cohort, aiming to maintain a sample of approximately 500 children under follow-up at any given time.[13,17–
19]
Data collection
For this study, we aimed to enroll at least two households from each study community. House-hold selection was based on convenience and accessibility to the study field workers. A total of 114 households from 51 communities were invited and all agreed to participate in the study.
Ethics Statement
Among selected households, parents or guardians who had previously provided signed in-formed consent for young children<3 years old to participate in the RESPIRA-Peru project
were informed of this related contact assessment and asked if they would agree to continue with the study, to which they gave their verbal consent. For this assessment of contact patterns, other household members from the selected households were enrolled in the study after the study pro-cedures were explained, questions addressed and verbal informed consent was obtained. The study protocol was approved by the Vanderbilt Institutional Review Board (Nashville TN, USA), and by the Ethics Committee of the Instituto de Investigacion Nutricional, IIN (Lima, Peru).
Data analysis
Number of contacts and participant characteristics. The number of contacts was
re-gressed over the following participant characteristics: age category, sex, relationship, occupa-tion, type of day (weekday or weekend) and household size. We used a random intercepts model (conditional model) to account for the correlation among the number of contacts of in-dividuals belonging to the same household. Fitting the model was done using the INLA pack-age in R. We also fitted a marginal model where the clustering within households was treated as a nuisance parameter. We used a count model in both cases. Overdispersion was allowed using a negative binomial distribution in the random intercepts model, and an overdispersed Poisson distribution was used in the marginal model. We contrasted the multivariate condi-tional model with univariate condicondi-tional models for all covariates. Our primary analysis fo-cused on the number of total contacts; a secondary analysis fofo-cused on the number of physical contacts. For all statistical tests, we considered a 5% significance level.
Contacts by location, duration and frequency. We calculated the proportion of contacts
by location, duration, frequency, type of contact and by participant's age-category.
Who Acquires Infection From Whom (i.e. who has contact with whom)?. To assess the
patterns of contacts based on age categories, we estimated a“who has contact with whom”matrix using the contact data. Under the social contact hypothesis, this contact matrix can be used to in-form a“Who Acquires Infection From Whom”(WAIFW) matrix in this specific study population. [4] Letyijt, (t= 1,. . ., ni,i= 1,. . .I,j= 1,. . .I) denote the number of contacts made by participantt in age-categoryiwith people in age-categoryj. We can then calculate the mean number of
con-tacts made by participants in age-categoryiwith people in age-categoryjasmij¼ni1
Xni
t¼1 yijt.
This approach was further stratified by the type of contact (e.g. physical and non-physical).
Exploration of household contact networks. For this assessment, households that were
clustering was the clustering coefficient calculated from all triplets of two connected household members and a contact outside the household.[20] (SeeSupporting informationfor more details)
Exploration of the impact of household networks on disease transmission. We also
ex-plored the potential impact of the observed household networks on the transmission of dis-eases. For this, we assumed that mixing in the community happened at random, because of a lack of previous knowledge on intra and inter-community mixing in the study setting. We con-ducted epidemic simulations based on a two-level mixing epidemic model to quantify the im-pact of the assumption of random versus network-based mixing within study households while assuming background random mixing between households.[21] Various scenarios using differ-ent transmission rates within and between households were considered. For more details of this model we refer to the Supporting information.
Results
We identified 9015 reported contacts from 588 study household members. The median age of respondents was 17 years (interquartile range [IQR] 4–34 years). Approximately 87% of re-spondents were at home during the first scheduled visit. The majority of interviews were con-ducted during weekdays (83%).
Number of contacts and participant characteristics
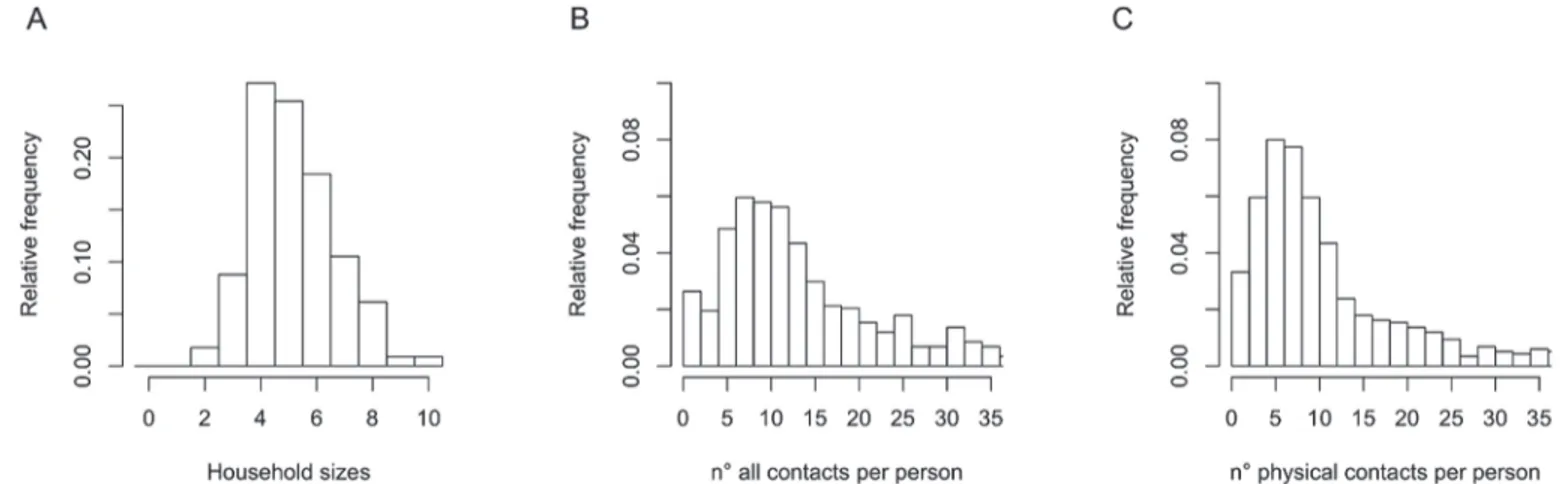
The median number of reported contacts was 12 (IQR 8–20) whereas the median number of physical (skin-to-skin) contacts was 8.5 (IQR 5–14) (Fig. 1).
Table 1shows the results of the conditional univariate, the conditional multivariate and the
marginal model. Note that the multivariate conditional and marginal model, although warranting a different interpretation, yield very similar parameter estimates. Comparing results of the uni-variate and multiuni-variate conditional models shows that taking as many participants' characteris-tics into account is important to obtain a correct interpretation of the relative effect (RE). Indeed, relationship to the index child and sex showed a significant effect on the number of contacts in the conditional univariate models but not in the multivariate models. This effect could be ex-plained by collinearity between the different participant characteristics. For example, when drop-ping occupation from the model and adding sex to the model, sex became significantly associated with the number of contacts. This can be explained by the fact that most people working outside
Fig 1. Distribution of household sizes (panel A).Distribution of the number of all (panel B) and physical (panel C) contacts per person per day ignoring household clustering.
the home are men (92.2%) and most people working at home are women (73.9%). In summary, after accounting for the potential collinearity of model parameters, the number of reported con-tacts was mainly determined by the age of the participants, household size and occupation.
Note that the overdispersion parameter is not shown for the univariate analyses and that REs for the conditional and marginal models are not comparable. All univariate conditional models showed significant overdispersion.
We repeated these analyses focusing on physical contacts and results were similar to those reported here, except for females making fewer physical contacts compared to males (univari-ate conditional model RE 0.73 (0.65–0.81), multivariate conditional model: RE 0.84 (0.75–
0.94) and marginal model: RE 0.82 (0.74–0.92)).
Contacts by location, duration and frequency
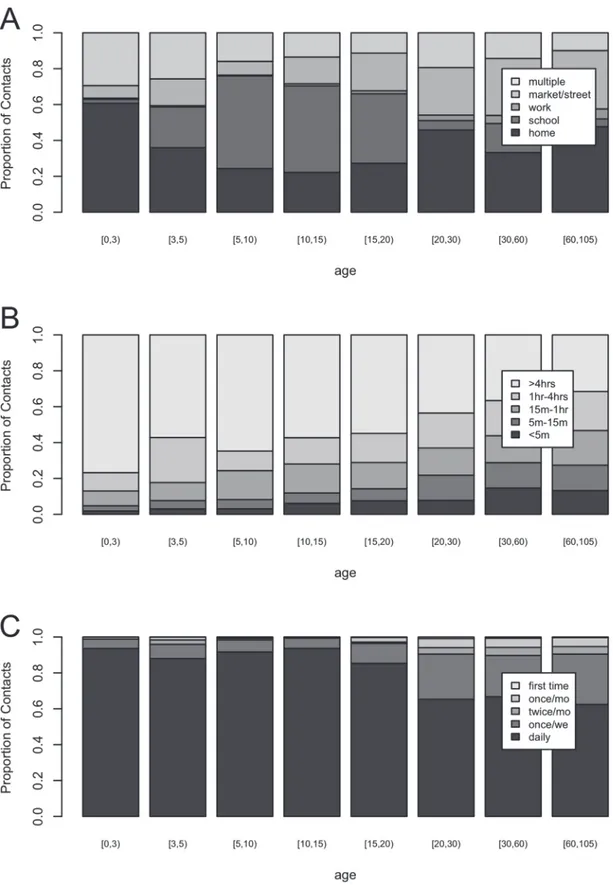
Fig. 2shows the distribution of contact location (panel A), contact duration (panel B) and
con-tact frequency (panel C) by age categories in years ([0,3), [3,5), [5,10], [10,15), [15,20), [20,30), [30,60), and 60+). For panel A, children 0 to 2 years old made most contacts at home, whereas participants 5 to 20 years old made most contacts at school. Participants reported few contacts at work whereas a substantial proportion of contacts was made at the market or street. Note that the category“multiple locations”refers to contacts made at more than one location, whereas all other reported contacts took place at one location only. Overall, participants
Table 1. Relative effects (RE) and 95% confidence intervals (CI) for the number of contacts based on univariate and multivariate conditional models and a multivariate marginal model.
Covariate (baseline: n°)
Category n° Univ. conditional model RE (95% CI) Conditional model RE (95% CI) Marginal model RE (95% CI)
Age 0–2 124 1.00 1.00 1.00
(years) 3–4 30 1.52 (1.23–1.88) 1.32 (0.97–1.81) 1.25 (1.01–1.56)
5–9 61 2.38 (2.03–2.79) 1.48 (1.07–2.06) 1.41 (1.09–1.83)
10–14 56 2.77 (2.36–3.27) 1.66 (1.19–2.31) 1.62 (1.26–2.08)
15–19 36 2.04 (1.68–2.48) 1.50 (1.07–2.10) 1.55 (1.22–1.98)
20–29 93 1.33 (1.16–1.54) 1.34 (0.95–1.90) 1.29 (1.04–1.61)
30–59 139 1.30 (1.14–1.48) 1.31 (0.94–1.84) 1.28 (1.05–1.56)
60–100 24 1.24 (0.98–1.58) 1.22 (0.83–1.79) 1.18 (0.86–1.62)
Sex Male 270 1.00 1.00 1.00
Female 293 0.86 (0.77–0.95) 0.91 (0.82–1.02) 0.93 (0.84–1.02)
Relationship Index 113 1.00 1.00 1.00
(to Index) Mother 112 1.26 (1.09–1.46) 0.97 (0.69–1.38) 0.98 (0.80–1.21)
Father 87 1.34 (1.15–1.57) 0.84 (0.59–1.21) 0.88 (0.68–1.15)
Sibling 162 2.22 (1.94–2.54) 0.89 (0.68–1.18) 0.88 (0.75–1.03)
Grandparent 89 1.51 (1.28–1.78) 0.94 (0.68–1.29) 0.99 (0.78–1.27)
Occupation At home 300 1.00 1.00 1.00
Farmer 93 1.22 (1.09–1.38) 1.15 (0.94–1.41) 1.15 (0.96–1.38)
School 128 2.38 (2.15–2.64) 1.91 (1.57–2.31) 1.97 (1.63–2.36)
Other 42 1.27 (1.07–1.51) 1.19 (0.96–1.48) 1.17 (0.98–1.39)
Day Weekday 469 1.00 1.00 1.00
Weekend 94 0.84 (0.69–1.02) 1.00 (0.85–1.18) 0.97 (0.76–1.22)
Household size 1.11 (1.05–1.17) 1.05 (1.00–1.11) 1.05 (1.00–1.10)
Intercept 7.60 8.17
Overdispersion 6.51 (s.e. 0.64) 5.09 (s.e. 0.57)
Fig 2. Proportion of contacts per category for location (panel A), duration (panel B) and frequency (panel C).
reported a total of 1375 (15.3%) multiple location contacts with the most frequent combina-tions including contacts at home and at the market or street (62.0%), at home and at work (26.2%), at school and at the market or street (24.7%), and at home and at school (16.6%).
When focusing on contact duration, panel B inFig. 2shows that the proportion of long du-ration contacts decreases with participant's age, whereas the proportion of shorter dudu-ration contacts increases with participant’s age. Looking at contact frequency (panel C), daily contacts make up the majority of all contacts for all ages, with an increase in less frequent contacts for participants aged15 years and especially20 years. In summary, young children have more intense contacts and this intensity decreases with increasing age.
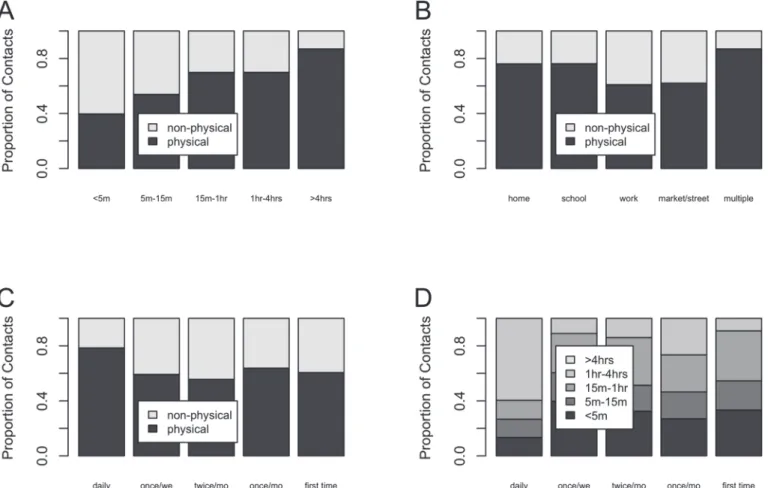
Fig. 3shows the proportion of non-physical and physical contacts by duration (panel A),
lo-cation (panel B) and frequency (panel C) together with the proportion of different categories of contact duration by frequency (panel D). The proportion of physical contacts increases with contact duration, and the majority of physical contacts occurred at home and school. Similarly, the frequency of interactions with the contact person was positively associated with physical contact. Lastly, contacts occurring on a daily basis were more likely to last 4 hours or more.
Who Acquires Infection From Whom?
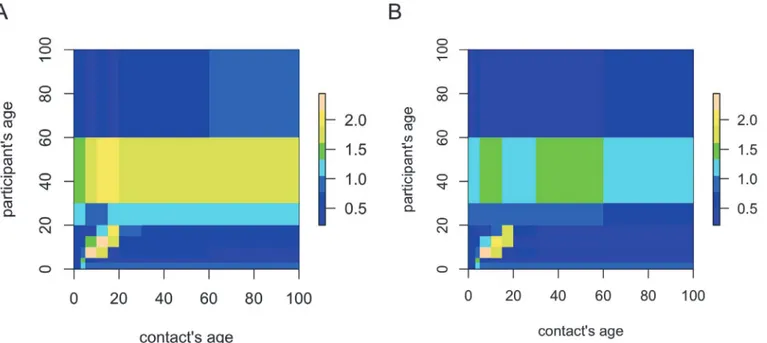
Using age-categories [0,3), [3,5), [5,10], [10,15), [15,20), [20,30), [30,60), and 60+, we calculat-ed the mean number of contacts mijfor all contacts and physical contacts, respectively.Fig. 4
Fig 3. Proportion of physical and non-physical contacts by duration (panel A), location (panel B) and frequency (panel C).Proportion for the different categories of duration by frequency category (panel D).
illustrates the contact matrix log(mij+ 1) for all contacts (panel A) and physical contacts (panel B). These results indicate an assortative social mixing pattern for people aged<20 years
where-as the mixing pattern is more uniform for people aged 20 years and above. The left panel of
Fig. 4shows that people aged 20–60 and 30–60 years also reported a relatively high mean
num-ber of contacts with children and teenagers, respectively, i.e. constituting intergenerational con-tacts. For the age group of 30–60 years, this is also pronounced when restricting to physical contacts only (Fig. 4, right panel). Note that the reverse, i.e. contacts with adults reported by children or teenagers, is not observed.
Exploration of Household Contact Networks
Table 2summarizes household network properties by household size. Household reciprocity
seems to decrease with increasing household size. The fraction of completely connected house-holds, assuming non-reciprocal links are in fact reciprocal, is generally high except for large households (7 members). The mean network density is high for all household sizes though
Fig 4. Logarithm of the mean number of contacts plus one for all recorded contacts (panel A) and for physical contacts only (panel B).Yellow indicates higher values while blue indicates lower values relative to the overall mean number of contacts.
doi:10.1371/journal.pone.0118457.g004
Table 2. Household size frequency for all households and for households for which all members were sampled on the same day and reported contacts (eligible households), and important contact network characteristics based on these eligible households: reciprocity, connectedness (proportion complete, network density) and clustering.
Household size (number of members) 2 3 4 5 6 7 8 9
# eligible households/# households 2/2 6/10 20/31 11/29 8/21 4/12 2/7 1/1
Overall reciprocity 1.000 1.000 0.833 0.927 0.933 0.869 0.696 0.722
Proportion of completely connected households 1.000 1.000 0.950 0.909 1.000 0.750 0.000 0.000
Mean network density 1.000 1.000 0.992 0.998 1.000 0.988 0.946 0.778
Clustering 0.702 0.784 0.605* 0.449 0.531 0.409 0.328 0.861
its value is smaller for the household of size 9 for which one individual did not report any con-tacts with other household members. Clustering coefficients ranged from 0.328 to 0.861 with a majority of values larger than 0.5, but generally decreased with increasing household size. This suggests that contacts outside the household tended to be shared by household members and that clustering is important to consider when including household contact networks in transmission models.
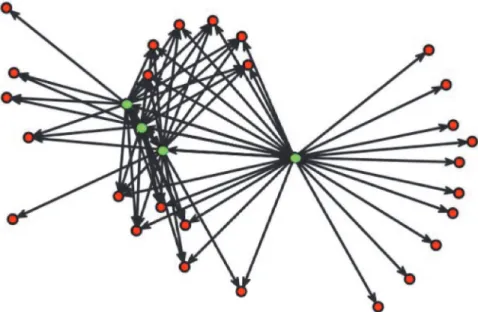
For a randomly selected household of size 4,Fig. 5illustrates the common interaction of household members with other non-household members, reflected by the relatively large clustering coefficient.
Impact of household networks on disease transmission
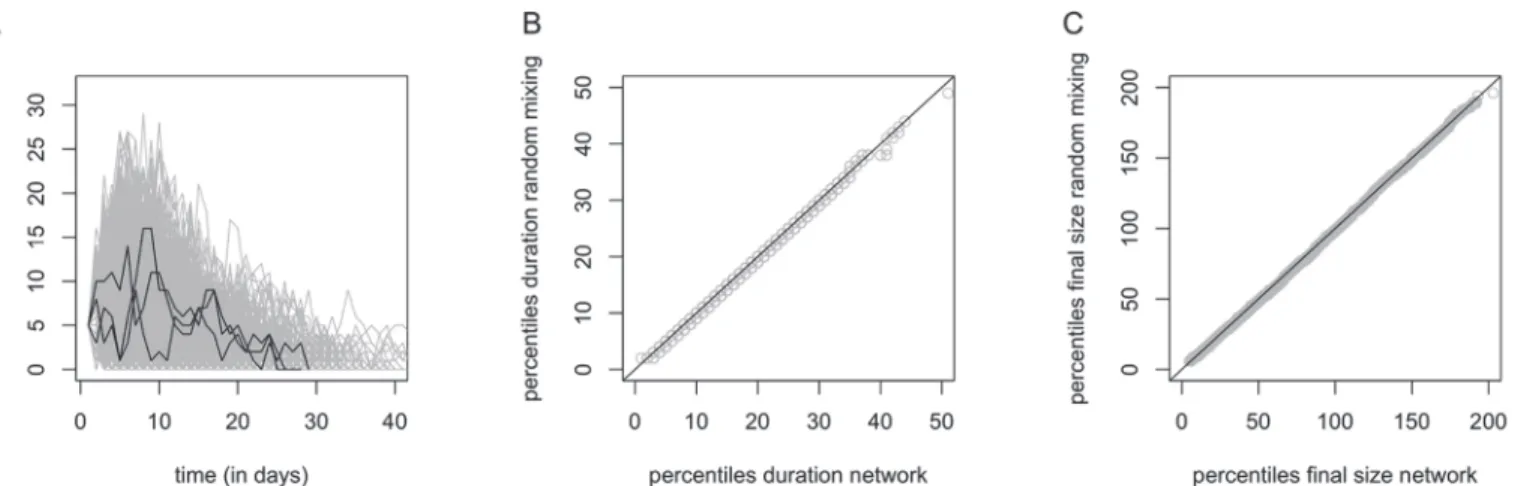
Our comparison of simulated epidemics assuming within-household random mixing and with-in-household mixing based on the observed household networks did not reveal any distin-guishable difference between the epidemic curves (Fig. 6, panel A: curves only displayed for the observed household networks), the size and duration of the simulated epidemics (Fig. 6, panels B and C). This comparison was based on 5000 simulated epidemics using a 2-level mixing model with 5 randomly distributed introductory cases. Other scenarios using a different num-ber of introductory cases and/or different transmission rates within and between households yielded similar results (not shown).
Discussion
We studied the underlying contact patterns upon which respiratory infections could spread in rural low-density community settings of the Peruvian Andes. In this household-based study, we observed a highly assortative pattern of social mixing where participants frequently inter-acted with other people of similar age, especially among children and adolescents. Interestingly, long duration and physical contacts were commonly reported by participants. Furthermore,
Fig 5. A directed contact network for a randomly selected household of size 4.Vertices are either household members (green) or contacts outside the household reported by these household members (red). Directed edges represent contacts as reported by household members.
the exploration of household networks suggest frequent and intense contacts among household members and common interaction with non-household members.
Compared with other contact assessments conducted in developed or semi-rural areas of developing countries,[1–3,12] the overall patterns of social mixing seem largely comparable. However, the proportion of frequent and physical contacts seems to be higher in the rural An-dean communities. As infection transmission is likely favored by these types of intense interac-tions,[22] our observations are valuable to understand the burden and transmission patterns of respiratory infectious diseases in the study communities.
The optimal strategy for quantifying contact patterns remains unclear. Some investigators advocate prospective collection of contact data where participants record their encounters made during the study days. A few studies comparing prospective versus retrospective collec-tion of informacollec-tion suggest that more contacts would be captured through a prospective data collection strategy when compared with a retrospective assessment.[3] Other evaluations did not find significant differences between these approaches.[23] Yet other studies have reported that retrospective collection of data would yield a larger number of contacts recorded.[24]
Although direct observation could provide an objective assessment of social mixing patterns in a given population, implementing such a measurement can be cumbersome and logistically challenging. Such a study design might be perceived as overly invasive and concerns about con-fidentiality might arise. This approach of direct observation may be better suited to closed envi-ronments where close monitoring could be accomplished provided the aforementioned concerns have been properly addressed. The recording of social interactions based on struc-tured interviews and surveys is thus more feasible, at least currently. One advantage of our study is the use of a short and easy-to-administer study instrument that can be completed in an interview format. The same form has been applied previously in other urban locations and thus, the consistent use of a similar instrument facilitates the comparison of findings.[1,12] Furthermore, the form is detailed enough to enable the time-space characterization of the re-ported contacts.[3]
With regard to the household networks, our exploration identified an intense pattern of so-cial mixing within study households, with a frequent potential for introduction of new infec-tions into the households, although the actual spread of contagion was not evaluated.
Interestingly, based on simulated epidemics, the observed pattern of within-household mixing
in the study communities seems to be equivalent to the empirical random mixing assumed in previous simulation studies.[9,10] The conduct of similar household-based studies in other set-tings would be helpful to complement these observations.
Our assessment is subject to several limitations. Although we restricted our retrospective as-sessment to one day to minimize recall issues, recall could have still remained a problem. For example, some shorter encounters may have been forgotten.[25] Some participants may have reported contacts for an atypical day, for instance they may have been sick during the assess-ment, but we were not able to make that distinction in our study. Our data were collected with-in a few months, and roughly durwith-ing the same season. Previous studies have suggested that social mixing may vary depending on the season and weather-related changes.[26] We focused on contacts including conversations and physical contacts but there may be other types of en-counters relevant for transmission of infections that were not recorded (e.g. close proximity to other people during the weekend at open markets may be enough for transmission of patho-gens without the need to establish a type of contact used in our study).[3] We also acknowledge that households participating in this study were selected based on convenience and on the pres-ence of index children younger than 3 years of age and that the household network analyses were conducted in households for which all participants were at home on the day of the inter-view. Thus, these households may not be representative of the general population. So extrapo-lation of our findings to different settings requires careful consideration of our selection criteria. Nevertheless, our assessment provides novel information from an underserved popula-tion tradipopula-tionally excluded from research. Ironically, this is a populapopula-tion that usually bears most of the brunt of mortality due to severe respiratory diseases.[14]
The study of the patterns of social interactions in rural Andean communities, suggest that contacts were highly assortative and appear to involve more physical contacts (especially at home and school) than previously described for other studies conducted in more developed and populated areas.[1–3,12] These observations can inform potential interventions including social distancing or other non-pharmaceutical interventions to mitigate the transmission of in-fectious diseases in these settings.
Supporting Information
S1 Fig. Age distribution of study participants and the underlying population of San Mar-cos.The dashed line represents the age distribution of the study population. The solid line rep-resents the age distribution of the San Marcos population.
(TIFF)
S2 Fig. Subgraph of order three with two household members (red nodes) and one
non-household member (blue node).The solid blue lines make up a connected triplet whereas the
dashed-dotted line shows the edge which determines whether the subgraph is a triangle (ob-served edge) or not (missing edge).
(TIF)
S1 Supporting Information. Additional information about the methods used in the manu-script.
(DOCX)
S1 Survey Form.
Acknowledgments
On behalf of the study of Respiratory Infections in Andean Peruvian children (RESPIRA PERU): Vanderbilt University, Marie R. Griffin, John V. Williams, Kathryn M. Edwards, Philip J. Budge, Yuwei Zhu, Monika Johnson, Carlos G. Grijalva; Emory University, Jorge E. Vidal, Keith P. Klugman; Instituto de Investigacion Nutricional, Ana I. Gil, Hector Verastegui, Clau-dio F. Lanata. We are indebted to the communities of San Marcos, Cajamarca Peru for their participation in this study. We also acknowledge the approval and continuous support of the Cajamarca Health Region authorities. We are also indebted to the field workers and field super-visors whose efforts in difficult geographical areas and harsh weather conditions allowed the conduct of this study.
Author Contributions
Conceived and designed the experiments: CGG CFL NH. Performed the experiments: CGG HV AIG CFL NH. Analyzed the data: CGG HV NH. Contributed reagents/materials/analysis tools: CGG NG HV KME AIG CFL NH. Wrote the paper: CGG NG HV KME AIG CFL NH.
References
1. Mossong J, Hens N, Jit M, Beutels P, Auranen K, Mikolajczyk R, et al. Social contacts and mixing pat-terns relevant to the spread of infectious diseases. PLoS Med. 2008; 5: e74. doi:10.1371/journal. pmed.0050074PMID:18366252
2. Johnstone-Robertson SP, Mark D, Morrow C, Middelkoop K, Chiswell M, Aquino LD, et al. Social mix-ing patterns within a South African township community: implications for respiratory disease transmis-sion and control. Am J Epidemiol. 2011; 174: 1246–1255. doi:10.1093/aje/kwr251PMID:22071585
3. Read JM, Edmunds WJ, Riley S, Lessler J, Cummings DA. Close encounters of the infectious kind: methods to measure social mixing behaviour. Epidemiol Infect. 2012; 140: 2117–2130. doi:10.1017/ S0950268812000842PMID:22687447
4. Wallinga J, Teunis P, Kretzschmar M. Using data on social contacts to estimate age-specific transmis-sion parameters for respiratory-spread infectious agents. Am J Epidemiol. 2006; 164: 936–944. PMID: 16968863
5. Ogunjimi B, Hens N, Goeyvaerts N, Aerts M, Van Damme P, Beutels P. Using empirical social contact data to model person to person infectious disease transmission: an illustration for varicella. Mathemati-cal biosciences. 2009; 218: 80–87. doi:10.1016/j.mbs.2008.12.009PMID:19174173
6. Goeyvaerts N, Hens N, Ogunjimi B, Aerts M, Shkedy Z, Van Damme P, et al. Estimating infectious dis-ease parameters from data on social contacts and serological status. Journal of the Royal Statistical Society Series C-Applied Statistics. 2010; 59: 255–277.
7. Melegaro A, Jit M, Gay N, Zagheni E, Edmunds WJ. What types of contacts are important for the spread of infections?: using contact survey data to explore European mixing patterns. Epidemics. 2011; 3: 143–151. doi:10.1016/j.epidem.2011.04.001PMID:22094337
8. Potter GE, Hens N. A penalized likelihood approach to estimate within-household contact networks from egocentric data. J R Stat Soc Ser C Appl Stat. 2013; 62: 629–648. PMID:23935218
9. Halloran ME, Ferguson NM, Eubank S, Longini IM Jr., Cummings DA, Lewis B, et al. Modeling targeted layered containment of an influenza pandemic in the United States. Proc Natl Acad Sci U S A. 2008; 105: 4639–4644. doi:10.1073/pnas.0706849105PMID:18332436
10. Ferguson NM, Cummings DA, Fraser C, Cajka JC, Cooley PC, Burke DS. Strategies for mitigating an influenza pandemic. Nature. 2006; 442: 448–452. PMID:16642006
11. Fumanelli L, Ajelli M, Manfredi P, Vespignani A, Merler S. Inferring the structure of social contacts from demographic data in the analysis of infectious diseases spread. PLoS Comput Biol. 2012; 8:
e1002673. doi:10.1371/journal.pcbi.1002673PMID:23028275
12. Horby P, Pham QT, Hens N, Nguyen TT, Le QM, Dang DT, et al. Social contact patterns in Vietnam and implications for the control of infectious diseases. PloS one. 2011; 6: e16965. doi:10.1371/journal. pone.0016965PMID:21347264
14. Huicho L, Trelles M, Gonzales F, Mendoza W, Miranda J. Mortality profiles in a country facing epidemi-ological transition: an analysis of registered data. BMC Public Health. 2009; 9: 47. doi: 10.1186/1471-2458-9-47PMID:19187553
15. Instituto Nacional de Estadistica e Informatica (INEI). Sistema de Difusion de los Censos Nacionales. Available:http://ineidw.inei.gob.pe/ineidw/#. Accessed on 2014 Nov 2.
16. United Nations Development Program—Peru. Informe sobre Desarrollo Humano Perú 2013. Cambio climático y territorio: Desafíos y respuestas para un futuro sostenible. Available:http://www.pe.undp. org/content/peru/es/home/library/poverty/Informesobredesarrollohumano2013/IDHPeru2013/. Ac-cessed 2014 Nov 1.
17. Grijalva CG, Griffin MR, Edwards KM, Williams JV, Gil AI, Verastegui H, et al. The role of influenza and parainfluenza infections in nasopharyngeal pneumococcal acquisition among young children. Clin In-fect Dis. 2014; 58: 1369–1376. doi:10.1093/cid/ciu148PMID:24621951
18. Budge PJ, Griffin MR, Edwards KM, Williams JV, Verastegui H, Hartinger SM, et al. A household-based study of acute viral respiratory illnesses in Andean children. Pediatr Infect Dis J. 2014; 33: 443–447. doi:10.1097/INF.0000000000000135PMID:24378948
19. Budge PJ, Griffin MR, Edwards KM, Williams JV, Verastegui H, Hartinger SM, et al. Impact of home en-vironment interventions on the risk of influenza-associated ARI in Andean children: observations from a prospective household-based cohort study. PLoS One. 2014; 9: e91247. doi:10.1371/journal.pone. 0091247PMID:24622044
20. Kolaczyk E. Statistical Analysis of Network Data: Methods and Models. New York: Springer. 2009.
21. Ball F, Mollison D, Scalia-Tomba G. Epidemics with two levels of Mixing. The Annals of Applied Proba-bility. 1997; 7: 46–89.
22. Smieszek T. A mechanistic model of infection: why duration and intensity of contacts should be includ-ed in models of disease spread. Theor Biol Minclud-ed Model. 2009; 6: 25. doi:10.1186/1742-4682-6-25 PMID:19919678
23. Beutels P, Shkedy Z, Aerts M, Van Damme P. Social mixing patterns for transmission models of close contact infections: exploring self-evaluation and diary-based data collection through a web-based inter-face. Epidemiol Infect. 2006; 134: 1158–1166. PMID:16707031
24. McCaw JM, Forbes K, Nathan PM, Pattison PE, Robins GL, Nolan TM, et al. Comparison of three meth-ods for ascertainment of contact information relevant to respiratory pathogen transmission in encounter networks. BMC Infect Dis. 2010; 10: 166. doi:10.1186/1471-2334-10-166PMID:20537186
25. Smieszek T, Burri EU, Scherzinger R, Scholz RW. Collecting close-contact social mixing data with con-tact diaries: reporting errors and biases. Epidemiol Infect. 2012; 140: 744–752. doi:10.1017/
S0950268811001130PMID:21733249
![Fig. 2 shows the distribution of contact location (panel A), contact duration (panel B) and con- con-tact frequency (panel C) by age categories in years ([0,3), [3,5), [5,10], [10,15), [15,20), [20,30), [30,60), and 60+)](https://thumb-eu.123doks.com/thumbv2/123dok_br/18369825.355159/6.918.58.862.154.653/distribution-contact-location-panel-contact-duration-frequency-categories.webp)