www.atmos-chem-phys.net/9/2987/2009/ © Author(s) 2009. This work is distributed under the Creative Commons Attribution 3.0 License.
Chemistry
and Physics
Assessment of the MODIS Collections C005 and C004 aerosol
optical depth products over the Mediterranean basin
C. D. Papadimas1,2, N. Hatzianastassiou1,2, N. Mihalopoulos3, M. Kanakidou3, B. D. Katsoulis1, and I. Vardavas2,4
1Laboratory of Meteorology, Department of Physics, University of Ioannina, 45110 Ioannina, Greece 2Foundation for Research and Technology-Hellas, Heraklion, Crete, Greece
3Environmental Chemical Processes Laboratory, Department of Chemistry, University of Crete, P.O. Box 2208, 71003 Heraklion, Crete, Greece
4Department of Physics, University of Crete, 71110 Heraklion, Crete, Greece
Received: 3 June 2008 – Published in Atmos. Chem. Phys. Discuss.: 9 September 2008 Revised: 2 December 2008 – Accepted: 24 March 2009 – Published: 7 May 2009
Abstract. The second generation Collection 005 (C005)
MODIS operational algorithm for retrieval of aerosol prop-erties was evaluated and validated for the greater Mediter-ranean basin (29.5◦N–46.5◦N and 10.5◦W–38.5◦E), a re-gion with an atmosphere under siege by air pollution and diminishing water resources that are exacerbated by high aerosol loads and climatic change. The present study aims to quantify the differences between the C005 and the pre-vious (C004) MODIS collections, and re-assess the results of previous studies that have been performed for the region using MODIS C004 aerosol optical depth (AOD) products. Daily data of AOD from EOS-Terra covering the 6-year pe-riod 2000–2006 were taken from both C005 and C004 Level-3 datasets, and were inter-compared and validated against ground-based measurements from 29 AERONET stations. The C005 data were found to significantly better agree with the AERONET data than those of C004. The correlation coefficient between MODIS and AERONET was found to increase from 0.66 to 0.76 and the slope of linear regres-sion MODIS/AERONET from 0.79 to 0.85. The MODIS C005 data still overestimate/underestimate the AERONET AOD values smaller/larger than 0.25, but to a much smaller extent than C004 data. The better agreement of C005 with AERONET data arises from the generally lower C005 val-ues, with regional mean AOD values equal to 0.27 and 0.22 for C004 and C005, respectively. This decrease, however, is not uniform over the region and involves a significant de-crease over land and a small inde-crease over the ocean for AOD values greater than 0.1 (opposite changes were found under aerosol-clean conditions). Both data sets indicate a decrease
Correspondence to:N. Hatzianastassiou ([email protected])
in the regional mean AOD over the period 2000–2006, equal to 20% based on C005 and 17% based on C004 datasets, though the intra-annual and inter-annual variation did not change significantly, thus indicating a systematic correction to C004 values.
1 Introduction
The Moderate Resolution Imaging Spectroradiometer (MODIS) sensor on the Terra and Aqua satellites is retrieving daily global aerosol products over land and ocean in a vari-ety of spectral bands from blue to thermal infra-red (Kauf-man et al., 1997; Remer et al., 2005) every 1–2 days with a 16-day repeat cycle. Terra and Aqua (both with a 705 km orbit) are in a sun-synchronous, near polar, circular orbit. Aqua crosses the equator daily at 1:30 p.m. LT as it moves north (ascending mode) in contrast to Terra, which crosses the equator at 10:30 a.m. daily (descending mode). Since its first launch (18 December 1999), the MODIS aerosol al-gorithm has been continually updated and evaluated by the MODIS scientific team. This resulted in a complete set of products, called Collection 004 (C004), that are based on MODIS algorithm version V4.2.2 (Kaufman et al., 1997; Tanre at al., 1997; Levy et al., 2003; Remer et al., 2005). To date, many studies (e.g. Remer et al., 2001, 2002, 2005; Chu et al., 2002; Ichoku et al., 2002; Vermote et al., 2002; Xia et al., 2004; Levy et al., 2005) have been carried out validat-ing the MODIS aerosol products against those retrieved from ground-based sun photometer observations, mainly those of AERONET. Most of these validation studies have shown that although MODIS aerosol optical depth (AOD) values were within the expected error, the lower AOD values were over-estimated and the higher AOD values were underover-estimated (Chu et al., 2002; Remer et al., 2005; Levy et al., 2005). Specifically over bright surfaces and dust regions, a num-ber of studies (Kaufman et al., 2000; Chin et al., 2004; Tri-pathi et al., 2005; Jethva et al., 2007; Santese et al., 2007a) have shown that mainly because of spatial heterogeneity and higher uncertainty associated with the surface reflectance, the MODIS C004 AOD tended to be overestimated compared to ground-based observations.
The systematic biases of the MODIS C004 algorithm, mainly over land, led the MODIS team to improve the re-trieval algorithm. The new version V5.2 of the MODIS algo-rithm, called Collection 005 (C005), was implemented re-cently (Levy et al., 2007a, b) to correct systematic biases of the earlier used MODIS algorithm C004. The com-plete description of the new second-generation algorithm and its major changes with respect to the previous one can be found in the “Algorithm Theoretical Basis Document for Collection 5” (ATBD-2006; available at: http://modis-atmos. gsfc.nasa.gov/MOD04{ }L2/index.html) and in other works (Levy et al., 2007a, b). In brief, the major changes in the sec-ond generation MODIS operational algorithm include: (1) improved aerosol retrieval algorithms, mainly over land and less over ocean, (2) use of five updated aerosol models and optical properties over land, based on (Dubovik et al., 2002) with some modification, (3) new look up table (LUT) calcu-lations based on the combination of MIEV code (Wiscombe, 1981) and RT3 radiative transfer code (Evans and Stephens, 1991) accounting for the effects of polarization, (4) new sur-face reflectance assumptions permitting its estimation in the visible (660 and 470 nm) from the reflectance in the near
infrared (2130 nm) including dependency on vegetation and scattering angles. Also, there is a number of further changes concerning for example snow and cloud masks, cloud frac-tions, ranges of AOD values, CCN (cloud condensation nu-clei) units or real and imaginary refractive indices.
In the present study, we evaluate the differences between the six-year (2000–2006) MODIS Terra C005 and C004 AOD daily products at 550 nm (AOD550) retrieved by these two algorithms. The evaluation is of great interest to docu-ment the differences between the two MODIS collections, and re-assess the results of previous studies (Barnaba and Gobbi, 2004; Ichoku et al., 2005; Levin et al., 2005; Meloni et al., 2006; Kaskaoutis et al., 2007; Santese et al., 2007a, b) that have been performed for the region using MODIS C004 AOD products. The evaluation is performed at the geograph-ical cell (1◦×1◦ latitude-longitude) level over the greater Mediterranean basin. This region is of particular impor-tance because it is a crossroad where aerosols from different sources are superimposed and mixtures of different kinds of particles converge (e.g. Lelieveld et al., 2002) such as fine anthropogenic aerosols from Europe, desert dust from North Africa and maritime aerosols from the Mediterranean Sea. In addition, in the Mediterranean basin aerosols exert a strong climatic effect especially in summer, due to the cloud-free conditions and high solar radiation intensity. The evaluation of the two datasets is performed through comparison of both the reprocessed MODIS C005 and the previous C004 AOD at 550 nm (AOD550) products against corresponding data de-rived from 29 AERONET stations located within the study region. In addition, the two types of MODIS AOD products are inter-compared at 900 geographical cells covering the en-tire study region. In the comparison, emphasis is given to dif-ferences between land and ocean areas of the Mediterranean basin.
2 Aerosol optical depth data
Global time-series of aerosol parameters have been pro-duced from MODIS/Terra (EOS AM-1) since its launch on 18 December 1999 and from MODIS/Aqua (EOS PM-1) since 4 May 2002. The pre-launch uncertainty (theo-retical error) of the MODIS aerosol optical depth (AOD) is ±0.05±0.15(AOD) over land (Chu et al., 2002) and ±0.03±0.05(AOD) over ocean (Remer et al., 2002). The spatial resolution of MODIS (pixel size at nadir) is 250 m, 500 m and 1000 m, depending on the spectral band.
with a horizontal resolution of 1◦×1◦. Thus, 900 cells are available for each day of the 6-year study period. The present study focuses on the AOD at the wavelength of 550 nm (AOD550) over land and ocean, because it is near the peak of the solar spectrum and thus associated with large radia-tive effects, and because AOD is usually given at this wave-length by the various available aerosol datasets. Overall, a total of 2191 daily sets of AOD550data were analysed for the 900 grid points (1◦×1◦cells) of the study region. Also, mean daily regional values were calculated for the entire study pe-riod and time series were generated.
The MODIS satellite C004 and C005 AOD550 data were evaluated against corresponding surface-based mea-surements from 29 AERONET stations in the study region. AERONET is a network of sun/sky radiometers that mea-sure solar extinction every 15 min within the spectral range 340–1020 nm (Holben et al., 2001) used to derive total col-umn aerosol properties (Holben et al., 1998; Dubovik and King, 2000; Dubovik et al., 2000, 2002). Under cloud-free conditions, the overall uncertainty in AOD data is ±0.01 for wavelengths greater than 440 nm and±0.02 for shorter wavelengths. Over the last years the AERONET network has been expanded to cover a large part of the Mediterranean basin. The 29 stations were selected based on the criteria of (i) sufficient daily AOD Level 2.0 (Quality Assured) data availability from 1 March 2000 to 28 February 2006 and (ii) complete spatial coverage of the study region.
The AERONET AOD data were compared against the av-erage AOD data of the MODIS 1◦×1◦latitude-longitude ge-ographical cell including each AERONET station, for each day of our 6-year study period. This provides a large number of matched data pairs and enables good statistics. Note that using daily averaged AERONET AOD values for the com-parisons with MODIS data induces some uncertainty due to the diurnal variability of aerosol optical depth. This uncer-tainty has to be taken into account in the following section. For example, analysis of the diurnal cycle over major indus-trial/urban areas showed an increase in the optical depth by 10–40% during the day depending on the site (Smirnov et al., 2002). The amplitude of the diurnal variability is<10% over most sites where dust and maritime aerosols are the major contributors, whereas the variability is larger over ur-ban/industrial sites. Furthermore, when averaged over the course of the day, the mean AERONET AOD values are very close (Smirnov et al., 2002) to the mean values in the time window frame within±30 min of the MODIS overpass, min-imizing thus the uncertainty induced by the use of daily mean AERONET values.
3 Aerosol optical depth comparison
Figure 1a shows the six-year (2000–2006) average spatial distribution of AOD550over the broader Mediterranean basin (both land and ocean) based on daily Collection 004 MODIS
(a)
(b)
(c)
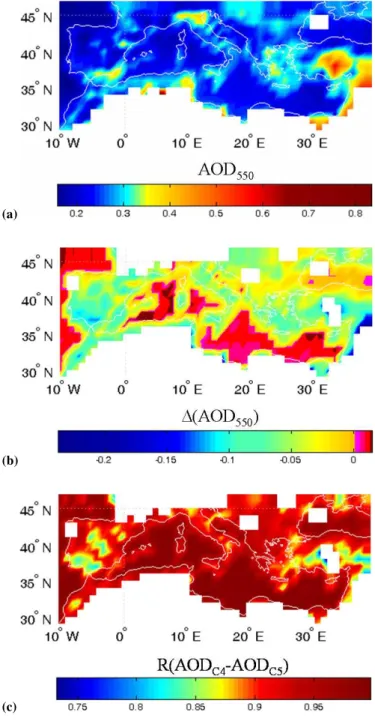
Fig. 1. (a)Six-year (2000–2006) average spatial distribution of aerosol optical depth (AOD) at 550 nm (both land and ocean), over the broader Mediterranean basin based on daily Collection 004 MODIS data. The white areas correspond to 1◦×1◦ longitude-latitude geographical cells with less than 50% of total number of daily data.(b)Spatial distribution of absolute differences between the Collection 005 and Collection 004 MODIS six-year averages of AOD at 550 nm over the broader Mediterranean basin. (c) Spa-tial distribution of correlation coefficients (R) between daily aerosol optical depth data at 550 nm from MODIS Collection 004 (AODC4)
and Collection 005 (AODC5) over the broader Mediterranean basin
data gridded in 1◦×1◦cells. The white areas correspond to 1◦×1◦ longitude-latitude geographical cells with less than 50% of total number of data. The application of this cri-terion resulted in omitting AOD data over northern African desert areas in Fig. 1a, where AOD values are high and range from 0.8 to 1.15. High AOD550values (>0.4) are found over areas with intense anthropogenic activity, like the industrial region of the Po Valley in Northern Italy and the megacity of Cairo. Large AOD550 values also appear over regions with significant desert aerosol loads like North Africa, Southeast Spain, central Mediterranean, the Middle-East and the Ana-tolian plateau in Central Turkey. The computed regional and annual mean value of MODIS C004 AOD550for the broader Mediterranean basin is equal to 0.27±0.21, with the standard deviation showing a significant spatial variability.
Figure 1b displays the geographical distribution of abso-lute differences between C005 and C004 MODIS AOD550 data derived on a daily basis and then averaged over the en-tire 6-year period. In general, the differences are mostly negative indicating that the MODIS C004 mainly overesti-mates AOD with respect to C005 by up to 0.23. In Fig. 1b, the differences range from −0.05 to −0.23 over land sur-faces, whereas along coastal areas they vary within the range of values from −0.01 to −0.05. Note that when the data availability criterion is not applied much stronger overesti-mation of AOD by MODIS C004 is obtained with respect to C005 (AOD differences ranging from −0.25 to −0.6) over limited areas in Northern Africa located just below the coloured edges of N. Africa in Fig. 1b. Only over most ma-rine locations in Fig. 1b there are small positive differences (<0.012), indicating a slight underestimation of marine AOD by MODIS C004 compared to C005. Our results indicate that the new second generation (C005) MODIS aerosol retrieval algorithm V5.2 has significantly corrected the AOD products mainly over land (Remer et al., 2006, http://modis-atmos. gsfc.nasa.gov/products C005update.html). The fact that the corrections in AOD affect mainly values over land indi-cates the importance of the applied corrections in surface reflectance in the C005 MODIS algorithm. More specifi-cally, the corrections are due to the use in C005 of surface reflectance relationships that are function of vegetated in-dex and scattering angle. In the previous versions (C004) of the algorithm, the following fixed relationships between the visible surface reflectances (at 470 nm and 660 nm,ρ470 andρ660, respectively) and the shortwave near infrared re-flectance (at 2130 nm,ρ2130) measured at the top of atmo-sphere were used
ρ470=0.25·ρ2130 ρ660=0.50·ρ2130
(1) In C005 the fixed in space and time relationships (1) were replaced (see Remer et al., 2006) by
ρ660=f1(MVI, 2)·ρ2130 ρ470=f2(MVI, 2)·ρ2130
(2)
where
MVI=(ρ1240−ρ2130)/(ρ1240+ρ2130) (3) which is sensitive to vegetation and2is the scattering angle. The new relationships allow for a dependence on the degree of surface coverage by vegetation and viewing geometry, ac-counting for some of the scatter introduced Bi-directional Reflectance Distribution Functions (BDRF). Taking into ac-count that land surfaces exhibit large spatio-temporal vari-ability and have strong BDRF, the larger corrections in C005 over land than ocean can be explained. Consequently, the largest differences between C004 and C005 AOD are found over land areas, which are characterized by large surface albedos and AOD550 values due to the influence of desert aerosols, like North Africa, South Spain, Anatolian plateau and Middle East. In these areas, the relative percentage dif-ferences (not shown here) are as high as 45%. In contrast, the differences above the Northern Mediterranean Sea do not ex-ceed−0.01. The correction in C005 AOD values can also be partially attributed to the introduction of new aerosol models. The C005 algorithm uses updated aerosol models based on Dubovik et al. (2002) and derived using “subjective cluster analysis” of AERONET Level-2 data which yields three fine-dominated models and one spheroid dust model with new ge-ographic distribution of fine dominated models.
The computed annual mean AOD550from MODIS C005 data for the broader Mediterranean basin equals 0.22±0.07. This value, compared to the corresponding MODIS C004 value of 0.27±0.21, indicates a 23% overestimate of AOD550 by C004 with respect to the C005 dataset, associated with a larger spatial variability of the C004 dataset.
In Fig. 1c we show the spatial distribution of the com-puted correlation coefficients (R) between daily aerosol op-tical depth data at 550 nm from Collection 004 (AODC4) and Collection 005 (AODC5) over the broader Mediterranean basin (both land and ocean), over the six-year (2000–2006) study period. We thus obtain temporally resolved informa-tion on possible differences between C004 and C005. Over most places of the study region, the correlation coefficients are larger than 0.85 with better agreement between the two MODIS collections (correlation coefficients>0.9) occurring over maritime than continental areas. Therefore, it appears that in general the improvement of the MODIS algorithm did not create inter-annual changes in AOD values over the re-gion. This implies that plates like that of Fig. 1b can be used to correct, to a good approximation, the MODIS C004 AOD values regardless of the year.
period of the year (March to October, 12–22%) than in the colder/wetter period (November to February, 5–11%). This indicates that the correction in C005 AOD values in the Mediterranean basin reflects, to a large extent, the corrected surface reflectance relationships as function of vegetation in-dex and scattering angle. Drier surfaces during the warm period of the year (March to October) exhibit larger surface albedos than during the wet period (November to February), implying thus larger corrections in AOD. Note, however, that the seasonal variability of AOD is not significantly changed, presenting double maxima in spring and summer, though the summer maximum is less pronounced in C005 than in C004. The role of the use of updated aerosol models in C005 al-gorithm has also to be considered. The spring and summer AOD maxima of Fig. 2a are mainly associated with high desert dust loads in the eastern and central basin, respec-tively, transported by Mediterranean cyclones (e.g. Moulin et al., 1998). Taking this into account, the identified AOD differences between the two MODIS Collections, which are significant in spring and summer, indicate that the previous MODIS algorithm had problems mainly in areas and seasons characterized by significant aerosol loads, as also reported by others (Tripathi et al., 2005; Santese et al., 2007a, b). Never-theless, given that the largest reductions in AOD from C004 to C005 are not concurrent with maximum AOD values, it seems that corrections in surface reflectance are primarily re-sponsible for the AOD seasonal differences between the two MODIS collections.
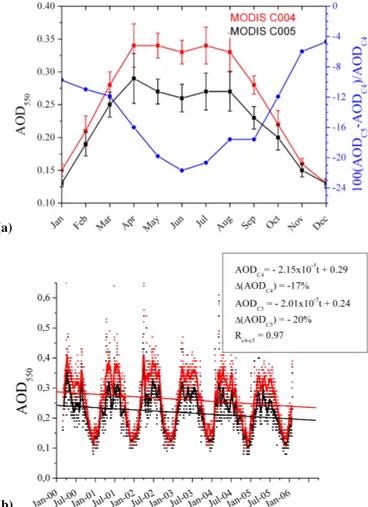
To date, several studies (Massie et al., 2004; Streets et al., 2006; Koukouli et al., 2006; Kazadzis et al., 2007; Kishcha et al., 2007; Mishchenko et al., 2007; Papadimas et al., 2008) using either MODIS or other datasets (e.g. Total Ozone Mapping Spectrometer, TOMS, Advanced Very High Resolution Radiometer, AVHRR, or ground-based measure-ments) reported a decreasing tendency in AOD during the last years. Tendencies derived from MODIS C004 data could be questioned because of known problems with the MODIS V4.2.2 AOD retrieval algorithm with respect to sur-face reflectance. Using AOD550 data from the C004 and C005 datasets, the time series of daily mean regional val-ues of AOD550 for the broader Mediterranean region over the study period (2000–2006) for both collections have been computed and are shown in Fig. 2b1. The C004 AOD550over the study region reveals a decreasing tendency from 2000 to 2006 equal to−17% in relative percentage terms whilst the C005 data give−20%. There is strong covariability of the two AOD time series, with a correlation coefficientR=0.97. Therefore, it appears that the improvement of the MODIS 1When Fig. 2b was reproduced without applying the criterion
of 50% data availability, the slope values as well as the changes in AOD for both C004 and C005 remained essentially identical (differ-ences smaller than 0.03×10⁻⁵). Therefore, the omission of AOD data in Northern Africa due to the applied criterion does not affect the computed tendencies in Fig. 2b.
(a)
(b)
Fig. 2. Seasonal variation of computed six-year (2000–2006) re-gional (both land and ocean) mean values (a), and time series (2000–2006) of computed daily regional (both land and ocean) mean values (b), of AOD at 550 nm (AOD550) for the broader
Mediterranean region based on MODIS-Terra Collection 004 (red line) and Collection 005 (black line) data. In(a)are also given the associated standard deviations and the relative percentage dif-ferences (right y-axis), whereas in(b)are also shown the 20-day moving averages smoothed line (bold line) and the linear regression (solid line) applied to the time series.
algorithm did not affect the derived intra-annual and inter-annual variability of aerosol optical depth over the greater Mediterranean basin. In contrast, it produced a systematic correction as revealed by the almost parallel linear regression lines to C004 and C005 data.
Table 1.Comparison between aerosol optical depth at 550 nm (AOD550) from MODIS-Terra Collection 004 (AODC4) and MODIS-Terra
Collection 005 (AODC5) datasets against corresponding data (AODAER) from 29 AERONET stations located in the broader Mediterranean
basin, over the period March 2000 to February 2006. The differences and the correlation coefficients between MODIS and AERONET AOD values and the correlation coefficients between MODIS Collections 004 and 005 are also given. The yellow and red coloured cells indicate stations for which MODIS AOD values are underestimated or equal, respectively, with respect to those from AERONET. The grey and green cells indicate stations for which the correlation coefficients between MODIS and AERONET AOD data are smaller than 0.7 and 0.6, respectively.
Station AODC4 AODC5 AODAER RC4−AER RC5−AER RC4−C5
1 Nes Ziona 0.41±0.23 0.29±0.22 0.25±0.16 0.60 0.74 0.89 2 Cairo Univ. 0.43±0.19 0.36±0.20 0.36±0.19 0.57 0.60 0.90 3 Forth-Crete 0.30±0.18 0.24±0.15 0.20±0.11 0.68 0.80 0.91 4 Bucarest 0.28±0.18 0.25±0.18 0.33±0.19 0.87 0.92 0.92 5 Moldova 0.23±0.16 0.21±0.18 0.24±0.16 0.76 0.84 0.91 6 ETNA 0.30±0.21 0.25±0.19 0.19±0.16 0.94 0.83 0.80 7 Messina 0.26±0.18 0.22±0.17 0.24±0.13 0.46 0.51 0.95 8 Lecce Univ. 0.26±0.19 0.22±0.18 0.22±0.18 0.73 0.77 0.91 9 IMAA Potenza 0.23±0.16 0.19±0.14 0.13±0.08 0.40 0.41 0.92 10 Rome Tor Vergata 0.29±0.19 0.24±0.18 0.20±0.12 0.73 0.80 0.94 11 IMS Oristano 0.29±0.19 0.22±0.18 0.23±0.16 0.75 0.85 0.92 12 Modena 0.30±0.18 0.26±0.18 0.38±0.22 0.50 0.61 0.88 13 Venice 0.40±0.22 0.33±0.24 0.28±0.20 0.66 0.76 0.91 14 ISPRA 0.36±0.25 0.35±0.27 0.31±0.28 0.64 0.72 0.93 15 Ville Franche 0.22±0.16 0.21±0.15 0.27±0.17 0.67 0.64 0.94 16 Toulon 0.21±0.16 0.16±0.15 0.18±0.11 0.71 0.77 0.95 17 Marseille 0.23±0.16 0.17±0.15 0.25±0.15 0.92 0.83 0.87 18 Realtor 0.23±0.16 0.17±0.15 0.24±0.17 0.93 0.95 0.92 19 Vinon 0.23±0.16 0.17±0.15 0.22±0.15 0.83 0.85 0.92 20 Avignon 0.29±0.18 0.21±0.15 0.22±0.14 0.71 0.80 0.91 21 TOULOUSE 0.31±0.19 0.20±0.15 0.18±0.11 0.61 0.91 0.89 22 Toulouse 0.31±0.19 0.20±0.15 0.23±0.15 0.65 0.82 0.89 23 Barcelona 0.25±0.18 0.22±0.17 0.23±0.14 0.74 0.80 0.95 24 Cabo de Boca 0.23±0.17 0.18±0.13 0.16±0.11 0.69 0.79 0.85 25 El Arenosillo 0.27±0.16 0.16±0.14 0.16±0.13 0.60 0.73 0.87 26 Granada 0.34±0.19 0.27±0.16 0.17±0.12 0.69 0.75 0.89 27 Blida 0.29±0.22 0.24±0.23 0.24±0.19 0.84 0.85 0.94 28 Thala 0.32±0.21 0.24±0.18 0.28±0.19 0.83 0.91 0.90 29 Lampedusa 0.25±0.24 0.24±0.22 0.21±0.16 0.87 0.90 0.99
absolute differences and correlation coefficients (RC4−AER, andRC5−AER), whereas correlations between data from the two MODIS collections are also computed (RC4−C5, Ta-ble 1). In general, there is good agreement between both C004 and C005 and AERONET AODs, since the differences (ranging from −0.08 to 0.17 for C004 and from −0.12 to 0.10 for C005) fall within the range of standard deviations of both MODIS and AERONET, ranging from 0.16 to 0.25 for C004, from 0.13 to 0.27 for C005, and from 0.08 to 0.28 for AERONET, and that MODIS is representative of geograph-ical cells of dimensions 100×100 km2, whereas AERONET is for a specific site.
Nevertheless, better agreement with AERONET is achieved with the new MODIS algorithm V5.2, as shown by the improved statistics (slope closer to unity, higher cor-relation coefficient and smaller standard deviation, Fig. 3) for C005 compared to C004 datasets. Note also that locally
the percentage differences with respect to AERONET AODs reach 100% for C004 against only 59% for C005 (Table 1).
(a)
(b) (c)
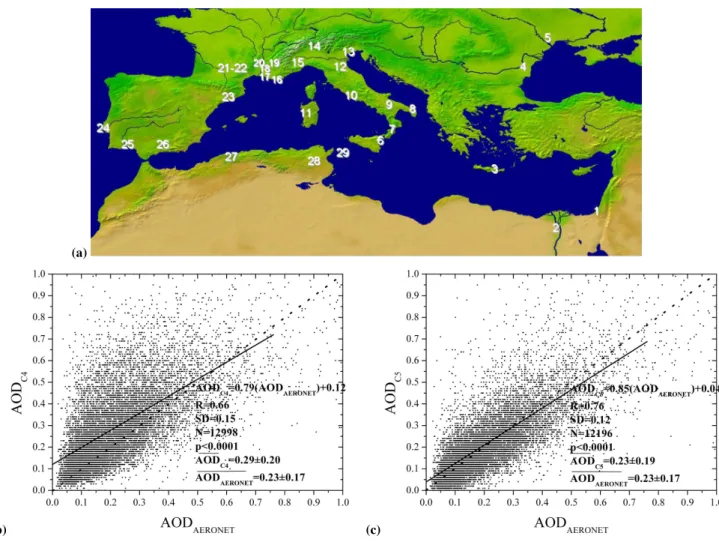
Fig. 3. (a)The study region and the location of the 29 selected AERONET stations for inter-comparison of ground-based AOD with MODIS data. (b)Scatterplot comparison between daily MODIS-Terra Collection 004 AOD data* against those from 29 AERONET stations. (c)
As in(b)but for MODIS-Terra Collection 005. The correlation coefficient (R) and the standard deviation (SD) of differences between MODIS and AERONET AOD data, the total number of matched data pairs (N), the mean AOD values for MODIS (AODC4and AODC5)
and AERONET (AODAERONET), and the equations for the applied linear regressions between MODIS and AERONET are also given.
∗Note that very few AOD values larger than 1.0 accounted for in the statistics were omitted from the scatterplot diagram.
smaller than 0.7 (grey-coloured cells). The MODIS C005 AOD data provide drastic improvement in terms of compar-ison against AERONET since at only two stations correla-tion coefficients are smaller than 0.6 (against 4 stacorrela-tions for MODIS C004) and at 5 stations smaller than 0.7 (against 14 stations for C004). In addition at 14 stations AOD550from C005 is underestimated and at 12 stations is overestimated.
The improvement of MODIS AOD data from C004 to C005 is clearly shown in Fig. 3b and c, where both sets are compared to AOD data from the 29 AERONET stations, al-together yielding a total of more than 12 000 matched data pairs. The statistics are drastically improved, with the corre-lation coefficient between MODIS and AERONET increas-ing from 0.66 for C004 to 0.76 for C005, i.e. by 17%. The scatter of the points is also reduced substantially, with a de-creased standard deviation of differences from 0.15 to 0.12,
mean AODs and associated standard deviations for the two MODIS Collections and AERONET are given in Fig. 3b and c. There is a significant improvement with the mean C005 AOD550(0.23±0.19) matching amazingly well that of AERONET (0.23±0.17) opposite to the significantly overes-timated mean C004 AOD550(0.29±0.20).
Using Level-3 MODIS AOD data averaged over 1◦×1◦, (100×100 km) grid areas for comparisons against AERONET data can affect the statistics and the results due to the large spatial and temporal variability of aerosols that might be not adequately represented by Level-3 data. In-stead, Level-2 data with a resolution of 10 km at nadir should be more adequate for such comparisons. To assess the ef-fect of using Level-3 instead of Level-2 MODIS AOD data, we made use of Level-2 MODIS AOD data for compari-son against seven (7) important AERONET sites over the study region (Mediterranean basin). The sites were appro-priately selected in order to be representative for the differ-ent aerosol types observed over the Mediterranean basin (e.g. urban, desert, maritime) also ensuring a homogeneous and complete spatial coverage. The selected AERONET stations are: Nes Ziona, FORTH, Bucarest, Etna, Ispra, Ville Franche and Blida. In our analysis, we applied the spatio-temporal window technique described by Ichoku et al. (2002). We finally used 50×50 km window sizes (Ichoku et al., 2002). For each day of our study period, and for each one sta-tion, we performed the comparisons using the derived Level-2 AOD data. The results show that the correlation coeffi-cients (R) between MODIS and AERONET did not change drastically using Level-2 instead of Level-3 data. Specifi-cally, the differences in R values did not exceed 0.02 (only for the single case of the Nes Ziona station Level-2 provided a larger increase ofRequal to 0.18). It is important that no systematic behavior was found for the examined stations in terms of performance of Level-2 and Level-3 MODIS data against AERONET, i.e. for some (3) stations a better com-parison was found using the Level-2 than Level-3 AOD data, against a worse comparison for some (3) other stations. In addition, the computed correlation coefficients between the Level-2 and Level-3 AOD data are quite high, with values ranging from 0.84 to 0.99. Finally, the differences,1(AOD), between MODIS and AERONET are similar using either Level-2 or Level-3 data. Thus, the 1(AOD) values range from −0.09 to 0.07 for Level-3 data, and from −0.09 to 0.12 for Level-2. The relative percentage differences, with respect to AERONET AOD values, between using Level-2 and Level-3 AODs are smaller than 5%. Therefore, it ap-pears that the results remain unaffected using either Level-2 or Level-3 MODIS AOD data. The improved performance of MODIS Collection 005 with respect to Collection 004 in terms of comparison against AERONET, as well as the gen-eral decrease of AOD values over the study region (with de-creasing values over land and slightly inde-creasing values over ocean) is valid whether using Level-2 or Level-3 data.
Figure 4a presents the overall AOD comparison between the two MODIS collections. There is a very large number of matched data pairs (more than one million), resulting from the 2191 daily values for each one of the 900 geographical cells of the study region, enabling thus good statistics. The correlation coefficient between C004 and C005 equals 0.92 and the standard deviation of the differences between the two collections is 0.07, corresponding to 26% and 32% of the mean C004 and C005 AOD values, respectively. The mean MODIS AOD value has decreased from 0.27±0.21 (C004) to 0.22±0.18 (C005), i.e. by 18.5%. The equation of the linear regression line between the C004 and C005 AOD data over the Mediterranean basin is
AODC5 =0.86(AODC4)+0.003 (4) This equation indicates that the MODIS C004 data has been corrected by a factor of 0.86. The small offset of 0.003 re-veals that in most cases, the MODIS C005 values are smaller than those of C004. The derived equation is useful for easily adjusting/correcting existing/published AOD values based on the previous Collection 004, over the greater Mediter-ranean basin. Nevertheless, care must be taken since the re-sults of Fig. 4a and the relevant equation refer to the total number of pixels in the study region. A considerable number of them, however, is labeled by MODIS as “land and ocean” indicating that they include both land and ocean surfaces in their spatial limits. Given that aerosol properties exhibit sig-nificant differences above continental and maritime regions, attention should be paid interpretating the results of Fig. 4a. Therefore, the analysis was repeated separately for land and ocean.
Figure 4b and c shows the comparison between C004 and C005 AOD data separately over land and ocean surfaces, re-spectively. It is clear that the correction is much more impor-tant over land than over ocean. The correlation coefficient over land equals only 0.88 against a high coefficient of 0.99 over ocean. Moreover, the scatter of points is much larger over land (standard deviation, SD, of differences equals 0.08) than ocean (SD=0.03). Note that the mean MODIS AOD550 derived with the new algorithm has increased over ocean from 0.21 to 0.22 (i.e. by 4.8%), while it has decreased sig-nificantly (i.e. from 0.31 to 0.23 or by 25.8%) over land. Our results are in line with Levy et al. (2007b) who reported a decrease in AOD550 from 0.28 to 0.21 (i.e. by 25%) for a set of about 6300 globally distributed granules of both MODIS Terra and Aqua. The larger correction of AOD over land than ocean is also indicated by the slope of the applied linear regression lines to MODIS C004 versus C005 AOD data, which is much smaller over land (equal to only 0.8) than ocean (as high as 0.99).
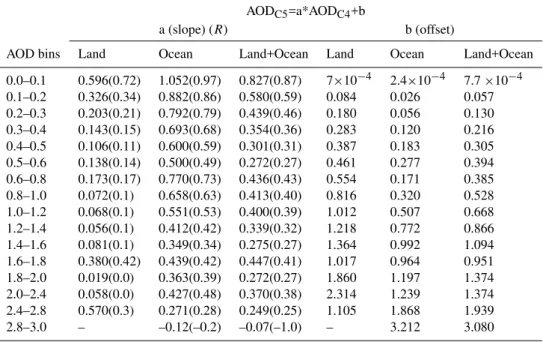
Table 2. Slope (a-values) and offset (b-values) of applied linear regression fit lines to the MODIS-Terra Collection 005 (AODC5) versus
MODIS-Terra Collection 004 (AODC4) AOD data over the broader Mediterranean basin. The slope and offset values are separately given
over land, over ocean and over land and ocean. The computed correlation coefficients (R) between AODC5and AODC4AODs are also given
in parentheses together with the slope values.
AODC5=a*AODC4+b
a (slope) (R) b (offset)
AOD bins Land Ocean Land+Ocean Land Ocean Land+Ocean
0.0–0.1 0.596(0.72) 1.052(0.97) 0.827(0.87) 7×10⁻⁴ 2.4×10⁻⁴ 7.7×10⁻⁴ 0.1–0.2 0.326(0.34) 0.882(0.86) 0.580(0.59) 0.084 0.026 0.057 0.2–0.3 0.203(0.21) 0.792(0.79) 0.439(0.46) 0.180 0.056 0.130 0.3–0.4 0.143(0.15) 0.693(0.68) 0.354(0.36) 0.283 0.120 0.216 0.4–0.5 0.106(0.11) 0.600(0.59) 0.301(0.31) 0.387 0.183 0.305 0.5–0.6 0.138(0.14) 0.500(0.49) 0.272(0.27) 0.461 0.277 0.394 0.6–0.8 0.173(0.17) 0.770(0.73) 0.436(0.43) 0.554 0.171 0.385 0.8–1.0 0.072(0.1) 0.658(0.63) 0.413(0.40) 0.816 0.320 0.528 1.0–1.2 0.068(0.1) 0.551(0.53) 0.400(0.39) 1.012 0.507 0.668 1.2–1.4 0.056(0.1) 0.412(0.42) 0.339(0.32) 1.218 0.772 0.866 1.4–1.6 0.081(0.1) 0.349(0.34) 0.275(0.27) 1.364 0.992 1.094 1.6–1.8 0.380(0.42) 0.439(0.42) 0.447(0.41) 1.017 0.964 0.951 1.8–2.0 0.019(0.0) 0.363(0.39) 0.272(0.27) 1.860 1.197 1.374 2.0–2.4 0.058(0.0) 0.427(0.48) 0.370(0.38) 2.314 1.239 1.374 2.4–2.8 0.570(0.3) 0.271(0.28) 0.249(0.25) 1.105 1.868 1.939 2.8–3.0 – –0.12(–0.2) –0.07(–1.0) – 3.212 3.080
where the slope (a) and offset (b) of the applied linear re-gression lines to the AODC5 versus AODC4 AOD data are given separately over land, over ocean, and for all areas (land and ocean) together with the computed correlation coeffi-cients between AODC5 and AODC4 AOD values. Note the better agreement between the two MODIS collections over ocean than over land, as indicated by larger slopes and cor-relation coefficients and smaller offsets. Correction formulas for MODIS C004 AOD values such as those shown in Ta-ble 2 are necessary given the identified proTa-blems encountered when comparing MODIS against ground-based AERONET data (Fig. 3b).
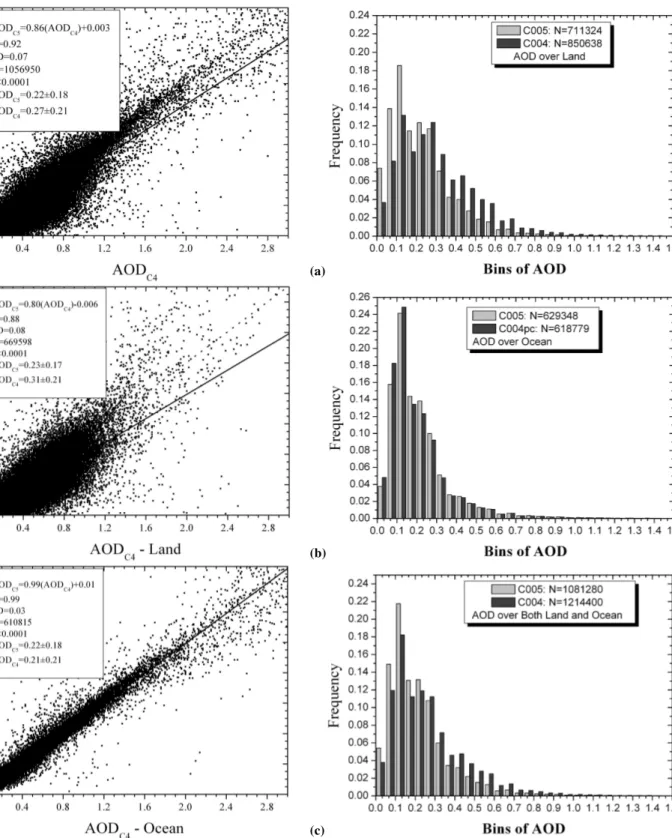
Apart from changes in regional mean AOD values from Collection 004 to Collection 005, changes in the distribu-tion (histogram) of AODs are also of interest. Figure 5 dis-plays the histograms of retrieved AOD550 from both C004 and C005 either for land (Fig. 5a) and ocean (Fig. 5b) areas separately or for the entire study region (Fig. 5c). In all cases, the distribution is unimodal and peaked near 0.12. There is a clear difference between land (Fig. 5a) and ocean (Fig. 5b) concerning AOD changes from C004 to C005. First, the dif-ferences between the two collections are small over ocean while they are much larger over land. Secondly, while the AOD is slightly increased from C004 to C005 over ocean for AOD>0.15, it is mainly decreased over land for AOD>0.20. For smaller AODs the opposite is valid over both land and ocean. A similar behaviour has been reported by Levy et al. (2007b) for a set of 6300 MODIS Terra and Aqua granules
over land. Nevertheless, there are some differences between the two studies. Levy et al. (2007b) found that AOD is re-duced over land for 0.2<AOD<0.75 while it remains about the same for AOD>0.75. In the present study, the AOD550 over land is found to be systematically reduced from C004 to C005 for AOD550 up to about 1.0. This is also projected in the results concerning the entire study region (Fig. 5c).
4 Conclusions
(a)
(b)
(c)
Fig. 4. Scatterplot comparison between daily MODIS-Terra Col-lection 004 and ColCol-lection 005 AOD(a). The comparison is also performed separately over land(b), and ocean(c). The correlation coefficient (R) and the standard deviation (SD) of differences be-tween C004 and C005 AOD data, the total number of matched data pairs (N), the mean AOD values for MODIS C004 (AODC4) and
MODIS C005 (AODC5), and the equations for the applied linear
regressions between MODIS C004 and C005 are also given.
(a)
(b)
(c)
Fig. 5.Histogram* of daily MODIS-Terra Collection 005 (in light grey) compared to Collection 004 (deep grey) AOD550 data over land(a), over ocean(b)and over land and ocean(c)for the broader Mediterranean basin. The value of each bin refers to the minimum value of the bin (the maximum value is the value of the next bin).
(by 4.8%). Specifically, this is found for AOD>0.2 over land and AOD>0.15 over ocean areas in the Mediterranean basin. In contrast, for clean aerosol conditions there is an increase of AOD over land (for AOD<0.2) and a decrease over sea surfaces (for AOD<0.15). This resulted in a much better agreement of C005 than C004 AODs with AERONET data. Thus, the mean AOD values are equal to 0.23±0.19 for C005 and 0.23±0.17 for AERONET, against 0.29±0.20 for C004. The small differences between MODIS C005 and AERONET AODs can be partly explained by the small uncertainty introduced by the diurnal variability of aerosol optical depth that is not completely represented by daily means. The statistics obtained from a large test set (more than 12 000 matched data pairs) were greatly improved for C005 compared to C004 with regards to their regression with AERONET data, whether using Level-2 (10 km by 10 km) or Level-3 (100 km by 100 km) MODIS AOD data. Thus, the correlation coefficient increased from 0.66 to 0.76, and the slope of the linear regression fit from 0.79 to 0.85 whereas the offset decreased from 0.12 to 0.04 and the scatter of compared data pairs from 0.15 to 0.12. The differences be-tween the MODIS C005 and AERONET AODs lie within the range of uncertainties of the two datasets. Moreover, it is important that no changes in the inter-annual variation be-tween C004 and C005 AODs was found but rather a system-atic correction in AODs, i.e. almost constant with time. In addition, despite the decrease in AOD values, the seasonal variation of AOD remains essentially unaffected, though the correction is larger in the drier (March to October) than in the wetter period of the year, i.e. when the region is influ-enced by dust aerosols transported basically from the North African deserts. The results indicate that the improvement of MODIS C005 AOD data is probably due to the improved estimation of the surface visible reflectance that is calculated in the new algorithm using a parameterized reflection rela-tionship and updated aerosol models. Quick first-order cor-rection equations for size-resolved MODIS AODs based on the previous Collection 004, within the study region, have been derived from the analysis. The C005 AOD data can be more reliably used in various applications and studies for the Mediterranean basin, including those for investigating ten-dencies in aerosol loads.
Acknowledgements. Christos Papadimas acknowledges support
by the PENED 03ED373 grant co-financed by EU – European Social Fund (75%) and the Greek Ministry of Development – GSRT (25%). The authors also acknowledge support by the European Union IP-036961, CIRCE and thank NASA-US for making available the Collection 004 and Collection 005 Level-3 MODIS data and the AERosol RObotic NETwork (AERONET) for providing the AOD data.
Edited by: A. Nenes
References
Barnaba, F. and Gobbi, G. P.: Aerosol seasonal variability over the Mediterranean region and relative impact of maritime, continen-tal and Saharan dust particles over the basin from MODIS data in the year 2001, Atmos. Chem. Phys., 4, 2367-2391, 2004, http://www.atmos-chem-phys.net/4/2367/2004/.
Charlson, R. J., Schwartz, S. E., Hales, J. M., Cess, R. D., Coakley Jr., J. A., Hansen, J. E. and Hofmann, D. J.: Climate forcing by anthropogenic aerosols, Science, 255(5043), 423-430, 1992. Chin, M., Chu, A., Levy, R., Remer, L., Kaufman, Y., Holben,
B., Eck, T., Ginoux, P., and Gao, Q.: Aerosol distribution in the Northern Hemisphere during ACE-Asia: results from global model, satellite observations, and sun photometer measurements, J. Geophys. Res., 109(D23S90), 1-15, 2004.
Chu, D. A., Kaufman, Y. J., Ichoku, C., Remer, L. A., Tanre, D., and Holben, B. N.: Validation of MODIS aerosol opti-cal depth retrieval over land, Geophys. Res. Lett., 29, 8007, doi:10.1029/2001GL013205, 2002.
Dubovik, O. and King, M. D.: A flexible inversion algorithm for retrieval of aerosol optical properties from Sun and sky radiance measurements, J. Geophys. Res., 105, 20 67320 696, 2000. Dubovik, O., Smirnov, A., Holben, B. N., King, M. D.,
Kauf-man, Y. J., Eck, T. F., and Slutker, I.: Accurancy assessments of aerosol optical properties retrieved from Aerosol Robotic Net-work (AERONET) Sun and sky radiance measurements, J. Geo-phys. Res., 105, 9791-9806, 2000.
Dubovik, O., Holben, B. N., Eck, T. F., Smirnov, A., Kaufman, Y. J., King, M. D., Tanr´e, D., and Slutsker, I.: Variability of ab-sorption and optical properties of key aerosol types observed in worldwide locations, J. Atmos. Sci., 59, 590-608, 2002. Evans, K. F., and Stephens, G. L.: A new polarized atmospheric
radiative transfer model, J. Quant. Spectrosc. Ra., 46(5), 413– 423, 1991.
Holben, B. N., Eck, T. F., Slutsker, J., et al.: AERONET - A feder-ated instrument network and data archive for aerosol characteri-zation, Remote Sens. Environ., 66, 1-16, 1998.
Holben, B. N., Tanr´e, D., Smirnov, A., Eck, T. F., Slutsker, I., Abuhassan, N., Newcomb, W. W., Schafer, J., Chatenet, B., Lav-enue, F., Kaufman, Y. J., Vande Castle, J., Setzer, A., Markham, B., Clark, D., Frouin, R., Halthore, R., Karnieli, A., ONeill, N. T., Pietras, C., Pinker, R. T., Voss, K., and G. Zibordi: An emerg-ing ground-based aerosol climatology: Aerosol Optical 30 Depth from AERONET, J. Geophys. Res., 106, 12 067-12 097, 2001. Ichoku, C., Chu, D. A., Mattoo, S., Kaufman, Y. J.,
Re-mer, L. A., Tanr´e, D., Slutsker, I., and Holben, B. N.: A spatio-temporal approach for global validation and analysis of MODIS aerosolproducts, Geophys. Res. Lett., 29(12), 8006, doi:10.1029/2001GL013206, 2002.
Ichoku, C., Remer, L. A., and Eck, T. F.: Quantitative evaluation and intercomparison of morning and afternoon Moderate Res-olution Imaging Spectroradiometer (MODIS) aerosol measure-ments from Terra and Aqua, J. Geophys. Res., 110(D10), 1-23, 2005.
Intergovernmental Panel on Climate Change (IPCC): Climate Change 2007, Working Group I Report: “The physical science basis”, Summary for Policymakers, Paris, February 2007. Jethva, H., Satheesh, S. K., and Srinivasan, J.: Evaluation of
J. Geophys. Res., 112, D14216, doi:10.1029/2006JD007929, 2007.
Kaskaoutis, D. G., Kosmopoulos, P., Kambezidis, H. D., and Nas-tos, P. T.: Aerosol climatology and discrimination of different types over Athens, Greece, based on MODIS data, Atmos. Envi-ron., 41, 7315-7329, 2007.
Kaufman, Y. J., Tanr´e, D., Remer, L. A., Vermote, E. F., Chu, A, and Holben, B. N.:, Operational remote sensing of tropospheric aerosol over land from EOS Moderate-resolution Imaging 15 Spectroradiometer, J. Geophys. Res., 102, 17 051-17 065, 1997. Kaufman, Y. J., Karnieli, A., and Tanr´e, D.: Detection of dust
over deserts using satellite data in the solar wavelengths, IEEE T. Geosci. Remote, 38(1), 525-531, 2000.
Kaufman, Y. J., Tanr´e, D., and Boucher, O.: A satellite view of aerosols in the climate system, Nature, 419, 6903, doi:10.1038/nature01091, 2002.
Kazadzis, S., Bais, A., Amiridis, V., Balis, D., Meleti, C., Kouremeti, N., Zerefos, C. S., Rapsomanikis, S., Petrakakis, M., Kelesis, A., Tzoumaka, P., and Kelektsoglou, K.: Nine years of UV aerosol optical depth measurements at Thessaloniki, Greece, Atmos. Chem. Phys., 7, 2091-2101, 2007,
http://www.atmos-chem-phys.net/7/2091/2007/.
Kishcha, P., Starobinets, B., and Alpert, P.: Latitudinal varia-tions of cloud and aerosol optical thickness trends based on MODIS satellite data, Geophys. Res. Lett., 34(5), L05810, doi:10.1029/2006GL028796, 2007.
Koukouli, M. E., Balis, D. S., Amiridis, V., Kazadzis, S., Bais, A., Nickovic, S., and Torres, O.: Aerosol variability over Thessa-loniki using ground based remote sensing observations and the TOMS aerosol index, Atmos. Environ., 40, 5367-5378, 2006. Lelieveld, J., Berresheim, H., Borrmann, S., Crutzen, P. J.,
Den-tener, F. J., Fischer, H., Feichter, J., Flatau, P. J., Heland, J., Holzinger, R., Korrmann, R., Lawrence, M. G., Levin, Z., Markowicz, K. M., Mihalopoulos, N., Minikin, A., Ramanathan, V., de Reus, M., Roelofs, G.J., Scheeren, H. A., Sciare, J., Schlager, H., Schultz, M., Siegmund, P., Steil, B., Stephanou, E. G., Stier, P., Traub, M., Warneke, C., Williams, J., and Ziereis, H.: Global air pollution crossroads over the Mediterranean, Sci-ence, 298, 794-799, 2002.
Levin, Z., A. Teller, E. Ganor, and Yin, Y.: On the interactions of mineral dust, sea-salt parti- 5 cles, and clouds: A mea-surement and modeling study from the Mediterranean Israeli Dust Experiment campaign, J. Geophys. Res., 110, D20202, doi:10.1029/2005JD005810, 2005.
Levy, R. C., Remer, L. A., Tanr´e, D., Kaufman, Y. J., Ichoku, C., Holben, B. N., Livingston, J. M., Russell, P. B., and Maring, H.: Evaluation of the Moderate-Resolution Imaging Spectroradiometer (MODIS) retrievals of dust aerosol over the ocean during PRIDE, J. Geophys. 10 Res., 108(D19), 8594, doi:10.1029/2002JD002460, 2003.
Levy, R. C., Remer, L. A., Martins, J. V., Kaufman, Y. J., Plana-Fattori, A., Redemann, J., and Wenny, B.: Evaluation of the MODIS aerosol retrievals over ocean and land during CLAMS, J. Atmos. Sci., 62(4), 974-992, 2005.
Levy, R. C., Remer, L. A., and Dubovik, O.: Global aerosol optical properties and application 15 to Moderate Resolution Imaging Spectroradiometer aerosol retrieval over land, J. Geophys. Res., 112, D13210, doi:10.1029/2006JD007815, 2007a.
Levy, R. C., Remer, L. A., Mattoo, S., Vermote, E. F., and Kaufman,
Y. J.: Second-generation operational algorithm: Retrieval of aerosol properties over land from inversion of moderate resolu-tion imaging spectroradiometer spectral reflectance, J. Geophys. Res., 112, D13211, 20 doi:10.1029/2006JD007811, 2007b. Massie, S. T., Torres, O., and Smith, S. J.: Total Ozone Mapping
Spectrometer (TOMS) observations of increases in Asian aerosol in winter from 1979 to 2000, J. Geophys. Res., 109, 1-14, 2004. Meloni, D., di Sarra, A., Pace, G., and Monteleone, F.: Aerosol optical properties at Lampedusa (Central Mediterranean). 2. De-termination of single scattering albedo at two wavelengths for different aerosol types, Atmos. Chem. Phys., 6, 715-727, 2006, http://www.atmos-chem-phys.net/6/715/2006/.
Mishchenko, M. I., Geogdzhayev, I. V., Rossow, W. B., Cairns, B., Carlson, B. E., Lacis, A. A., Liu, L., and Travis, L. D.: Long-term satellite records reveal likely recent aerosol trend, Science, 315, 1543, doi:10.1126/science.1136709, 2007.
Moulin, C., Lambert, C., Dayan, U., Masson, V., Ramonet, M., Bousquet, P., Legrand, M., Balkanski, Y., Guelle, W., Marti-corena, B., Bergametti, G., and Dulac, F.: Satellite climatol-ogy of African dust transport in the Mediterranean atmosphere, J. Geophys. Res., 103, 13 137-13 144, 1998.
Papadimas, C., Hatzianastassiou, N., Mihalopoulos, N., Querol, X., and Vardavas, I. M.: Spatial and temporal variability in aerosol properties over the Mediterranean basin based on 6-year (2000-2006) MODIS data, J. Geophys. Res., 113(D11), D11205, 5 doi:10.1029/2007JD009189, 2008.
Penner, J. E., Dickinson, R. E., and ONeill, C. A.: Effects of aerosol from biomass burning on the global radiation budget, Science, 256(5062), 1432-1434, 1992.
Remer, L. A., Wald, A. E., and Kaufman, Y. J.: Angular and sea-sonal variation of spectral surface reflectance ratios: Implications for the remote sensing of aerosol over land, IEEE T. Geosci. Re-mote, 39(2), 275-283, 2001.
Remer, L. A., Tanr´e, D., Kaufman, Y. J., Ichoku, C., Mattoo, S., Levy, R., Chu, D. A., Holben, B., Dubovik, O., Smirnov, A., Martins, J. V., Li, R.-R., and Ahman, Z.: Validation of MODIS aerosol retrieval over ocean, Geophys. Res. Lett., 29(12), 8008, doi:10.1029/2001/GL013204, 2002.
Remer, L. A., Kaufman, Y. J., Tanr´e, D., Mattoo, S., Chu, D. A., Martins, J. V., Li, R. R., Ichoku, C., Levy, R. C., Kleidman, R. G., Eck, T. F., Vermote, E., and Holben, B. N.: The MODIS aerosol algorithm, products and validation, J. Atmos. Sci., 62(4), 947-973, 2005.
Remer, L., Kaufman, Y., Tanr´e, D., Mattoo, S., Li, R. R, Martins, J. V., Levy, R., Chu, D. A., Kleidman, R., Ichoku, C., and Ko-ren, I.: Collection 005 Change Summary for MODIS Aerosol (04 L2) Algorithms, available at: http://modis-atmos.gsfc.nasa. gov/productsC005update.html, 2006.
Santese, M., De Tomasi, F., and Perrone, M. R.: Moderate Resolution Imaging Spectroradiometer (MODIS) and Aerosol Robotic Network (AERONET) retrievals during dust outbreaks over the Mediterranean, J. Geophys. Res., 112(D18), D18201, doi:10.1029/2007JD008482, 25 2007a.
Santese, M., De Tomasi, F., and Perrone, M. R.: AERONET versus MODIS aerosol parameters at different spatial resolu-tions over southeast Italy, J. Geophys. Res., 112(D10), D10214, doi:10.1029/2006JD007742, 2007b.
dimming/brightening transition, Geophys. Res. Lett., 33, L15806, doi:10.1029/2006GL026471, 2006.
Smirnov, A., Holben, B. N., Eck, T. F., Slutsker, I., Chatenet, B., and Pinker, R. T.: Diurnal variability of aerosol optical depth observed at AERONET (Aerosol Robotic Network) sites, Geo-phys. Res. Lett., 29, 2115, doi:10.1029/2002GL016305, 2002. Tanr´e, D., Kaufman, Y. J., Herman, M., and Mattoo, S.: Remote
sensing of aerosol properties over oceans using the MODIS/EOS spectral radiances, J. Geophys. Res., 102, 16 971-16 988, 1997. Tripathi, S. N., S. Dey, Chandel, A., Srivastava, S., Singh, R. P., and
Holben, B. N.: Comparison of MODIS and AERONET derived aerosol optical depth over the Ganga Basin, India, Ann. Geo-phys., 23, 1093-1101, 2005,
http://www.ann-geophys.net/23/1093/2005/.
Vardavas, I. M. and Taylor, F. W.: Radiation and Climate, Interna-tional Series of Monographs on Physics, 138, Oxford University Press, Oxford, UK, 2007.
Vermote E. F., El Saleous, N. Z., and Justice, C. O.: Atmospheric correction of MODIS data in the visible to middle infrared: first results, Rem. Sens. Environ., 83, 97111, 2002.
Wiscombe, W. J.: Improved Mie scattering algorithms, Appl. Op-tics, 19, 1505–1509, 1981.