www.hydrol-earth-syst-sci.net/20/3149/2016/ doi:10.5194/hess-20-3149-2016
© Author(s) 2016. CC Attribution 3.0 License.
Fresh groundwater resources in a large sand replenishment
Sebastian Huizer1,2, Gualbert H. P. Oude Essink1,2, and Marc F. P. Bierkens1,2
1Department of Physical Geography, Utrecht University, Utrecht, the Netherlands 2Unit Subsurface and Groundwater Systems, Deltares, Utrecht, the Netherlands
Correspondence to:Sebastian Huizer ([email protected], [email protected])
Received: 6 January 2016 – Published in Hydrol. Earth Syst. Sci. Discuss.: 19 January 2016 Revised: 26 June 2016 – Accepted: 4 July 2016 – Published: 4 August 2016
Abstract.The anticipation of sea-level rise and increases in extreme weather conditions has led to the initiation of an in-novative coastal management project called the Sand Engine. In this pilot project a large volume of sand (21.5 million m3) – also called sand replenishment or nourishment – was placed on the Dutch coast. The intention is that the sand is redistributed by wind, current, and tide, reinforcing local coastal defence structures and leading to a unique, dynamic environment. In this study we investigated the potential ef-fect of the long-term morphological evolution of the large sand replenishment and climate change on fresh groundwa-ter resources. The potential effects on the local groundwagroundwa-ter system were quantified with a calibrated three-dimensional (3-D) groundwater model, in which both variable-density groundwater flow and salt transport were simulated. Model simulations showed that the long-term morphological evo-lution of the Sand Engine results in a substantial growth of fresh groundwater resources, in all adopted climate change scenarios. Thus, the application of a local sand replenish-ment could provide coastal areas the opportunity to combine coastal protection with an increase of the local fresh ground-water availability.
1 Introduction
Global sea-level rise poses a risk for coastal areas, especially when combined with an increase in the frequency and in-tensity of storm surges (Michael et al., 2013; Nicholls et al., 2010; Wong et al., 2014). Particularly small islands (Chui and Terry, 2013; Holding and Allen, 2015; Mahmoodzadeh et al., 2014) and low-lying deltas (Giosan et al., 2014; Mc-Granahan et al., 2007; Oude Essink et al., 2010) are vulner-able to rising sea-levels. Many low-lying deltas, such as the
Mekong Delta (Vietnam) and the Ganges–Brahmaputra delta (Bangladesh), are already frequently subjected to extensive floods, leading to considerable economic losses, property damage, and in severe cases loss of life (Few and Matthies, 2006; de Sherbinin et al., 2011; UNDP, 2004). In addition, many ecosystems and inhabitants of deltas are threatened as a result of high subsidence rates, over-exploitation of fresh groundwater resources, and contamination of coastal aquifers (Crain et al., 2009; de Sherbinin et al., 2011; Syvit-ski et al., 2009; UNDP, 2004). Sea-level rise and storm surges will enhance the pressure on these coastal regions (Kooi et al., 2000; Yang et al., 2013, 2015), and will likely exacerbate the loss of agricultural land, damage of ecosystems and the salinization of fresh groundwater resources (Hoggart et al., 2014; Nicholls, 2010; Oude Essink et al., 2010; Wong et al., 2014).
1.1 Coastal management
Legend
Model domain Sand Engine
0 5 10 20 30
km
North Sea
The Hague Sand Engine
Delft
Rotterdam
2011
2012
2013
2014
0 0.5 1 2 3
km
Naaldwijk
NL
B D
´
Contour line of MSL
Contour line of MSL
Contour line of MSL
Contour line of MSL
Figure 1.Situation of the Sand Engine and morphological development in 2011–2014.
(e.g. sand replenishment or nourishment; van Koningsveld et al., 2008). Since 1990 the application of sand nourishments, particularly beach and shoreface nourishments, has become the dominant coastal defence strategy. Sand nourishments are applied on an annual basis – where necessary – to maintain the position of the coastline (Keijsers et al., 2015; de Ruig and Hillen, 1997).
1.2 Pilot project: Sand Engine
Since 2001, the position of the entire Dutch coastline has been successfully maintained with 12 million m3 of sand nourishments per year. However, the future annual volume of sand nourishments should increase if the coast is to rise with the sea-level (Deltacommissie, 2008). Research sug-gests that the annual nourishment volume should be raised to 20 million m3yr−1in the nearby future; in order to sustain the Dutch coastline in the long run (Giardino et al., 2011; de Ronde, 2008). The anticipation of a substantial growth in the annual nourishment volume incited discussions about the effectiveness of the current large-scale distribution of sand. These discussions led to the idea that concentrated (mega) nourishments could be more cost-effective than current prac-tices, and may provide opportunities for natural dune growth, and recreation (van Slobbe et al., 2013).
The effectiveness, benefits and drawbacks of concentrated (mega) nourishments are currently being investigated with a pilot project named the Sand Engine (also called Sand Motor) (Mulder and Tonnon, 2011; Stive et al., 2013). In this project a mega-nourishment of 21.5 million m3was con-structed at the Dutch coast in 2011: a few kilometres west from the city of The Hague (Fig. 1). The replenished sand will gradually be distributed along the coast by wind, waves and currents, thus incorporating natural forces in
engineer-ing methods (so called “Buildengineer-ing with Nature”) (Slobbe et al., 2013; de Vriend et al., 2014). The effectiveness of the Sand Engine is investigated by extensive research and inten-sive monitoring: the surface elevation (including bathymetry) is measured frequently to gain detailed knowledge of the volume and direction of sediment transport at this local mega-nourishment (Ebbens and Fiselier, 2010; Tonnon et al., 2011). Recent measurements show that the outer perimeter of the “hook-shaped” peninsula retreated, and the alongshore extent increased (de Schipper et al., 2016; Stive et al., 2013). Initially the Sand Engine extended approximately 1 km into the sea and was nearly 2 km wide at the shoreline, while in September 2014 it extended approximately 800 m into the sea and was more than 3 km wide at the shoreline (Fig. 1).
1.3 Study objectives
The primary objective of this study is to quantify the poten-tial effect of the Sand Engine on the regional groundwater system, particularly on fresh groundwater. During the lifes-pan of the Sand Engine, the (direct) influence of the North Sea is diminished, because of the seaward displacement of the shoreline – and possibly growth of adjacent dunes. The extension of the beach–dune system and the reduction in sea-water intrusion may lead to a growth of fresh groundsea-water resources. In combination with an increase of groundwater levels, the construction of the Sand Engine may also lead to a decline in the upwelling of saline groundwater and a de-creased salt load in adjacent low-lying areas.
simulta-neously gives rise to dynamic changes in seawater intrusion and submarine groundwater discharge. The morphological evolution of the Sand Engine and the dynamic nature of this coastal system will probably lead to considerable changes in groundwater head and divide, the direction and velocity of groundwater flow, and the stored volume of fresh groundwa-ter.
One of the innovative aspects of this study is to incor-porate detailed predictions of the long-term morphological evolution of the Sand Engine in a 3-D numerical model, which simulates variable-density groundwater flow. At the moment no studies have investigated the influence of local mega-nourishments on groundwater systems, and only a few groundwater modelling studies have incorporated a changing morphology in their calculations (Delsman et al., 2014). We also assess the effect of climate change (e.g. sea-level rise) on fresh groundwater resources in the study area, in combi-nation with the morphological evolution of the Sand Engine. To our knowledge, no other studies have integrated the effect of the morphological evolution of coastal areas and climate change on fresh groundwater resources, and the number of quantitative studies that investigate the possibility to combine coastal defence with the protection of fresh groundwater re-sources are scarce (Oude Essink and Waterman, 2016; Oude Essink, 2001). However, studies on small islands have shown that great losses in the volume of fresh groundwater can oc-cur as a result of decreases in groundwater recharge and sea-level rise, and especially small and thin lenses seem vulnera-ble to salinization (Chui and Terry, 2013; Holding and Allen, 2015; Mahmoodzadeh et al., 2014). In relation to the mor-phological dynamics of coastal regions, studies have shown that the erosion and accretion of sand can lead to substan-tial changes within the beach–foredune area (Bakker et al., 2012; Keijsers et al., 2014), and that climate change might exacerbate coastal erosion (FitzGerald et al., 2008; Zhang et al., 2004). Morphological developments in coastal areas can therefore have a substantial effect on fresh groundwater resources, and coastal management strategies that compen-sate, limit, or counteract coastal erosion, or seawater intru-sion may help to protect fresh groundwater resources.
The paper first describes the construction of the Sand En-gine and the characteristics of the study area. It then reviews the methodology for the development of the regional ground-water model, and the model scenarios. Next, the model cal-ibration and model results are described and examined as well as the impact of different climate scenarios on simulated fresh groundwater resources. Finally, the methodology and results are discussed, emphasizing the limitations and impli-cations for fresh groundwater resources.
!
! !
! ! ! !
! !
! !
!
!
! ! Legend
! Multi-level monitoring wells
? Pumping wells
Transect Infiltration basins
0 250 500 1,000 1,500
m
North Sea
A
Sand Engine B
B'
A' Solleveld
N
Figure 2.Map of the dune area Solleveld with multi-level monitor-ing wells and pumpmonitor-ing wells, includmonitor-ing transects A and B (geolog-ical profiles in Fig. 3).
2 Site description 2.1 Study area
The construction of the Sand Engine was commissioned and designed by the executive branch of the Ministry of Infrastructure and the Environment (Rijkswaterstaat) and the provincial authority of South Holland (Provincie Zuid-Holland) (Mulder and Tonnon, 2011). Large trailing suction hopper dredgers were used to extract sand from several sand pits in the North Sea and to transport this sand to the project site. The dredged material was stored in the hopper and de-posited on the project site with three different techniques: by opening the bottom valves of the vessel on-site (depositing), by pumping a mixture of sand and water to the site through a pipeline (pumping), and by spraying a mixture of sand and water from the vessel’s bow to the site (rainbowing). When the construction of the Sand Engine was completed (in July 2011), the area above mean sea level (a.m.s.l.) was 1.3 km2 with a maximum surface elevation of 7 m a.m.s.l. (Slobbe et al., 2013).
be able to extract these increasing volumes of groundwater without salinization, the drinking water company started with the infiltration of surface water in 1970. The infiltrated vol-ume of surface water is approximately equal to the volvol-ume of fresh groundwater that is extracted from the dunes. Cur-rently, the groundwater is extracted from the phreatic aquifer with almost 300 vertical pumping wells, which are located on the sides of twelve elongated infiltration basins (Fig. 2; Zwamborn and Peters, 2000).
Beyond the dunes the area gradually transforms into ur-ban area and lying agricultural areas (polders). The low-lying polders have surface elevations of −1 to 1 m a.m.s.l., and act predominantly as a groundwater sink, while the ur-ban areas are generally situated in higher areas with surface elevations between 1 and 3 m a.m.s.l. The dominant ground-water flow in the upper aquifers flows from the higher urban areas and coastal dunes toward the North Sea and the polders. The relatively low drainage level in the polders also leads to the attraction of deep saline groundwater, in addition to the drainage of local fresh groundwater.
2.2 Hydrogeology
The subsoil consists of unconsolidated sediment of predom-inantly fluviatile and marine origin, as illustrated by two geological profiles in Fig. 3. The upper part of the subsoil (10 to 30 m) consists of sand, clay, and peat, which were deposited during the Holocene: primarily fine- to medium-grained sand in the higher situated dunes and urban areas, and primarily sand and clay in the low-lying areas. However, the lower section of the Holocene deposits (between−15 and
−20 m a.m.s.l.) consists in both areas mainly of clay and peat deposits. The underlying thick layers of fluviatile and marine sediment were deposited during the Pleistocene. It should be noted that the geological schematization of the aquifers and aquitards beneath−40 m a.m.s.l. are based on a limited num-ber of boreholes.
The conceptual fresh–brackish–saline groundwater distri-bution (blue striped lines; Fig. 3) are based on chloride mea-surements, performed at multi-level monitoring wells. Chlo-ride measurements in Solleveld indicate that the boundary between fresh and brackish groundwater (1 TDS g L−1; to-tal dissolved solids – TDS) is situated between −20 and
−40 m a.m.s.l., and the boundary between brackish and saline groundwater (10 TDS g L−1) is situated between−40
and−60 m a.m.s.l. The depth of the fresh groundwater lens and the extent of seawater intrusion are controlled by head differences.
2.3 Monitoring
In order to timely observe changes in groundwater level, flow and quality an extensive monitoring network was im-plemented in Solleveld. After the construction of the Sand Engine this monitoring system was expanded and
intensi-fied in the western part of the dune area. The aim of the expansion of the monitoring system was to observe long-term changes in groundwater level, flow, and quality and to observe hydrogeological effects caused by the Sand En-gine and previous small-scale nourishments (Buma, 2013). The current monitoring system consists of more than 300 observation wells, where the groundwater level is measured with varying frequency (ranging from wells with hourly fre-quency to wells that are only read off every 3 months). The groundwater salinity is measured twice every year in at least 50 monitoring wells, with various methods: groundwa-ter data loggers with measurement of electrical conductivity, electro-magnetic measurements, and analyses for chloride (Buma, 2013). Apart from measurements within the moni-toring system, groundwater level measurements of 61 addi-tional (onshore) monitoring wells were available in the na-tional database of the Geological Survey of the Netherlands. In addition to the expansion of the monitoring system, ad-ditional measures were taken to prevent salinization of fresh groundwater in the dunes. On the western base of the dunes a line of 28 interceptor (pumping) wells was installed in 2012 to maintain the groundwater level, and prevent any (negative) impact of the Sand Engine and previous nourishments on the extracted fresh groundwater in the dunes. These interceptor wells were not included in our study, because of a lack of in-formation on the pumping rates and the expectation that the effects on the regional scale are small to negligible.
In order to gain specific information on the geohydrologi-cal dynamics within the Sand Engine, eight additional mon-itoring wells were installed with shallow filters (2 to 10 m below surface) and four monitoring wells with deep filters (16 to 20 m below surface). Since May 2014 the ground-water levels in the monitoring wells have been continuously monitored with groundwater data loggers. The salinity of the groundwater is monitored with electro-magnetic measure-ment within all eight monitoring wells.
3 Method
3.1 Variable-density groundwater model
vary-0
-20
-40
-60
-80
-100
-120
2.5 Profile distance [km]
2 0.5 1 1.5 0
Recharge
W E
Infiltration basin
Brackish Fresh
Drainage Seawater
intrusion
0
-20
-40
-60
-80
-100
-120
0
Recharge
W
2.5 2 0.5 1 1.5
Profile distance [km]
E
Drainage Seawater
intrusion
Brackish Fresh
Saline
Transect A Transect B
Well Well Well Well
Saline
Legend Sand, clay, and peat deposits (Holocene)
Marine sand deposits with clay layers (early Pleistocene Maassluis Formation)
Depth [m MSL]
Fluvial and marine sand deposits (Pleistocene) Fluvial clay deposits (early Pleistocene Stramproy Formation) Fluvial clay deposits (early Pleistocene Waalre Formation)
Figure 3.Geological profiles (based on the databases of the Geological Survey of the Netherlands) across the model domain with conceptual fresh–salt water distribution (locations are shown in Fig. 2).
0 1000 2000 3000 4000 5000 6000 7000 8000 9000
Profile distance [m]
0
-20
-40
-60
-80
-100
Sand Engine
Recharge
Polder: rivers and drainage
-140
-160
-120
Depth [m MSL]
Hydrogeologic base
dz: 10 m dz: 5 m dz: 4 m dz: 3 m dz: 2 m
North Sea Wells
Infiltration basin
Phreatic Aquifer 1
dz: 1– 2 m
Aquitard 1
Aquifer 2
Aquitard 2
Aquitard 3 Aquifer 3
Aquifer 4
Aquitard 4
Head-dependent flux boundary Specific-head boundary No flow boundary
Figure 4.Conceptual representation of a slice of the model with layer thicknesses and boundary conditions.
ing layer thickness of 1 to 10 m (smallest thickness in up-per layers, increasing in underlying layers; Fig. 4). The dis-cretization and extent of the model were based on three crite-ria: minimize the effect on simulated groundwater heads and salinities in the study area, limit computation time, and op-timize the calculation of the fresh groundwater volume. For the justification of the temporal and spatial discretization, we have performed a grid convergence test (Appendix A).
The model boundaries, as visualized in Fig. 1, were de-fined either perpendicular to the coastline (the south-west and north-east sides of the model), or parallel to the coast-line (the north-west and south-east side of the model). Model boundaries that were defined perpendicular to the coast-line, lie parallel to the dominant groundwater flow
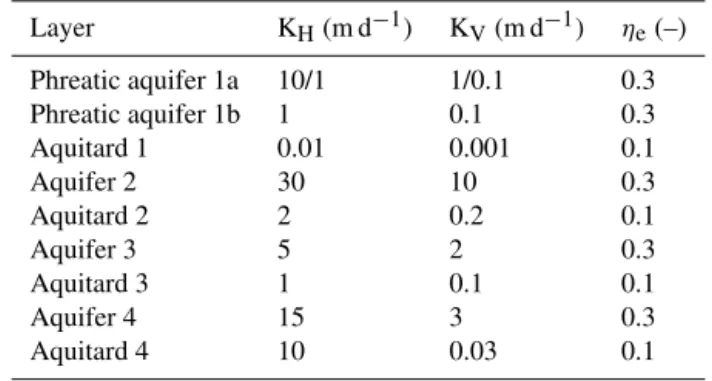
direc-Table 1.Hydrogeologic parameters used in the simulations, where
the upper part of the phreatic aquifer (1a: above−10 m a.m.s.l.) was
subdivided in two hydrogeological zones (1: fine to coarse sand; 2: clay, loam, and fine sand).
Layer KH(m d−1) KV(m d−1) ηe(–)
Phreatic aquifer 1a 10/1 1/0.1 0.3
Phreatic aquifer 1b 1 0.1 0.3
Aquitard 1 0.01 0.001 0.1
Aquifer 2 30 10 0.3
Aquitard 2 2 0.2 0.1
Aquifer 3 5 2 0.3
Aquitard 3 1 0.1 0.1
Aquifer 4 15 3 0.3
Aquitard 4 10 0.03 0.1
tion in the coastal area, and were therefore defined as no-flow boundaries. The other model boundaries were defined as illustrated in Fig. 4: “specified-head” and “head-dependent flux” boundary conditions (taking into account density differ-ences), which represent the North Sea and local groundwa-ter system, respectively. The specified-head boundary condi-tions equalled the average level of the North Sea, and were applied to the seafloor. Local groundwater conditions were defined by a previous model simulation of the south-west of the Netherlands (Oude Essink et al., 2010). The base of the model was defined equal to the hydrogeological base of the model domain, which is approximately−170 m a.m.s.l. and assumed to be a no-flow boundary.
7
6
5
4
3
2
1
1600 2010
Time [years], period 1500–2010
1970 1930 1890 1800
8
Groundwater extraction [million m
3 yr -1]
1740
1500 1700
Extraction by drainage
Landscape evolution coast, from 1500– 2010 (modified after Vos and de Vries, 2013)
0
-5
-10
-15
-20
-25
-35
Sea level [cm MSL]
5
-30
Groundwater Infiltration
1500 1500–1740 1740–2010
< -12 -12 - -10 0 -10 - -8
-8 - -6 -6 - -4 -4 - -3
-3 - -2 -2 - -1 -1 - 0
0 - 1 1 - 2 2 - 3
3 - 4 4 - 6 > 6 m MSL
±
0 1 2 4 6
km
900 m 400 m
Extraction by pumping wells
Figure 5.Simulation of historical coastal erosion (based on palaeogeographic maps of Vos and de Vries, 2013), sea-level rise (black line) and groundwater extraction (blue) in the period 1810–2010; dashed lines indicate estimates, and vertical grey lines refer to stress periods (CBS et al., 2013).
Doorn, 2005) and GeoTOP (Stafleu et al., 2013) of the Ge-ological Survey of the Netherlands. The upper part of the phreatic aquifer (above−10 m a.m.s.l.) was subdivided into two hydrogeological zones with distinct hydraulic conduc-tivities, because the geological data showed systematic dif-ferences in the sediment composition within the model do-main: one zone coincides with most of the low-lying pold-ers and contains predominantly clay, loam, and fine sand deposits; the other zone contains most of the elevated ar-eas of the model domain, where mainly fine to coarse sand was deposited during the Holocene. The aquifer parameters and layer elevations were defined uniform for each hydroge-ological unit, based on parameter estimations in the national hydrogeological database (Table 1). The molecular diffusion coefficient was set to 10−9m2s−1, and the longitudinal dis-persivity was set to 0.2 m with a ratio of transversal to longi-tudinal dispersivity of 0.1. These values are similar to com-parable groundwater models in the same region (Eeman et al., 2011; de Louw et al., 2011; Vandenbohede and Lebbe, 2007, 2012).
Other model parameters such as recharge, and sur-face water levels were defined by spatially distributed and time-average values of the current situation. The average monthly precipitation and reference evapotranspiration be-tween 1981 and 2000 (Royal Netherlands Meteorological In-stitute, KNMI) were used to estimate the average seasonal (DJF, MAM, JJA, and SON) precipitation and evapotran-spiration. Crop and interception factors were used to esti-mate the actual evaporation in different land use classes (e.g. forest, agriculture, urban areas) (Droogers, 2009; Hooghart and Lablans, 1988; Meinardi, 1994; Statistics Netherlands, 2008). Water levels, depths, and widths of canals and ditches were provided by the Delfland Water Authority, and drainage levels were based on local knowledge and estimations from
the Netherlands Hydrological Instrument model (de Lange et al., 2014; Massop and van Bakel, 2008). Information on the extraction of groundwater and the infiltration of surface wa-ter in the dune area Solleveld was provided by the drinking water company Dunea.
In this paper, we have used TDS, where TDS equals salin-ity (g TDS L−1), and in the classification of the ground-water salinity we have focused on three classes: fresh (0– 1 g TDS L−1), brackish (1–10 g TDS L−1), and saline (10–
30 g TDS L−1). For the conversion of chloride to TDS we
have used the linear relation between chloride and TDS in the North Sea; 1 g TDS L−1=0.55 g Cl L−1 (Millero,
2003). The North Sea TDS in the model domain was esti-mated at 28 g TDS L−1for all model simulations (density of 1020 kg m−3), based on geo-electrical measurements in the North Sea near Ter Heijde between 1973 and 1997 (Rijk-swaterstaat, 2012). This salinity concentration is smaller than the general North Sea concentration (30–35 g TDS L−1), be-cause of the nearby freshwater discharge from the river Rhine. The TDS concentrations on the SE side of the model were defined by previous model calculations of the south-west of the Netherlands (Oude Essink et al., 2010). The TDS concentration of infiltration basins, canals, and ditches were set to 0.2 g TDS L−1, which is the average TDS
3.2 Calibration of pre-development conditions
The main purpose of the model calibration was to generate a valid representation of the pre-development conditions of the Sand Engine (prior to March 2010). In order to exclude anomalous effects of recent sand nourishments on groundwa-ter heads and concentrations, only observations prior to 2010 were included in the model calibration. We considered three calibration criteria: the error between simulated and observed groundwater head and TDS concentration should be similar or smaller than the observed variations in groundwater level (the average standard deviation of observations is 0.4 m) and concentration (the average standard deviation of observations is 0.7 g TDS L−1), the error should be randomly distributed in space, and the simulated distribution of the TDS concen-tration should correspond with literature (Stuyfzand, 1993).
The calibration comprised sensitivity analyses, (restricted) manual model parameter calibration, and comparisons of simulated groundwater heads and TDS concentrations with averaged observations of recent years. Historical processes that promote or diminish seawater intrusion were included in the calibration, because a salinity distribution often takes decades to hundreds of years to reach an equilibrium (Dels-man et al., 2014; Webb and Howard, 2011). Examples of historical processes that have substantially influenced the groundwater salinity in the Dutch coastal area are coastal erosion, sea-level rise, and groundwater extractions (Post et al., 2003). These processes were therefore included in the model simulations to attain a better match between simu-lations and observations, and the method of incorporation of the processes is briefly described in Table 2 and visual-ized and in Fig. 5. Other historical changes in, for example groundwater recharge and subsidence, were not included, be-cause measurements and historical data indicate that these processes probably have a negligible impact on the current head and concentration distribution in the study area (CBS et al., 2012; Hoofs and van der Pijl, 2002). The simulation was restricted to the period 1500–2010, because the focus of this study lies on the present conditions, and we assume that the most substantial effects on the present salt distribution will probably occur in this period. Before the simulation of the period 1500–2010, a transient simulation of the approximate conditions in AD 1500 was executed until the model con-verged to a dynamically stable state in terms of both ground-water heads and salinity.
In order to attain an optimal calibration result with a lim-ited number of model simulations, model parameters were manually adjusted with small increments from an initial best guess. The adjustments were performed on a selection of the model parameters: (horizontal and vertical) hydraulic con-ductivity, drainage resistance, stream bed resistance of canals and ditches, and (longitudinal and transverse) dispersivity. Other parameters such as groundwater recharge and surface water levels were based on measurements, maps or expert knowledge, and were excluded from the calibration. The
op-timized model parameters that were implemented for the model scenarios are described in Sect. 3.1.
3.3 Morphology and climate scenarios
The effect of the Sand Engine on fresh groundwater re-sources will primarily depend on the morphological evolu-tion of the coastal area. To assess the potential effect of the mega-nourishment on coastal groundwater, we performed model simulations containing projections of the morpholog-ical change of the Sand Engine during the period 2011–2050 (Table 2). The morphological development of the Sand En-gine in this period was simulated with the hydrodynamics and morphodynamics model code Delft3D (Lesser et al., 2004). This numerical morphodynamic model was calibrated for the period 2005–2010 and validated for the period 1990– 2005, prior to the construction of the Sand Engine (Fise-lier, 2010; Tonnon et al., 2009). Based on representative tidal boundaries and wave conditions of the current situation, the morphodynamic model was used to simulate the change in bathymetry from 2011 to 2050 (Fig. 6). These simulated changes in the bathymetry were incorporated in the ground-water model by sequential grid regenerations of the model grid, for every 3 months (viz. season) in the simulation pe-riod. Subsequent changes in the area of inundation, ground-water recharge and thickness of the phreatic aquifer were also adapted in the associated model input files. Estimations of the change in the mean water level in the lagoon (at the northern side of the Sand Engine), which result from the morpholog-ical changes, were also included in the model scenarios (de Vries et al., 2015). The expected maximum mean water level in the lagoon equalled 0.9 m a.m.s.l. in the simulation period. In addition to the morphological development of the Sand Engine, climate change may also have an impact on coastal groundwater. For the assessment of the potential impact of climate change on fresh groundwater resources, we have used the KNMI’14 climate change scenarios GL, GH, WL,
and WH(KNMI, 2014). These scenarios contain climate
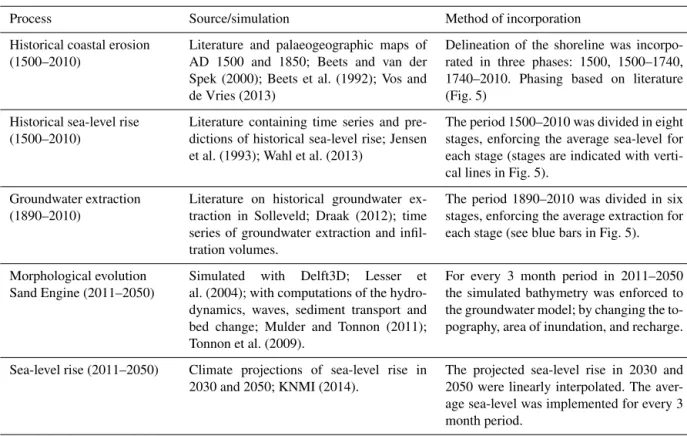
Table 2.Simulation of processes and method of incorporation in groundwater model.
Process Source/simulation Method of incorporation
Historical coastal erosion (1500–2010)
Literature and palaeogeographic maps of AD 1500 and 1850; Beets and van der Spek (2000); Beets et al. (1992); Vos and de Vries (2013)
Delineation of the shoreline was incorpo-rated in three phases: 1500, 1500–1740, 1740–2010. Phasing based on literature (Fig. 5)
Historical sea-level rise (1500–2010)
Literature containing time series and pre-dictions of historical sea-level rise; Jensen et al. (1993); Wahl et al. (2013)
The period 1500–2010 was divided in eight stages, enforcing the average sea-level for each stage (stages are indicated with verti-cal lines in Fig. 5).
Groundwater extraction (1890–2010)
Literature on historical groundwater ex-traction in Solleveld; Draak (2012); time series of groundwater extraction and infil-tration volumes.
The period 1890–2010 was divided in six stages, enforcing the average extraction for each stage (see blue bars in Fig. 5).
Morphological evolution Sand Engine (2011–2050)
Simulated with Delft3D; Lesser et
al. (2004); with computations of the hydro-dynamics, waves, sediment transport and bed change; Mulder and Tonnon (2011); Tonnon et al. (2009).
For every 3 month period in 2011–2050 the simulated bathymetry was enforced to the groundwater model; by changing the to-pography, area of inundation, and recharge.
Sea-level rise (2011–2050) Climate projections of sea-level rise in
2030 and 2050; KNMI (2014).
The projected sea-level rise in 2030 and 2050 were linearly interpolated. The aver-age sea-level was implemented for every 3 month period.
Table 3.Model climate change scenarios for the period 2011–2050, with two rates of SLR, starting at 0.05 m a.m.s.l. and seasonal variation in groundwater recharge (DJF, MAM, JJA, SON).
Climate scenario Sea-level rise Precipitation 2050 Potential evaporation 2050
(given per season) (given per season)
No climate change (NoCC) No sea-level rise (0.05 m a.m.s.l.) Equal to present: period 1981–2010 Equal to present: period 1981–2010 GL +3.75 mm yr−1[2050: 0.20 m a.m.s.l.] +3,+4.5,+1.2,+7 % +2.9,+1.3,+3.9,+2.7 % GH +3.75 mm yr−1[2050: 0.20 m a.m.s.l.] +8,+2.3,−8,+8 % +2.4,+2,+7.5,+2.8 % WL +6.25 mm yr−1[2050: 0.30 m a.m.s.l.] +8,+11,+1.4,+3 % +3.2,+1.7,+4.4,+5.8 % WH +6.25 mm yr−1[2050: 0.30 m a.m.s.l.] +17,+9,−13,+7.5 % +2.7,+2.9,+10.6,+4.5 %
4 Results
4.1 Model calibration
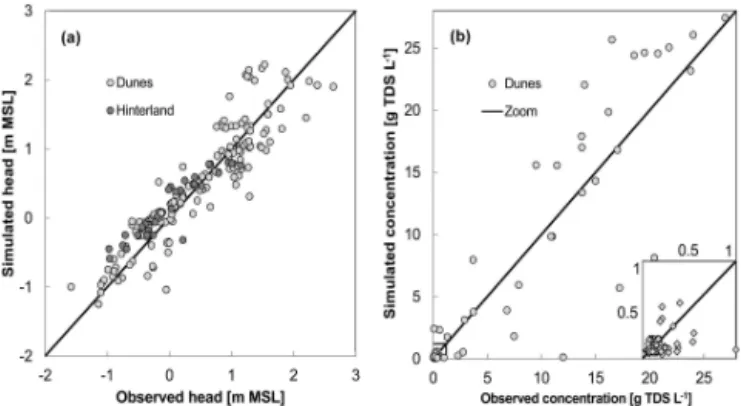
For the calibration of the variable-density groundwater model, we compared the simulated pre-development ground-water head and TDS concentration with recent observations of groundwater heads and chloride concentrations (Fig. 7). The calibration was performed with averaged values of re-cent observations, and therefore the transient model was strictly speaking not calibrated. We think this is acceptable, because of the long-term scope of this study, the conserva-tive value of 0.15 that was used for the specific yield in the simulations, and the deficiency in long-term time se-ries of head and especially salinity. The absolute mean error between observed and simulated heads was 0.27 m (RMSE of 0.33 m), and between observed and simulated TDS
con-centrations was 1.17 g TDS L−1(RMSE of 2.75 g TDS L−1). The largest deviations in head occur at observation points that are situated near infiltration basins or pumping wells, whereas the deviations in TDS concentration appear to be well-distributed. These deviations are probably primarily caused by heterogeneity in the phreatic aquifer and spatial variations in the extraction rates of pumping wells.
ground-2011 2020
2030 2040
0 0.5 1 2 3 km
2050 < -12
-12 – -10 -10 – -8 -8 – -6 -6 – -4
-4 – -3 -3 – -2 -2 – -1 -1 – 0 0 – 1
1 – 2 2 – 3 3 – 4 4 – 6 > 6 m MSL
±
Figure 6.Simulated morphological development of the Sand En-gine from 2011 to 2050, illustrated by contour maps with the terrain elevation (m a.m.s.l.).Figure 7.Comparison of observed and simulated heads(a)and
con-centration(b).
water level and depth of the fresh–brackish interface of the calibrated model are shown in Fig. 8. Phreatic groundwa-ter flows from the coastal dunes toward the sea, pumping wells, and low-lying drained polders. The aquitard beneath the phreatic aquifer (between−16 and−20 m a.m.s.l.) limits the interaction with the underlying confined aquifer, leading to a substantial head difference across the aquitard (rang-ing between 0.3 to 1.4 m in multilevel monitor(rang-ing wells). The fresh groundwater lens below the coastal dunes extents to approximately −30 and−40 m a.m.s.l. and the interface between brackish and saline groundwater lies between−40 and−50 m a.m.s.l., corresponding with the observed depth of the interfaces (Fig. 11). Drainage in low-lying polders leads to the seepage of brackish or saline groundwater, which re-sults in a reduction of the fresh groundwater lens thickness (Fig. 8).
In order to assess the performance of the calibrated groundwater model, we have compared simulated
ground-Phreatic groundwater level
±
Fresh–brackish interface depth< -1 m MSL L
-1 – -0.5
-0.5 – -0.2 2
-0.2 – 0
0 – 0.2
0.2 – 0.5
0.5 – 1
> 1 m MSL
> -10 m MSL L
-20 – -10
-25 – -20
-30 – -25
-35 – -30
-40 – -35
< -40 m MSL
No fresh groundwater
0 1 2km 0 1 2km
±
Figure 8.Phreatic groundwater level (left) and fresh–brackish in-terface depth (right) after calibration, before the construction of the Sand Engine (2010–2011).
0 0.5 1 1.5 2
0 0.5 1 1.5 2
Simulated
head
[m
M
S
L]
Observed head [m MSL] Sand Engine May–June 2014
(a)
0 5 10 15 20 25 30 35
0 5 10 15 20 25 30 35
Simulated co
ncentration
[g
TDS
L
-1]
Observed concentration [g TDS L-1]
Sand Engine March 2014
(b)
Figure 9.Comparison of(a)average groundwater heads in May–
June 2014 and(b)(single) TDS concentrations of soil samples taken
between 10 and 14 March 2014 with model simulations in the Sand Engine.
water heads and TDS concentrations with recent obser-vations at eight monitoring locations on the Sand Engine (Fig. 9). The absolute mean error between observed and sim-ulated groundwater heads was 0.36 m, and between observed and simulated TDS concentrations was 6.5 g TDS L−1. The model appears to underestimate the hydraulic gradient – in particular in the higher regions of the Sand Engine – and groundwater salinities with a concentration higher than 15 g TDS L−1(between 6 and 20 m below surface). Probable
causes of these discrepancies lie in the initial groundwater level and salinity (strongly influenced by the construction), the underestimation of the vertical anisotropy as a result of small mud drapes in the Sand Engine and varying weather conditions (e.g. recharge, overwash). In addition, the mea-sured TDS concentrations are single point measurements that may not represent the average TDS concentration in the Sand Engine.
4.2 Fresh groundwater resources
ground--4.5 -4 -3.5 -3 -2.5 -2 -1.5 -1 -0.5 0 0.5 1
2010 2020 2030 2040 2050
Increase in
fresh
groundw
a
ter
v
o
lume
in refere
nce
case
[million
m
3]
Time [years]
NoCC GH GL WH WL
(a)
-2 0 2 4 6 8 10 12
2010 2020 2030 2040 2050
Increase in
fresh
groundw
a
ter
v
o
lume
in s
ituation
w
ith
Sand
Engine
[million m
3]
Time [years]
NoCC GH GL WH WL
(b)
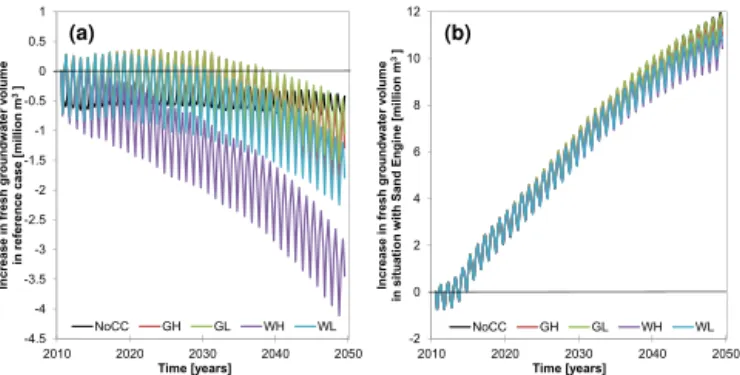
Figure 10.Increase of the volume of fresh groundwater in the
sit-uation without Sand Engine(a)and situation with Sand Engine(b)
in the period 2011 to 2050, where the legend refers to (climate) sce-narios (as mentioned in Table 3).
water is initially small and similar to the situation without the Sand Engine (Fig. 10). In all model scenarios the volume of fresh groundwater slightly declines in the first years, because of the small size of the freshwater lens in the Sand Engine with respect to the cell resolution and the instability of the initial conditions. However, the gradual growth of the fresh-water lens in the Sand Engine and adjacent areas eventually leads to an increase of the volume of fresh groundwater in the model domain of 0.3 to 0.5 million m3yr−1. This increase of the volume of fresh groundwater manifests itself mainly as an outward extension of the fresh groundwater lens in the phreatic aquifer. Underlying aquifers and aquitards may even become more saline, primarily as a result of transient bound-ary conditions (i.e. historical coastal erosion and ongoing sea-level rise) leading to continuing historical seawater in-trusion. In addition, rising groundwater levels in and around Sand Engine can lead to increases in the infiltration of saline groundwater through the thin aquitard (Figs. 11 and 12).
The sea-level rise (in total) of 0.15 m in climate scenar-ios GLand GHand 0.25 m in climate scenarios WLand WH
lead to a decline in the volume of fresh groundwater, be-cause of the increase of seawater intrusion and inundation of the coastal area. However, the effect of sea-level rise is rela-tively small in respect to the total increase of fresh ground-water (Fig. 10). The long-term predictions in precipitation and evapotranspiration within the four climate scenarios (Ta-ble 3) have a limited effect on the total volume of fresh groundwater. The climate scenarios with a strong response (GH and WH) lead to a smaller volume of fresh
groundwa-ter, when compared with the climate scenarios with a weak response (GLand WL). This is primarily a result of the
differ-ence in the net groundwater recharge in the climate scenar-ios, and the overall (yearly) volume of groundwater recharge is larger in the milder climate scenarios (GL and WL). The
larger increase in precipitation in winter seasons of climate scenario GH and WH, coincides with a stronger increase in
evaporation and a smaller increase in precipitation in the summer seasons (Table 3). However, the contrast between
these climate scenarios only becomes apparent after 2030, because the precipitation and evapotranspiration patterns are equal until 2030 and diverge after 2030.
In addition to the change in fresh groundwater resources in the beach–dune system, the simulations with the long-term morphological evolution of the Sand Engine show small to negligible increases (smaller than 1 m in 2050) in the fresh-water lens thickness in low-lying polders. However, changes in the total salt load in drains, canals, and ditches are small in the situation with and without the Sand Engine. As a result the construction and morphological evolution of the Sand Engine may lead to small decrease of seawater intrusion, but this effect will probably be small to negligible and limited to small low-lying polders in a short distance from the Sand Engine (Fig. 13).
5 Discussion
The model simulations show that the construction of the Sand Engine may result in the growth of the volume of fresh groundwater by several million m3. Despite the grad-ual erosion of the nourished sand – leading to a slow re-turn to the previous state – the volume of fresh groundwa-ter may continue to rise for decades afgroundwa-ter the construction of the mega-nourishment. However, tidal fluctuations and in particular storm surges will lead to land-surface inundations and consequently to a salinization of fresh groundwater. In addition, the increase in the volume of fresh groundwater is dependent on the rate of sea-level rise and the extent to which precipitation and evapotranspiration patterns will di-verge from present conditions. This steady increase in the volume of fresh groundwater is in contrast with the reference case (without the construction of the Sand Engine) where his-torical and future sea-level rise lead to a decrease of the vol-ume of fresh groundwater. Our results also suggest that the construction of the Sand Engine may abate the salinization of neighbouring polders, by reducing upward seepage of saline groundwater. Even though the reduction of the salinization is probably slight and limited to a small area, it might consti-tute an important mitigation in other applications of mega-nourishments.
Figure 11.Transects with the simulated groundwater salinity (in g TDS L−1) in 2010 (pre-development Sand Engine), for transect A and B (as shown in Figs. 2 and 3).
Figure 12.Transects with the simulated groundwater salinity (in g TDS L−1)in 2050 (including Sand Engine, No Climate Change), for transect A and B (as shown in Figs. 2 and 3).
2011 2020
2030 2040
0 0.51 2 3
km
2050 < 1 m
1 – 2 2 – 5 5 – 10 10 – 20 20 – 30
> 30 m
±
Figure 13.Thickness of fresh groundwater [m] in reference sce-nario near the Sand Engine from 2011 to 2050.
Considering the scale and nature of our research objective, we neglected small and local variations in hydraulic param-eters (e.g. hydraulic conductivity, layer thickness, porosity, and storage coefficient) in the model simulations. Supported by geological data and models, each aquifer and aquitard was defined homogenous and anisotropic, with the exception of the phreatic aquifer. This reduction of the model complex-ity enhances the abilcomplex-ity to differentiate and to understand the simulated processes, and leads to a smaller computation time of the model. However, small or local variations in ground-water head or salinity that are caused by heterogeneity will not be accurately reproduced in the model simulations.
One of the largest uncertainties in the study is the long-term morphological evolution of the Sand Engine, despite extensive calibration and validation and the large number of processes that are included in Delft3D (e.g. wind shear, wave forces, tidal forces, density-driven flows). The highly dynamic nature of the coastal zone, the absence of aeolian transport in the Delft3D simulations, and the lack of under-standing of some processes, can lead to incremental differ-ences with reality. Even though measurements of the last 4 years show a reasonable fit with the projections of the sed-iment volume changes and erosion patterns (de Schipper et al., 2014), future morphological change can turn out to be significantly different from the morphological model. For ex-ample, the growth of dune grasses and the exposure of shell deposits may prove to reduce erosion and decelerate the mor-phological evolution of the Sand Engine, or an accumulation of sand in the lagoon might lead to earlier silt up, and there-fore a reduction of seawater intrusion in comparison with the projections. The implementation of one simulation of mor-phological change in the model calculations is therefore a significant limitation in the estimation of the potential fresh groundwater resources. For a more extensive analysis of the uncertainties in the prediction of the effects on fresh ground-water resources, it is recommended to simulate more mor-phological scenarios in future studies.
In addition to the long-term morphological evolution of the Sand Engine, large uncertainties also exist in the climato-logical predictions of sea-level rise, precipitation, and evap-oration in future decades. Predictions of sea-level rise for the North Sea in 2050 range between 15 to 40 cm a.m.s.l., and model simulations have shown that substantial changes in the growth or volume of fresh groundwater resources can occur within this range. Changes in sea-level rise and the intensity or frequency of storm surges will not only significantly in-fluence fresh groundwater, but will also contribute to coastal erosion and alter the morphological development of the Sand Engine.
6 Conclusions
Local mega-nourishments such as the Sand Engine might be-come an effective solution for the threats that many low-lying coastal regions face, and with this study we have shown that fresh groundwater resources can substantially grow within the lifespan of the nourishment. The results in this study show that for the Sand Engine, the construction of a mega-nourishment can lead to increase of fresh groundwater of approximately 0.3 to 0.5 million m3yr−1. However, the in-crease in fresh groundwater resources in a mega-nourishment is highly dependent on the shape and location of the mega-nourishment, the precipitation surplus, the frequency and in-tensity of storm surges, and local hydrogeological condi-tions. Therefore, dependent on the design and location of the mega-nourishment this may provide an opportunity to com-bine coastal protection with the protection of fresh ground-water resources. This study also demonstrated that, with rela-tively simple modifications, a changing morphology can eas-ily be modelled with a variable-density groundwater model such as SEAWAT.
7 Data availability
Appendix A: Grid convergence test
In order to justify that the chosen spatial discretization was adequate for reliable numerical quantifications of the po-tential effect of the Sand Engine on fresh groundwater re-sources, we have executed a grid convergence test for the period 2011 to 2050 (with and without Sand Engine). The numerical simulations that are described in this paper were performed with a horizontal grid size of 50 m, and 50 layers with a variable thickness from 1 (upper layers) to 10 m (lower layers). This spatial discretization was tested with three addi-tional simulations with higher and lower spatial resolutions (Table A1): one with a finer horizontal grid size of 25 m (model simulation S1), one with a coarser horizontal grid size of 100 m (S2), and one with an equal horizontal grid size of 50 m and an increased vertical resolution of the upper layers (S3). In the upper part of the model, up to a depth of
−50 m a.m.s.l., the layer thicknesses were lowered by 50 % (30 layers were added, up to a total of 80 layers).
Stability constraints and accuracy requirements were used for the temporal discretization of the simulations, and there-fore the convergence of the solutions with regard to the tem-poral discretization was not tested. However, we have per-formed an additional test with respect to the coupling of the flow and solute-transport equations. The simulations were conducted with the “explicit coupling” approach. In order to test this coupling approach, an additional simulation was conducted with the “implicit coupling” approach (density criterion of 0.2 kg m−3). For more information on these cou-pling approaches, we refer to the reports that describe the model code SEAWAT (Guo and Langevin, 2002; Langevin et al., 2003).
All the additional numerical simulations include no cli-mate change scenario, and were compared to the current nu-merical simulations that contained a horizontal resolution of 50 m and 50 layers. The initial conditions of all addi-tional numerical simulations were equal to the calibrated pre-development groundwater heads and TDS concentrations.
The comparison of the numerical simulations with vary-ing spatial resolutions (Fig. A1) shows a similar increase of the volume of fresh groundwater during the simulation period of 2011 to 2050. In the situation with the Sand En-gine (Fig. A1b), a coarser spatial resolution lowered the pro-jected volume of fresh groundwater (−10 % in 2050), and a finer horizontal and vertical spatial resolution raised the pro-jected volume of groundwater (respectively+4 and+20 % in 2050). However, when taking into account the deviations in the volume of fresh groundwater in the reference case (Fig. A1a), the total change in the volume of fresh ground-water becomes smaller; respectively−2,+0 and+14 % in 2050. The additional simulation with the “implicit approach” to coupling shows a small to negligible difference (smaller than 2 % during the entire simulation period) with the simu-lations with the “explicit approach” to coupling of flow and transport equations (Fig. A2).
-2 -1.5 -1 -0.5 0 0.5 1 1.5
2010 2020 2030 2040 2050
Increase in
fresh
groundw
ater
v
o
lume
in reference
case
[million
m
3]
Time [years]
50 m 25 m 100 m 80 layers
(a)
-2 0 2 4 6 8 10 12 14 16
2010 2020 2030 2040 2050
Increase in
fresh
groundw
ater
v
o
lume
in s
ituation
w
ith
Sand
Engine
[million m
3]
Time [years]
50 m 25 m 100 m 80 layers
(b)
Figure A1.Increase of the volume of fresh groundwater in the situation without Sand Engine(a)and situation with Sand Engine(b)in the period 2011 to 2050, where the legend refers to the four grid discretization simulations.
-2 -1.5 -1 -0.5 0 0.5 1 1.5
2010 2020 2030 2040 2050
Increase in
fresh
groundw
a
ter
v
o
lume
in reference
case
[million
m
3]
Time [years]
Explicit coupling (current) Implict coupling (a)
-2 0 2 4 6 8 10 12 14 16
2010 2020 2030 2040 2050
Increase in
fresh
groundw
a
ter
v
o
lume
in
s
it
u
a
ti
o
n
w
it
h
Sa
n
d
En
g
in
e
[
m
il
li
o
n
m
3]
Time [years]
Explicit coupling (current) Implict coupling (b)
Figure A2.Increase of the volume of fresh groundwater in the situation without Sand Engine(a)and situation with Sand Engine(b)in the period 2011 to 2050, where the legend refers to the coupling of flow and transport equations.
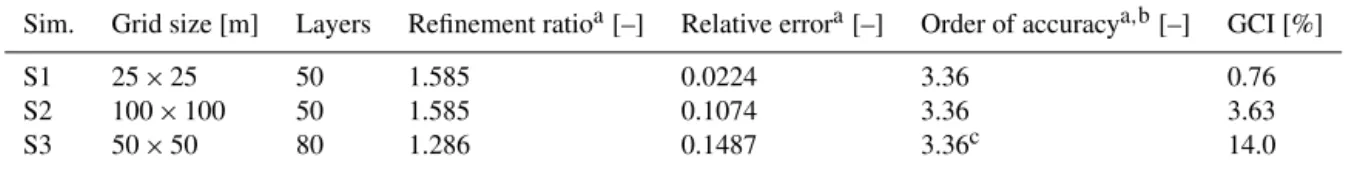
Table A1.Grid convergence index (GCI) of the simulated increase in the volume of fresh groundwater in 2050 (situation with Sand Engine), for three simulations that contain different spatial grid refinements (S1 to S3).
Sim. Grid size [m] Layers Refinement ratioa[–] Relative errora[–] Order of accuracya,b[–] GCI [%]
S1 25×25 50 1.585 0.0224 3.36 0.76
S2 100×100 50 1.585 0.1074 3.36 3.63
S3 50×50 80 1.286 0.1487 3.36c 14.0
Acknowledgements. We thank Arjen Luijendijk and Pieter Koen Tonnon for providing Delft3D data, and performing additional Delft3D simulations. This research is supported by the Dutch Technology Foundation STW, which is part of the Netherlands Organisation for Scientific Research (NWO), and which is partly funded by the Ministry of Economic Affairs. This work was carried out within the Nature-driven nourishment of coastal systems (NatureCoast) program.
Edited by: I. Neuweiler
Reviewed by: G. Houben and two anonymous referees
References
Bakker, M. A. J., van Heteren, S., Vonhögen, L. M., van der Spek, A. J. F., and van der Valk, B.: Recent Coastal Dune Develop-ment: Effects of Sand Nourishments, J. Coast. Res., 282, 587– 601, doi:10.2112/JCOASTRES-D-11-00097.1, 2012.
Beets, D. J. and van der Spek, A. J. F.: The Holocene evolution of the barrier and the back-barrier basins of Belgium and the Netherlands as a function of late Weichselian morphology, rel-ative sea-level rise and sediment supply, Netherlands J. Geosci., 79, 3–16, doi:10.1017/S0016774600021533, 2000.
Beets, D. J., van der Valk, L., and Stive, M. J. F.: Holocene evolution of the coast of Holland, Mar. Geol., 103, 423–443, doi:10.1016/0025-3227(92)90030-L, 1992.
Buma, J. T.: Monitoring plan drainage measure Solleveld; Mon-itoring of groundwater and effectiveness of drainage mea-sure, Deltares, Report No. 1202884-001-BGS-0006, Utrecht, the Netherlands, 2013 (in Dutch).
CBS, PBL and Wageningen UR: Yearly volume of precipita-tion in the Netherlands, (indicator 0508, version 05, 23 March 2012), www.compendiumvoordeleefomgeving.nl (last access: 13 May 2015), CBS, Den Haag, Planbur, voor Leefomgeving, Den Haag/Bilthoven en Wageningen UR, Wageningen, available at: http://www.compendiumvoordeleefomgeving.nl/indicatoren/ nl0508-Neerslagsom-in-Nederland.html?i=9-54 (last access: 13 May 2015), 2012 (in Dutch).
CBS, PBL and Wageningen UR: Sea-level along the Dutch coast and global 1891–2012, (indicator 0229, versie 08, 24 september 2013), www.compendiumvoordeleefomgeving.nl (last access: 13 May 2015), CBS, Den Haag; Planbur. voor Leefomgeving, Den Haag/Bilthoven en Wageningen UR, Wageningen, available at: http://www.compendiumvoordeleefomgeving.nl/indicatoren/ nl0229-Zeespiegelstand-Nederland.html?i=9-54 (last access: 13 May 2015), 2013 (in Dutch).
Charlier, R. H., Chaineux, M. C. P., and Morcos, S.: Panorama of the History of Coastal Protection, J. Coast. Res., 211, 79–111, doi:10.2112/03561.1, 2005.
Chui, T. F. M. and Terry, J. P.: Influence of sea-level rise on freshwater lenses of different atoll island sizes and lens re-silience to storm-induced salinization, J. Hydrol., 502, 18–26, doi:10.1016/j.jhydrol.2013.08.013, 2013.
Crain, C. M., Halpern, B. S., Beck, M. W., and Kappel, C. V: Understanding and managing human threats to the coastal marine environment, Ann. N. Y. Acad. Sci., 1162, 39–62, doi:10.1111/j.1749-6632.2009.04496.x, 2009.
de Lange, W. J., Prinsen, G. F., Hoogewoud, J. C., Veldhuizen, A. A., Verkaik, J., Oude Essink, G. H. P., van Walsum, P. E. V., Dels-man, J. R., Hunink, J. C., Massop, H. T. L., and Kroon, T.: An op-erational, multi-scale, multi-model system for consensus-based, integrated water management and policy analysis: The Nether-lands Hydrological Instrument, Environ. Model. Softw., 59, 98– 108, doi:10.1016/j.envsoft.2014.05.009, 2014.
de Louw, P. G. B., Eeman, S., Siemon, B., Voortman, B. R., Gun-nink, J., van Baaren, E. S., and Oude Essink, G. H. P.: Shal-low rainwater lenses in deltaic areas with saline seepage, Hy-drol. Earth Syst. Sci., 15, 3659–3678, doi:10.5194/hess-15-3659-2011, 2011.
Delsman, J. R., Hu-a-ng, K. R. M., Vos, P. C., de Louw, P. G. B., Oude Essink, G. H. P., Stuyfzand, P. J., and Bierkens, M. F. P.: Paleo-modeling of coastal saltwater intrusion during the Holocene: an application to the Netherlands, Hydrol. Earth Syst. Sci., 18, 3891–3905, doi:10.5194/hess-18-3891-2014, 2014. Deltacommissie: Working Together with Water: A Living Land
Builds for its Future, Findings of the Deltacommissie, second ed., Rotterdam, the Netherlands, 2008.
de Ronde, J. G.: Future long-term demand for nourishment, Deltares, report no. Z4582.24, Deltares, Delft, 2008 (in Dutch). de Ruig, J. H. M. and Hillen, R.: Developments in Dutch
coastline management: Conclusions from the second gov-ernmental coastal report, J. Coast. Conserv., 3, 203–210, doi:10.1007/BF02908195, 1997.
de Schipper, M. A., de Vries, S., Stive, M. J. F., de Zeeuw, R. C., Rutten, J., Ruessink, B. G., Aarninkhof, S. G. J., and van Gelder-Maas, C.: Morphological development of a mega-nourishment; first observations at the Sand Engine, Coastal Engineering Pro-ceedings, 1–6, Seoul, Korea, 2014.
de Schipper, M. A., de Vries, S., Ruessink, G., de Zeeuw, R. C., Rutten, J., van Gelder-Maas, C., and Stive, M. J. F.: Ini-tial spreading of a mega feeder nourishment: Observations of the Sand Engine pilot project, Coast. Eng., 111, 23–38, doi:10.1016/j.coastaleng.2015.10.011, 2016.
de Sherbinin, A., Warner, K., and Ehrhart, C.:
Casu-alties of Climate Change, Sci. Am., 304, 64–71,
doi:10.1038/scientificamerican0111-64, 2011.
de Vries, S., Radermacher, M., de Schipper, M. A., and Stive, M. J. F.: Tidal dynamics in the Sand Motor lagoon, in E-proceedings of the 36th IAHR World Congress, 1–6, The Hague, the Netherlands, available at: http://resolver.tudelft.nl/ uuid:e49d8911-72c2-4f6c-a8b4-7009954134c0, 2015.
de Vriend, H., Aarninkhof, S. and van Koningsveld, M.: “Building with nature”: the new Dutch approach to coastal and river works, Proc. ICE-Civ. Eng., 167, 18–24, doi:10.1680/cien.13.00003, 2014.
Draak, R.: Water extraction in the Dunes, Holland’s Duinen, 60, 50–54, 2012 (in Dutch).
Droogers, P.: Improvement of the determination of actual evapora-tion for strategic water management, STOWA, Report Number 2009-11, Utrecht, the Netherlands, 2009 (in Dutch).
Ebbens, E. and Fiselier, J.: Monitoring and evaluation plan Sand Engine, DHV B.V., Report Number WA-WN20100028, Amers-foort, the Netherlands, 2010 (in Dutch).
upwelling saline water, Adv. Water Resour., 34, 291–302, doi:10.1016/j.advwatres.2010.12.001, 2011.
Few, R. and Matthies, F.: Flood Hazards and Health, Earthscan, Routledge, London, UK, 2006.
Fiselier, J.: Project plan/EIA: Construction and extraction of sand, Sand Engine Delfland coast, DHV B.V., Report Number WA-WN20090054, DHV BV, Amersfoort, the Netherlands, 2010 (in Dutch).
FitzGerald, D. M., Fenster, M. S., Argow, B. A., and
Buynevich, I. V.: Coastal Impacts Due to Sea-Level
Rise, Annu. Rev. Earth Planet. Sci., 36, 601–647,
doi:10.1146/annurev.earth.35.031306.140139, 2008.
Giardino, A., Mulder, J., de Ronde, J., and Stronkhorst, J.: Sus-tainable Development of the Dutch Coast: Present and Future, J. Coast. Res., 61, 166–172, doi:10.2112/SI61-001.11, 2011. Giosan, L., Syvitski, J., Constantinescu, S., and Day, J.:
Cli-mate change: Protect the world’s deltas, Nature, 516, 31–33, doi:10.1038/516031a, 2014.
Goodhew, T.: Coastal Flood Defences – Strategies for Protection in the United Kingdom, in Water Resources in the Built Environ-ment: Management Issues and Solutions, edited by: Booth, C. A. and Charlesworth, S. M., John Wiley & Sons, Ltd, Chichester, UK, 233–248, 2014.
Guo, W. and Langevin, C. D.: User’s Guide to SEAWAT?: A Com-puter Program For Simulation of Ground-Water Flow, in Tech-niques of Water-Resources Investigations of the U.S. Geological Survey, p. 87, US Geological Survey, Tallahassee, Florida, USA, 2002.
Heiss, J. W. and Michael, H. A.: Saltwater-freshwater mix-ing dynamics in a sandy beach aquifer over tidal, sprmix-ing- spring-neap, and seasonal cycles, Water Resour. Res., 50, 6747–6766, doi:10.1002/2014WR015574, 2014.
Herckenrath, D., Langevin, C. D., and Doherty, J.: Predic-tive uncertainty analysis of a saltwater intrusion model us-ing null-space Monte Carlo, Water Resour. Res., 47, W05504, doi:10.1029/2010WR009342, 2011.
Hoggart, S. P. G., Hanley, M. E., Parker, D. J., Simmonds, D. J., Bilton, D. T., Filipova-Marinova, M., Franklin, E. L., Kotsev, I., Penning-Rowsell, E. C., Rundle, S. D., Trifonova, E., Vergiev, S., White, A. C., and Thompson, R. C.: The consequences of doing nothing: The effects of seawater flooding on coastal zones, Coast. Eng., 87, 169–182, doi:10.1016/j.coastaleng.2013.12.001, 2014. Holding, S. and Allen, D. M.: From days to decades: numerical modelling of freshwater lens response to climate change stressors on small low-lying islands, Hydrol. Earth Syst. Sci., 19, 933– 949, doi:10.5194/hess-19-933-2015, 2015.
Hoofs, J. and van der Pijl, Y.: Map Bibliography of the Water-staatskaart (1865–1991), Ministerie van Verkeer en Waterstaat, Rijkswaterstaat, Meetkundige Dienst (RWS, MD), afd. IEBD, Delft, the Netherlands, 2002 (in Dutch).
Hooghart, J. C. and Lablans, W. N.: From Penman to Makkink: a new calculation method for the climatological numbers of evap-oration), KNMI, TR-111, De Bilt, the Netherlands, 1988 (in Dutch).
IPCC: Climate Change 2013: The Physical Science Basis Working Group I Contribution to the Fifth Assessment Report of the Inter-governmental Panel on Climate Change, edited by: Stocker, T. F., Qin, D., Plattner, G.-K., Tignor, M., Allen, S. K., Boschung, J.,
Nauels, A., Xia, Y., Bex, V., and Midgley, P. M., Cambridge Uni-versity Press, Cambridge, UK and New York, NY, USA, 2013. Jensen, J., Hofstede, J. L. A., Kunz, H., de Ronde, J., Heinen,
P. F. and Siefent, W.: Long term water level observations and variations, in Coastal Zone, Proceedings of the Symposium on Coastal and Ocean Management, 110–130, New Orleans, LA, USA, 1993.
Kabat, P., Fresco, L. O., Stive, M. J. F., Veerman, C. P., van Alphen, J. S. L. J., Parmet, B. W. A. H., Hazeleger, W., and Katsman, C. A.: Dutch coasts in transition, Nat. Geosci., 2, 450–452, doi:10.1038/ngeo572, 2009.
Keijsers, J. G. S., Poortinga, A., Riksen, M. J. P. M., and Maroulis, J.: Spatio-Temporal Variability in Accretion and Erosion of Coastal Foredunes in the Netherlands: Regional Climate and Lo-cal Topography, edited by: Dias, J. M., PLoS One, 9, e91115, doi:10.1371/journal.pone.0091115, 2014.
Keijsers, J. G. S., Giardino, A., Poortinga, A., Mulder, J. P. M., Riksen, M. J. P. M., and Santinelli, G.: Adaptation strategies to maintain dunes as flexible coastal flood defense in The Netherlands, Mitig. Adapt. Strateg. Glob. Chang., 20, 913–928, doi:10.1007/s11027-014-9579-y, 2015.
KNMI: KNMI’14?: Climate Change scenarios for the 21st Century – A Netherlands perspective, edited by: van den Hurk, B., Sieg-mund, P., Klein, A., Eds, T., Attema, J., Bakker, A., Beersma, J., Bessembinder, J., Boers, R., Brandsma, T., van den Brink, H., Drijfhout, S., Eskes, H., Haarsma, R., Hazeleger, W., Jilderda, R., Katsman, C., Lenderink, G., Loriaux, J., van Meijgaard, E., van Noije, T., van Oldenborgh, G. J., Selten, F., Siebesma, P., Sterl, A., de Vries, H., van Weele, M., de Winter, R., and van Zadel-hoff, G.-J., Scientific Report WR2014-01, KNMI, De Bilt, the Netherlands, available at: http://bibliotheek.knmi.nl (last access: 1 August 2016), 2014.
Kooi, H., Groen, J., and Leijnse, A.: Modes of seawater intru-sion during transgresintru-sions, Water Resour. Res., 36, 3581–3589, doi:10.1029/2000WR900243, 2000.
Langevin, C. D., Barclay, W., and Guo, W.: MODFLOW-2000, the U.S. Geological Survey Modular Ground-Water Model – Doc-umentation of the SEAWAT-2000 Version with the Variable-Density Flow Process (VDF) and the Integrated MT3DMS Transport Process (IMT), 52, 2003.
Langevin, C. D., Thorne Jr., D. T., Dausman, A., Sukop, M. C., and Guo, W.: SEAWAT version 4: A Computer Program for Simula-tion of Multi-Species Solute and Heat Transport, in: US Geologi-cal Survey Techniques and Methods Book 6, Chapter A22, p. 39, US Geological Survey, Reston, Virginia, USA, 2008.
Lesser, G. R., Roelvink, J. A., van Kester, J. A. T. M., and Stelling, G. S.: Development and validation of a three-dimensional morphological model, Coast. Eng., 51, 883–915, doi:10.1016/j.coastaleng.2004.07.014, 2004.
Mahmoodzadeh, D., Ketabchi, H., Ataie-Ashtiani, B., and Sim-mons, C. T.: Conceptualization of a fresh groundwater lens influenced by climate change: A modeling study of an arid-region island in the Persian Gulf, Iran, J. Hydrol., 519, 399–413, doi:10.1016/j.jhydrol.2014.07.010, 2014.
Massop, H. T. L. and van Bakel, P. J. T.: National Hydrologic Instru-ment – NHI, Model report, Section Drainage, NHI, Report
ver-sion NHI\FASE_1+\2008\DR8\v1, available at: http://nhi.nu
McGranahan, G., Balk, D., and Anderson, B.: The rising tide: assessing the risks of climate change and human settlements in low elevation coastal zones, Environ. Urban., 19, 17–37, doi:10.1177/0956247807076960, 2007.
Meinardi, C. R.: Groundwater recharge and travel times in the sandy regions of the Netherlands, Ph.D. Thesis, VU University Amster-dam, AmsterAmster-dam, the Netherlands, 1994.
Michael, H. A., Russoniello, C. J., and Byron, L. A.: Global as-sessment of vulnerability to sea-level rise in topography-limited and recharge-limited coastal groundwater systems, Water Re-sour. Res., 49, 2228–2240, doi:10.1002/wrcr.20213, 2013. Millero, F. J.: Physicochemical Controls on Seawater, in Treatise
on Geochemistry, Chapter 6.01, edited by: Elderfield, H., 1–21, Elsevier, Amsterdam, 2003.
Mulder, J. P. M. and Tonnon, P. K.: “Sand Engine”?:
Background and Design of a Mega-Nourishment
Pi-lot in The Netherlands, Coast. Eng. Proc., 1, 1–10,
doi:10.9753/icce.v32.management.35, 2011.
Nicholls, R. J.: Impacts of and responses to Sea-Level Rise, in: Un-derstanding Sea-Level Rise and Variability, edited by: Church, J. A., Woodworth, P. L., Aarup, T., and Wilson, W. W., 17–51, Wiley-Blackwell, 2010.
Nicholls, R. J., Brown, S., Hanson, S., and Hinkel, J.: Economics of Coastal Zone Adaptation to Climate Change, Washington D.C., USA, 2010.
Oude Essink, G. H. P.: Improving fresh groundwater supply– problems and solutions, Ocean Coast. Manag., 44, 429–449, doi:10.1016/S0964-5691(01)00057-6, 2001.
Oude Essink, G. H. P. and Waterman, R. E.: Impacts of offshore land reclamation on fresh groundwater volumes under coastal dunes and inland surface water, Hydrol. Process., submitted, 2016. Oude Essink, G. H. P., van Baaren, E. S., and de Louw, P. G. B.:
Ef-fects of climate change on coastal groundwater systems: A mod-eling study in the Netherlands, Water Resour. Res., 46, W00F04, doi:10.1029/2009WR008719, 2010.
Post, V. E. A., van der Plicht, H., and Meijer, H. A. J.: The origin of brackish and saline groundwater in the coastal area of the Netherlands, Netherlands, J. Geosci., 82, 133–147, doi:10.1017/S0016774600020692, 2003.
Rasmussen, P., Sonnenborg, T. O., Goncear, G., and Hinsby, K.: As-sessing impacts of climate change, sea level rise, and drainage canals on saltwater intrusion to coastal aquifer, Hydrol. Earth Syst. Sci., 17, 421–443, doi:10.5194/hess-17-421-2013, 2013. Rijkswaterstaat: Salinity in the North Sea along the coast
(in Dutch), North Sea Atlas, Part I. Water Syst., avail-able at: http://www.noordzeeloket.nl/en/spatial-management/ north-sea-atlas/watersysteem/zoutgehalte.aspx, 2012.
Roache, P. J.: Perspective: A Method for Uniform Reporting of Grid Refinement Studies, J. Fluids Eng., 116, 405–413, 1994. Slobbe, E., Vriend, H. J., Aarninkhof, S., Lulofs, K., Vries, M.,
and Dircke, P.: Building with Nature: in search of resilient storm surge protection strategies, Nat. Hazards, 65, 947–966, doi:10.1007/s11069-012-0342-y, 2013.
Stafleu, J., Maljers, D., Busschers, F. S., Gunnink, J. L., Schokker, J., Dambrink, R. M., Hummelman, H. J., and Schijf, M. L.: GeoTop construction (in Dutch), TNO, Report No. 2012, R10991, Utrecht, the Netherlands, 2013.
Statistics Netherlands: Bestand Bodemgebruik
(File Landuse), CBS, The Hague, the
Nether-lands, available at: https://www.pdok.nl/nl/service/
wms-cbs-bestand-bodemgebruik-2008-bbg-2008 (last
ac-cess: 11 May 2015), 2008.
Stern, F., Wilson, R. V., Coleman, H. W., and Paterson, E. G.: Com-prehensive Approach to Verification and Validation of CFD Sim-ulations – Part 1: Methodology and Procedures, J. Fluids Eng., 123, 793–802, doi:10.1115/1.1412235, 2001.
Sterr, H.: Assessment of Vulnerability and Adaptation to Sea-Level Rise for the Coastal Zone of Germany, J. Coast. Res., 242, 380– 393, doi:10.2112/07A-0011.1, 2008.
Stive, M. J. F., de Schipper, M. A., Luijendijk, A. P., Aarninkhof, S. G. J., van Gelder-Maas, C., van Thiel de Vries, J. S. M., de Vries, S., Henriquez, M., Marx, S., and Ranasinghe, R.: A New Alterna-tive to Saving Our Beaches from Sea-Level Rise: The Sand En-gine, J. Coast. Res., 290, 1001–1008, doi:10.2112/JCOASTRES-D-13-00070.1, 2013.
Stuyfzand, P. J.: Hydrochemistry and Hydrology of the Coastal Dunea area of the Western Netherlands, Ph.D. Thesis, VU Uni-versity Amsterdam, Amsterdam, the Netherlands, 1993. Stuyfzand, P. J.: Predicting the effects of sea spray deposition and
evapoconcentration on shallow coastal groundwater salinity un-der various vegetation types, in 23rd Salt Water Intrusion Meet-ing, 401–404, Husum, Germany, 2014.
Syvitski, J. P. M., Kettner, A. J., Overeem, I., Hutton, E. W. H., Han-non, M. T., Brakenridge, G. R., Day, J., Vörösmarty, C., Saito, Y., Giosan, L., and Nicholls, R. J.: Sinking deltas due to human ac-tivities, Nat. Geosci., 2, 681–686, doi:10.1038/ngeo629, 2009. Temmerman, S., Meire, P., Bouma, T. J., Herman, P. M. J.,
Ysebaert, T., and de Vriend, H. J.: Ecosystem-based coastal defence in the face of global change, Nature, 504, 79–83, doi:10.1038/nature12859, 2013.
Tonnon, P. K., van der Werf, J., and Mulder, J. P. M.: Morphologi-cal simulations, Environmental Impact Assesment Sand Engine, Deltares, report no. 1201001-000-ZKS-0017, Delft, the Nether-lands, 2009 (in Dutch).
Tonnon, P. K., van der Valk, L., Holzhauer, H., Baptist, M. J., Wi-jsman, J. W. M., Vertegaal, C. T. M., and Arens, S. M.: Execu-tion program Monitoring and EvaluaExecu-tion Pilot Sand Engine (in Dutch), Deltares and Imares, report no. 1203519-000-ZKS-0034 C172/10., 2011.
UNDP: Reducing Disaster Risk – A Challenge for Development, New York, USA, available at: http://www.undp.org/content/ undp/en/home/librarypage/crisis-prevention-and-recovery/ reducing-disaster-risk--a-challenge-for-development.html, 2004.
Vandenbohede, A. and Lebbe, L.: Effects of tides on a sloping shore: groundwater dynamics and propagation of the tidal wave, Hydrogeol. J., 15, 645–658, doi:10.1007/s10040-006-0128-y, 2007.
Vandenbohede, A. and Lebbe, L.: Groundwater
chem-istry patterns in the phreatic aquifer of the central
Bel-gian coastal plain, Appl. Geochemistry, 27, 22–36,
doi:10.1016/j.apgeochem.2011.08.012, 2012.
van Koningsveld, M., Mulder, J. P. M., Stive, M. J. F., van der Valk, L., and van der Weck, A. W.: Living with Sea-Level Rise and Climate Change: A Case Study of the Netherlands, J. Coast. Res., 24, 367–379, doi:10.2112/07A-0010.1, 2008.
TNO, report no. NITG 05-038-B, Utrecht, the Netherlands, 2005 (in Dutch).
Vos, P. and de Vries, S.: Second generation of palaeogeographical maps of the Netherlands (version 2.0), Deltares, Utrecht, avail-able at: www.archeologieinnederland.nl (last access: 16 Septem-ber 2014), 2013.
Wahl, T., Haigh, I. D., Woodworth, P. L., Albrecht, F., Dillingh, D., Jensen, J., Nicholls, R. J., Weisse, R., and Wöppelmann, G.: Observed mean sea level changes around the North Sea coastline from 1800 to present, Earth-Science Rev., 124, 51–67, doi:10.1016/j.earscirev.2013.05.003, 2013.
Webb, M. D. and Howard, K. W. F.: Modeling the Transient Re-sponse of Saline Intrusion to Rising Sea-Levels, Ground Water, 49, 560–569, doi:10.1111/j.1745-6584.2010.00758.x, 2011. Wong, P. P., Losada, I. J., Gattuso, J.-P., Hinkel, J., Khattabi, A.,
McInnes, K. L., Saito, Y., and Sallenger, A.: Coastal systems and low-lying areas, in: Climate Change 2014: Impacts, Adaptation, and Vulnerability. Part A: Global and Sectoral Aspects, Contri-bution of Working Group II to the Fifth Assessment Report of the Intergovernmental Panel on Climate Change, 361–409, Cam-bridge University Press, CamCam-bridge, UK and New York, NY, USA, 2014.
Yang, J., Graf, T., Herold, M., and Ptak, T.: Modelling the effects of tides and storm surges on coastal aquifers using a coupled surface–subsurface approach, J. Contam. Hydrol., 149, 61–75, doi:10.1016/j.jconhyd.2013.03.002, 2013.
Yang, J., Graf, T., and Ptak, T.: Sea level rise and storm surge effects in a coastal heterogeneous aquifer: a 2D mod-elling study in northern Germany, Grundwasser, 20, 39–51, doi:10.1007/s00767-014-0279-z, 2015.
Zhang, K., Douglas, B. C., and Leatherman, S. P.: Global Warming and Coastal Erosion, Clim. Change, 64, 41–58, doi:10.1023/B:CLIM.0000024690.32682.48, 2004.


![Figure 13. Thickness of fresh groundwater [m] in reference sce- sce-nario near the Sand Engine from 2011 to 2050.](https://thumb-eu.123doks.com/thumbv2/123dok_br/18383139.356635/11.918.73.444.740.1035/figure-thickness-fresh-groundwater-reference-nario-sand-engine.webp)