Electronic Journal of Plant Breeding, 6(2): 546-549 (June 2015) ISSN 0975-928X
http://ejplantbreeding.com 546
Research Note
Assessment of genetic diversity in safflower germplasm lines (
Carthamus
tinctorius
L.)
SNCVL Pushpavalli*, R. Raja Rajeswari and C. Sudhakar Agricultural Research Station, ANGRAU, Tandur-501 141
Email: pvalli75@yahoo.co.in
(Received: 30 Sep 2014; Accepted: 5 June 2015)
Abstract
Twenty safflower germplasm lines were assessed for genetic divergence for seven characters using Mahalanobis D2 statistic
and principal component analysis. Test weight contributed maximum towards genetic divergence followed by oil content. All the germplasm lines were grouped into seven clusters. Clusters III and II were the best clusters based on seed yield and oil content. The first three principal components explained 83.16% variability. Maximum intercluster distance was observed between cluster IV and VII.
Keywords
Safflower, genetic divergence, Principal Component Analysis, D2 analysis
Safflower (Carthamus tinctorius L.) is a drought tolerant and important oilseed crop grown during rabi rabi season on receding soil moisture. The crop is grown not only for oil but also for extraction of pigment from the flowers which is used for dyeing. Identification and utilization of diverse germplasm is the central issue in plant breeding. More accurate and complete descriptions of elite breeding materials and understanding the patterns of genetic diversity could help determine future breeding strategies and facilitate introgression of diverse germplasm into the current genetic base. Mahalonobis D2 statistic is widely used for analysis of genetic diversity by many researchers in crop plants (Rao, 1952).
Twenty safflower germplasm lines obtained from Directorate of Oilseeds Research, Hyderabad were sown in Random Block Design at Agricultural Research Station, Tandur during rabi 2013-14. The entries were sown in 5m long four row plots with a spacing of 45 cm between the rows and 20 cm between the plants. The recommended agronomic practices have been followed to raise a good crop. Five plants were randomly selected for recording data on the following seven characters viz, days to 50% flowering, days to maturity, number of effective capitula per plant, number of seeds per capitula, test weight (g), seed yield (kg/ha) and oil content (%). Mahalonobis D2 statistic and Principal Component Analysis (PCA) (Jackson, 1991) has been used to analyze genetic divergence among the selected set of safflower gemplasm lines.
The Mahalonobis D2 values have grouped the twenty GMU lines (Table 1) to seven distinct clusters with cluster I comprising of 8 genotypes followed by cluster III with 5 genotypes, cluster II with 3 genotypes while the remaining clusters IV,
V, VI and VII consisted of one genotype each (Table 2). The average intra and inter cluster distances are depicted in (Table 3). The intra D2 values ranged from 0 (cluster IV, V, VI and VII) to 5.74 (cluster III). The maximum inter cluster distance was between cluster V and VII (10.83) followed by cluster III and IV (10.65). Cluster III recorded highest mean values for test weight (5.14g) and seed yield (1044.45kg/ha), cluster II recorded highest oil content of 31.92% while cluster IV had highest number of capitula per plant (35.40) indicating that neighboring clusters had high yielding genotypes (Table 4). The GMUs falling under these categories may be utilized in hybridization program for improvement of seed yield and oil content. Similar results have been reported by earlier researchers (Ghongade and Navale, 1995; Shivani and Sreelakshmi, 2013). Cluster IV recorded earliness for days to 50% flowering and days to maturity in addition to more number of capitula per plant indicating that these genotypes can be utilized for breeding for early duration to escape drought conditions. Contribution of various characters towards divergence was presented in (Table 5). Maximum contribution towards genetic divergence is by test weight (38.95) followed by oil content (27.89) and seed yield (17.89). These characters together recorded for more than 80% of the total divergence in the twenty germplasm lines studied. While earlier studies have reported maximum contribution by seed yield for genetic divergence (Shivani and Sreelakshmi, 2011, 2013). The first three principal components explained 83.16% variability with PC1 explaining maximum variability (44.81%).
Electronic Journal of Plant Breeding, 6(2): 546-549 (June 2015) ISSN 0975-928X
http://ejplantbreeding.com 547
and grouped into different clusters. The genotypes in cluster IV (GMU-3876) have earliness and more number of capitula per plant while in those in cluster VII (GMU-2551) has more number of seeds per capitula. The genotypes in cluster III have high mean seed yield and test weight and the genetic distance between genotypes in cluster III and those in cluster IV, V and VI are 10.65, 10.49 and 10.38 respectively indicating that these genotypes can be utilized in crossing program for the development of early varieties which can escape drought along with high seed yield.
References
Jackson, J. E. 1991. A Users’s guide to Principal
Component. John wiley and Sons, Inc. New York.
Ghongade, R. A. and Navale, D. A. 1995. Genetic divergence in safflower. J. Maharashtra. Agric. Univ., 20: 249-251.
Rao, C. R. 1952. Advanced statistical methods in biometrical research. John wiley and Sons, Inc. New York.
Shivani, D., Sreelakshmi, Ch. and Sameer Kumar, C.V. 2011. Canonical variate analysis in safflower (Carthamus tinctorius L.). Electron. J. Plant Breed., 2(4): 563-567.
Electronic Journal of Plant Breeding, 6(2): 546-549 (June 2015) ISSN 0975-928X
http://ejplantbreeding.com 548
Table 1. Safflower genotypes used in the present study
S. No Genotype
1 GMU-3876
2 PBNS-12
3 GMU-3856
4 GMU-3816
5 A1
6 MANJEERA 7 GMU-3796
8 GMU-3781
9 GMU-3719
10 GMU-3716
11 GMU-3708
12 GMU-3663
13 GMU-2366
14 GMU-3924
15 GMU-3963
16 GMU-2551
17 GMU-3638
18 GMU-3923
19 GMU-3438
20 GMU-3971
Table 2. Clustering of twenty safflower genotypes
Cluster No. No. of Genotypes Name of the Genotype
I 8 PBNS-12, GMU-2366, GMU-3856, GMU-3663,
GMU-3638, GMU-3923, A1, GMU-3716
II 3 GMU-3781, GMU-3924, GMU-3796
III 5 GMU-3719, GMU-3963, GMU-3438, GMU-3971,
MANJEERA
IV 1 GMU-3876
V 1 GMU-3708
VI 1 GMU-3816
VII 1 GMU-2551
Table 3. Average Inter and intra cluster distances (D2) of seven clusters in safflower germplasm
I II III IV V VI VII I 4.56 6.24 7.31 6.25 5.97 6.89 8.01 II 3.94 9.08 6.54 8.51 7.00 6.03 III 5.74 10.65 10.49 10.38 7.52 IV 0.00 4.76 7.03 9.09
V 0.00 5.68 10.83
VI 0.00 8.26
Electronic Journal of Plant Breeding, 6(2): 546-549 (June 2015) ISSN 0975-928X
http://ejplantbreeding.com 549
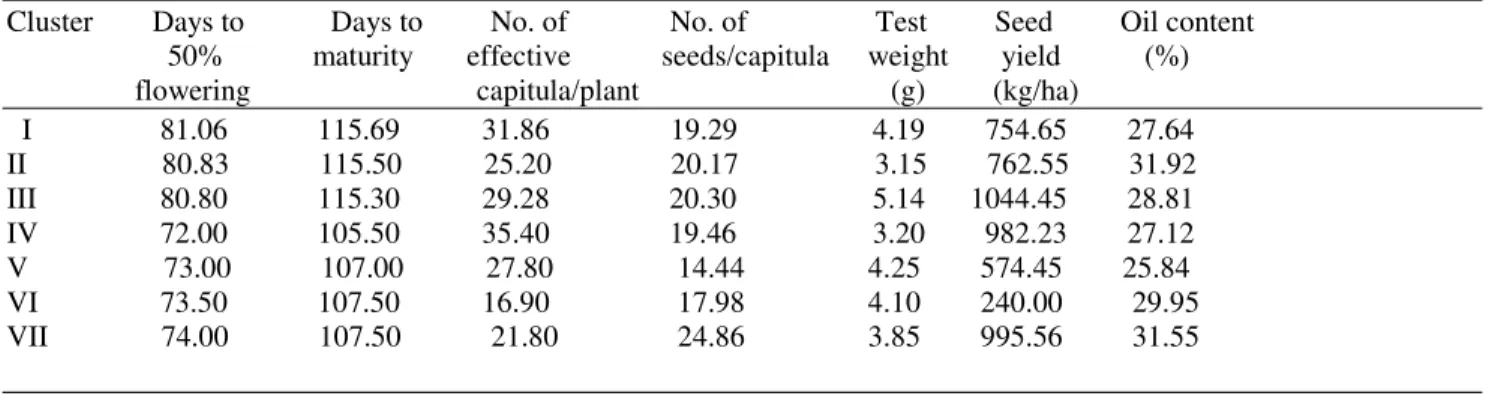
Table 4. Cluster means of seven clusters for seven characters in safflower germplasm
Cluster Days to Days to No. of No. of Test Seed Oil content 50% maturity effective seeds/capitula weight yield (%) flowering capitula/plant (g) (kg/ha)
I 81.06 115.69 31.86 19.29 4.19 754.65 27.64 II 80.83 115.50 25.20 20.17 3.15 762.55 31.92 III 80.80 115.30 29.28 20.30 5.14 1044.45 28.81 IV 72.00 105.50 35.40 19.46 3.20 982.23 27.12 V 73.00 107.00 27.80 14.44 4.25 574.45 25.84 VI 73.50 107.50 16.90 17.98 4.10 240.00 29.95 VII 74.00 107.50 21.80 24.86 3.85 995.56 31.55
Table 5. Percent contribution of different characters towards genetic divergence in safflower Character % contribution Times ranked first
Days to 50% Flowering 7.37 14
Days to Maturity 0.00 0
No. of Effective Capitula/Plant 0.53 1
No. of Seeds/Capitulum 6.32 12
Test Wight (g) 38.95 74
Seed Yield (Kg/ha) 17.89 34
Oil Content (%) 27.89 53
Table 6. Eigen values and proportion of total variance represented by three principal components of safflower gemplasm germplasm
PC1 PC2 PC3
Eigen Value (root) 216.71 126.54 58.98
Percent Var. Exp 44.81 26.16 12.19 Cumulative Var. Exp 44.81 70.98 83.17 Days to 50% Flowering 0.10 0.03 0.63
Days to Maturity 0.01 0.01 0.10
No. of Effective Capitula/Plant 0.001 0.10 0.15 No. of Seeds/Capitulum 0.07 -0.20 -0.49
Test Wight (g) 0.73 0.60 -0.26
Seed Yield (Kg/ha) 0.47 -0.19 0.39
Oil Content (%) 0.46 -0.70 -0.10