Genetic variability in common wheat germplasm based on coefficients of
parentage
Fernanda Bered
1, José F. Barbosa-Neto
2and Fernando I.F. de Carvalho
3 1Departamento de Genética, Instituto de Biociências, UFRGS. Porto Alegre, RS, Brazil.
2
Departamento de Plantas de Lavoura, Faculdade de Agronomia, UFRGS. Porto Alegre, RS, Brazil.
3
Departamento de Fitotecnia, Faculdade de Agronomia “Eliseu Maciel”, Pelotas, RS, Brazil.
Abstract
The characterization of genetic variability and an estimate of the genetic relationship among varieties are essential to any breeding program, because artificial crosses among less similar parents allow a larger segregation and the combination of different favorable alleles. Genetic variability can be evaluated in different ways, including the Coefficient of Parentage (COP), which estimates the probability of two alleles in two different individuals being identical by descent. In this study, we evaluated the degree of genetic relationship among 53 wheat genotypes, and identified the ancestor genotypes which contributed the most to the current wheat germplasm, as a prediction of the width of the genetic base of this cereal. The results revealed a mean COP of 0.07 and the formation of 22 similarity groups. The ancestor genotypes Ciano 67 and Mentana were those which contributed the most to the current wheat germplasm. According to the COP analyses, the genetic base of wheat rests on a small number of ancestral genotypes.
Key words:COP, genetic base, gene pool,Triticum aestivumL.
Received: January 27, 2000; accepted: April 26, 2002.
Introduction
Genetic variability is required to achieve genetic gains in a breeding program. Estimation of genetic variability among genotypes can be based on qualitative and quantita-tive traits (Spagnoletti-Zeuli and Qualset, 1987; Souza and Sorrells, 1991; van Beuningen and Busch, 1997b), molecu-lar markers (Smith and Smith, 1988; Barbosa-Netoet al., 1996; Caoet al., 1998; Fahimaet al., 1999), and coefficient of parentage (Martin et al., 1991; Barbosa-Neto et al., 1996; Mercadoet al., 1996; van Beuningen and Busch, 1997a; Burkhameret al., 1998). The coefficient of parent-age (COP) measures the probability that alleles of two indi-viduals are identical by descent, and has been used extensively to indirectly assess variability within gene pools (Burkhameret al., 1998). A pair of individuals with a high COP probably share a greater number of identical al-leles. A cross between them will probably produce a F2
gen-eration with a reduced number of allelic combinations, and will be expected to show reduced variability in segregating generations (Beeret al., 1995). COP analysis can be ap-plied to an estimation of genetic diversity among cultivars
and parental germplasm, predicting breeding behavior of the progeny of crosses, summarizing regional crop diver-sity, identifying parents that have contributed to yield im-provements, and searching trends in genetic diversity over time and space (Kim and Ward, 1997; Souzaet al., 1998).
Estimation of genetic variability by means of COP re-quires detailed pedigree data. Once pedigrees are known, the coefficient of parentage may be used as an estimate of genetic similarity (Coxet al., 1985). In this way, COP can be used as an index of relationship. COP values range from zero, where cultivars are completely unrelated, to one, where two cultivars have all alleles in common (Martinet al., 1991). The use of a COP data matrix can cluster genotypes and produce genealog-ically similar groups. These groups can be used to maximize heterozygosity in the progeny of crosses and to predict he-terosis (Barbosa-Netoet al., 1996; Souzaet al., 1998).
The objective of this work was to examine the genetic variability of wheat germplasm used in genetic improve-ment programs in the south of Brazil. We also wished to evaluate the degree of genetic relationship among geno-types, so as to predict the extent of the genetic base of wheat. Finally, we also identified the ancestral genotypes that contributed most to the genetic pool of Brazilian wheat. The aim of this approach was to place genotypes into groups of genetic similarity, to aid the amplification of ge-netic variation in artificial crosses.
Materials and Methods
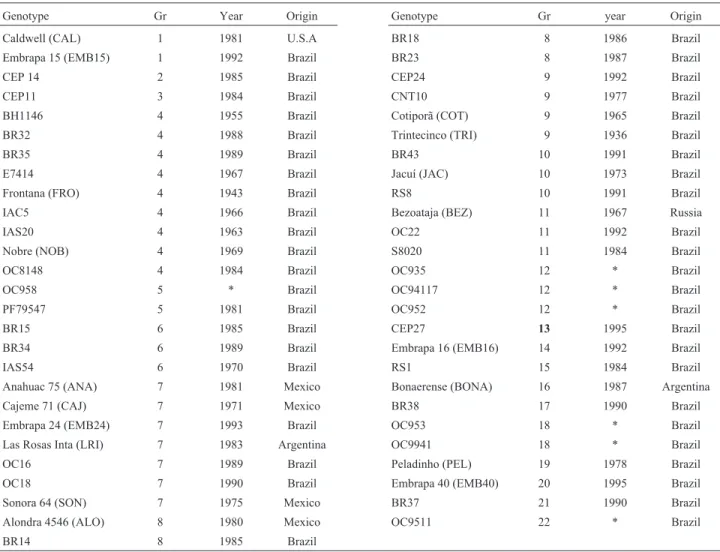
Fifty-three wheat genotypes, classified by commer-cial release year, were included in this study (Table I). The sample included inbred lines and cultivars from different origins, chosen based on their importance, either commer-cial or as parents. Pedigrees were obtained from Zeven and Zeven-Hissink (1976), Zeven and Reiner (1991), Graingenes Database, and additional information was pro-vided by wheat breeders. The pedigree of a genotype was traced back to its ancestors’ parents or landraces. Coeffi-cients of parentage (COP) were computed for all pairwise combinations of genotypes from pedigree information, ac-cording to Barbosa-Netoet al.(1996). In using this method, it was assumed that: 1) an inbred plant received half its genes from each parent; 2) parents used in crosses were ho-mozygous and homogeneous; 3) ancestors for which no pedigree information was available were unrelated (COP = 0.00);4) the COP value between a cultivar and a selection from that cultivar was 0.75. The genotypes were included in a relationship matrix and were grouped using the
Un-weighted Pair Group Method of clustering (NT-SYS soft-ware for PC). The groups were generated starting from the value 0.125 (grandparent / grandchild relationship). Mean COP values within and between clusters were computed, after deleting clusters with a single entry. The ancestors’ parents were chosen based on literature and information obtained from wheat breeders, and the contribution to wheat germplasm was computed considering the frequency of genotypes with COP above 0.125 (ancestors x geno-type).
Results and Discussion
The mean COP for all genotypes analyzed was 0.07, ranging from 0 to 0.82 (BR35 x IAC5), a value close to that obtained for wheat by Barbosa-Netoet al.(1996) . Similar studies have shown a mean COP around 0.20 (Autriqueet al., 1996; Kim and Ward, 1997; Souzaet al., 1998). The violation of COP assumptions results in an underestimation of the true values. The assumption that genotypes without pedigree information were unrelated (COP = 0.00)
contrib-Table I- Group (Gr), year of release and origin of evaluated hexaploid wheat.
Genotype Gr Year Origin Genotype Gr year Origin
Caldwell (CAL) 1 1981 U.S.A BR18 8 1986 Brazil
Embrapa 15 (EMB15) 1 1992 Brazil BR23 8 1987 Brazil
CEP 14 2 1985 Brazil CEP24 9 1992 Brazil
CEP11 3 1984 Brazil CNT10 9 1977 Brazil
BH1146 4 1955 Brazil Cotiporã (COT) 9 1965 Brazil
BR32 4 1988 Brazil Trintecinco (TRI) 9 1936 Brazil
BR35 4 1989 Brazil BR43 10 1991 Brazil
E7414 4 1967 Brazil Jacuí (JAC) 10 1973 Brazil
Frontana (FRO) 4 1943 Brazil RS8 10 1991 Brazil
IAC5 4 1966 Brazil Bezoataja (BEZ) 11 1967 Russia
IAS20 4 1963 Brazil OC22 11 1992 Brazil
Nobre (NOB) 4 1969 Brazil S8020 11 1984 Brazil
OC8148 4 1984 Brazil OC935 12 * Brazil
OC958 5 * Brazil OC94117 12 * Brazil
PF79547 5 1981 Brazil OC952 12 * Brazil
BR15 6 1985 Brazil CEP27 13 1995 Brazil
BR34 6 1989 Brazil Embrapa 16 (EMB16) 14 1992 Brazil
IAS54 6 1970 Brazil RS1 15 1984 Brazil
Anahuac 75 (ANA) 7 1981 Mexico Bonaerense (BONA) 16 1987 Argentina
Cajeme 71 (CAJ) 7 1971 Mexico BR38 17 1990 Brazil
Embrapa 24 (EMB24) 7 1993 Brazil OC953 18 * Brazil
Las Rosas Inta (LRI) 7 1983 Argentina OC9941 18 * Brazil
OC16 7 1989 Brazil Peladinho (PEL) 19 1978 Brazil
OC18 7 1990 Brazil Embrapa 40 (EMB40) 20 1995 Brazil
Sonora 64 (SON) 7 1975 Mexico BR37 21 1990 Brazil
Alondra 4546 (ALO) 8 1980 Mexico OC9511 22 * Brazil
BR14 8 1985 Brazil
uted to the low value of the mean COP, since there were several genotypes with no pedigree information. A specific example was reported by Souzaet al.(1998), showing that spring wheat cultivars with the least documented pedigrees had low similarity to other clusters. The contribution of de-viation from these assumptions may vary between crosses, but should be more significant, as individuals become more related (Burkhamer et al., 1998). According to van Beuningen and Busch (1997a), variability may be underes-timated, because the cultivars were assumed to be homoge-neous and homozygous, and the ancestors were not pure lines.
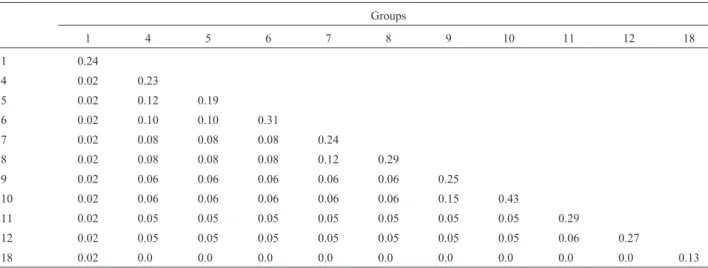
Cluster analysis revealed 22 groups of related geno-types (Table I), constituting half of only one genotype and half of at least two genotypes. The groups with more than one genotype were used to estimate the mean COP within and between groups (Table II). As expected, the results showed the COP to be high within the same groups (mean =
0.26) and low among the groups (mean = 0.05). Group 10 (BR43, Jacuí and RS8) had the highest mean COP (0.43), re-vealing a strong relationship among these varieties. Groups 9 and 10 were the most closely related ones (COP = 0.15).
The ancestors’ contribution analysis (Table III) re-vealed that the one that contributed most to the wheat gene pool (34%) was the ancestor Ciano 67, followed by Mentana (32%). These two cultivars may have had signifi-cant general combining ability, and may have expressed genes that contributed to wheat stability and adaptability. On the other hand, ancestors Turkey, Mediterranean, Norin 10 and Siete Cerros were only included in the gene pool since 1970. Before 1970, genotypes Red Egyptian and Alfredo Chaves 6 had greater importance. According to Martinet al.(1991), regional gene pools are often based on a limited number of original ancestors, these original ances-tors remaining the core of the present germplasm base. Moreover, breeders have favored either backcrossing or
Table III- Ancestral parents of wheat germplasm: mean coefficient of parentage (COP) and percentage of contribution from two periods.
Ancestral Origin Mean
COP
Total contribution (%)
Contribution 1930-1970 (%)
Contribution 1971-1999 (%)
Turkey Ukraine 0.05 6 0 6
Mediterranean U.S.A 0.03 4 0 4
Steinwedel S.Africa 0.009 0 0 0
Red Egyptian Africa 0.02 4 4 0
Alfredo Chaves 6 Brazil 0.03 6 4 0
Polyssu Brazil 0.06 11 7 4
Kenya 58 Kenya 0.04 11 7 4
Norin 10 Japan 0.04 8 0 8
Mentana Italy 0.09 32 13 19
Siete Cerros Mexico 0.06 9 0 9
Ciano 67 Mexico 0.12 34 6 28
Colonias Brazil 0.05 14 7 7
Combate Brazil 0.05 13 11 2
Table II- Mean coefficient of parentage (COP) within (on diagonal) and between (below diagonal) genotype groups.
Groups
1 4 5 6 7 8 9 10 11 12 18
1 0.24
4 0.02 0.23
5 0.02 0.12 0.19
6 0.02 0.10 0.10 0.31
7 0.02 0.08 0.08 0.08 0.24
8 0.02 0.08 0.08 0.08 0.12 0.29
9 0.02 0.06 0.06 0.06 0.06 0.06 0.25
10 0.02 0.06 0.06 0.06 0.06 0.06 0.15 0.43
11 0.02 0.05 0.05 0.05 0.05 0.05 0.05 0.05 0.29
12 0.02 0.05 0.05 0.05 0.05 0.05 0.05 0.05 0.06 0.27
repeated cycles of mating to adapted germplasm for the in-troduction of new germplasm into wheat gene pool (Mercadoet al., 1996).
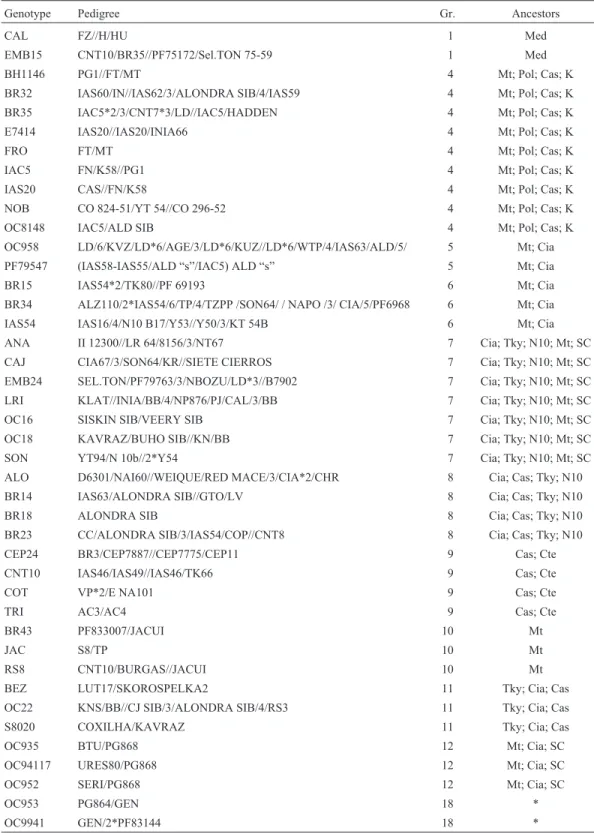
Analyzing the pedigrees and COP of each group, it can be seen that groups can be determined for some ances-tors (Table IV). The fact that only a few representative
an-Table IV- Pedigrees and groups of hexaploid wheat genotypes evaluated.
Genotype Pedigree Gr. Ancestors
CAL FZ//H/HU 1 Med
EMB15 CNT10/BR35//PF75172/Sel.TON 75-59 1 Med
BH1146 PG1//FT/MT 4 Mt; Pol; Cas; K
BR32 IAS60/IN//IAS62/3/ALONDRA SIB/4/IAS59 4 Mt; Pol; Cas; K
BR35 IAC5*2/3/CNT7*3/LD//IAC5/HADDEN 4 Mt; Pol; Cas; K
E7414 IAS20//IAS20/INIA66 4 Mt; Pol; Cas; K
FRO FT/MT 4 Mt; Pol; Cas; K
IAC5 FN/K58//PG1 4 Mt; Pol; Cas; K
IAS20 CAS//FN/K58 4 Mt; Pol; Cas; K
NOB CO 824-51/YT 54//CO 296-52 4 Mt; Pol; Cas; K
OC8148 IAC5/ALD SIB 4 Mt; Pol; Cas; K
OC958 LD/6/KVZ/LD*6/AGE/3/LD*6/KUZ//LD*6/WTP/4/IAS63/ALD/5/ 5 Mt; Cia
PF79547 (IAS58-IAS55/ALD “s”/IAC5) ALD “s” 5 Mt; Cia
BR15 IAS54*2/TK80//PF 69193 6 Mt; Cia
BR34 ALZ110/2*IAS54/6/TP/4/TZPP /SON64/ / NAPO /3/ CIA/5/PF6968 6 Mt; Cia
IAS54 IAS16/4/N10 B17/Y53//Y50/3/KT 54B 6 Mt; Cia
ANA II 12300//LR 64/8156/3/NT67 7 Cia; Tky; N10; Mt; SC
CAJ CIA67/3/SON64/KR//SIETE CIERROS 7 Cia; Tky; N10; Mt; SC
EMB24 SEL.TON/PF79763/3/NBOZU/LD*3//B7902 7 Cia; Tky; N10; Mt; SC
LRI KLAT//INIA/BB/4/NP876/PJ/CAL/3/BB 7 Cia; Tky; N10; Mt; SC
OC16 SISKIN SIB/VEERY SIB 7 Cia; Tky; N10; Mt; SC
OC18 KAVRAZ/BUHO SIB//KN/BB 7 Cia; Tky; N10; Mt; SC
SON YT94/N 10b//2*Y54 7 Cia; Tky; N10; Mt; SC
ALO D6301/NAI60//WEIQUE/RED MACE/3/CIA*2/CHR 8 Cia; Cas; Tky; N10
BR14 IAS63/ALONDRA SIB//GTO/LV 8 Cia; Cas; Tky; N10
BR18 ALONDRA SIB 8 Cia; Cas; Tky; N10
BR23 CC/ALONDRA SIB/3/IAS54/COP//CNT8 8 Cia; Cas; Tky; N10
CEP24 BR3/CEP7887//CEP7775/CEP11 9 Cas; Cte
CNT10 IAS46/IAS49//IAS46/TK66 9 Cas; Cte
COT VP*2/E NA101 9 Cas; Cte
TRI AC3/AC4 9 Cas; Cte
BR43 PF833007/JACUI 10 Mt
JAC S8/TP 10 Mt
RS8 CNT10/BURGAS//JACUI 10 Mt
BEZ LUT17/SKOROSPELKA2 11 Tky; Cia; Cas
OC22 KNS/BB//CJ SIB/3/ALONDRA SIB/4/RS3 11 Tky; Cia; Cas
S8020 COXILHA/KAVRAZ 11 Tky; Cia; Cas
OC935 BTU/PG868 12 Mt; Cia; SC
OC94117 URES80/PG868 12 Mt; Cia; SC
OC952 SERI/PG868 12 Mt; Cia; SC
OC953 PG864/GEN 18 *
OC9941 GEN/2*PF83144 18 *
* - There were no representative ancestors of this group.
cestors of the groups were observed suggests again that this set of wheat germplasm reflects a narrow genetic base.
Comparing wheats from USA, Canada and Mexico, based on average COP, those from Mexico were more di-verse than those from breeding programs in the USA and Canada (van Beuningen and Busch, 1997a). Despite the relatively low genetic similarity estimates based on COP in our work, we concluded that Brazilian germplasm was de-veloped from a narrow genetic background, as revealed by the small number of ancestors investigated.
Conclusions
Genetic variability was detected among the geno-types evaluated. Based on the examined samples, Ciano 67 and Mentana were the most important genotypes in the con-stitution of the current wheat germplasm. Moreover, the ge-netic base of wheat germplasm is constituted by a restricted number of ancestor genotypes. Coefficient of Parentage (COP) analysis was effective in evaluating the variability and genetic base of wheat.
References
Autrique E, Nachit MM, Monneveux P, Tanksley SD and Sorrells ME (1996) Genetic diversity in Durum Wheat based on RFLPs, morphophysiological traits, and coefficient of par-entage. Crop Sci. 36:735-742.
Barbosa-Neto JF, Sorrells ME and Cisar G (1996) Prediction of heterosis in wheat using coefficient of parentage and RFLP-based estimates of genetic relationship. Genome. 39:1142-1149.
Beer SC, Souza E and Sorrells ME (1995) Prediction of genotype performance from ancestors relationship in oat. Crop Sci. 35:69-73.
Burkhamer RL, Lanning SP, Martens RJ, Martin JM and Talbert LE (1998) Predicting progeny variance from parental diver-gence in Hard Red Spring wheat. Crop Sci. 38:243-248. Cao W, Hucl P, Scoles G and Chibbar RN (1998) Genetic
diver-sity within spelta and macha wheats based on RAPD analy-sis. Euphytica. 104: 181-189.
Cox TS, Kiang YT, Gorman MB and Rodgers DM (1985) Rela-tionship between coefficient of parentage and genetic simi-larity indices in the soybean. Crop Sci. 25:529-532. Fahima T, Sun GL, Beharav A, Krugman T, Beiles A and Nevo E
(1999) RAPD polymorphism of wild emmer wheat popula-tions, Triticum dicoccoides, in Israel. Theor. Appl. Gen. 98:434-447.
Kim HS and Ward RW (1997) Genetic diversity in Eastern U.S. soft winter wheat (Triticum aestivumL. em. Thell.) based on RFLPs and coefficient of parentage. Theor. Appl. Genet. 94:472-479.
Martin JM, Blake TK and Hockett EA (1991) Diversity among North American Spring Barley cultivars based on coeffi-cient of parentage. Crop. Sci. 31:1131-1137.
Mercado LA, Souza E and Kephart KD (1996) Origin and diver-sity of North American hard spring wheats. Theor. Appl. Genet. 93:593-599.
Smith JSC and Smith OS (1988) Associations among inbred lines of maize using electrophoretic, chromatographic, and pedi-gree data. Theor. Appl. Genet. 76:39-44.
Souza E and Sorrells ME (1991) Relationships among 70 North American oat germplasms: I. Cluster analysis using quanti-tative characters. Crop Sci. 31:599-605.
Souza E, Fox PN and Skovmand B (1998) Parentage analysis of International Spring Wheat Yield Nurseries 17 to 27. Crop Sci. 38:337-341.
Spagnoletti-Zeuli PLS and Qualset CO (1987) Geographical di-versity for quantitative spike characters in a world collection of durum wheat. Crop Sci. 27:235-241.
Van Beuningen LT and Busch RH (1997a) Genetic diversity among North American spring wheat cultivars: I. Analysis of the coefficient of parentage matrix.Crop Sci.37:570-579. Van Beuningen LT and Busch RH (1997b) Genetic diversity among North American spring wheat cultivars: III. Cluster analysis based on quantitative morphological traits. Crop Sci.37:981-988.
Zeven A and Reiner L (1991) Genealogies of 3200 wheat variet-ies. Institute of Plant Breeding-I.v.P., Agricultural Univer-sity. Wageningen, The Netherlands. Crop Husbandry, Technical University Munich, Germany. 79 pp.