J. Evolution Med. Dent. Sci./eISSN- 2278-4802, pISSN- 2278-4748/ Vol. 5/ Issue 58/ July 21, 2016 Page 4017
DISTRIBUTION OF ABO AND RH-D BLOOD GROUPS IN THE CACHAR DISTRICT OF BARAK VALLEY OF
ASSAM: IMPLICATION FOR REGIONAL BLOOD TRANSFUSION SERVICE
Dharmakanta Kumbhakar1
1Associate Professor, Department of Pathology, Tezpur Medical College and Hospital, Tezpur, Assam.
ABSTRACT
BACKGROUND
ABO and Rhesus (Rh)-D blood group antigens are integrated parts of the red blood cell membranes. They are hereditary characters and are useful in population genetic studies, in resolving medico-legal issues and more importantly in compatibility test in blood transfusion and organ transplant practices. They show a wide geographical and racial variation. The knowledge of the distribution of ABO and Rh-D blood groups among different population is essential in health care and transfusion practices.
AIMS AND OBJECTIVES
To study the distribution of ABO and Rh-D blood groups amongst the population of Cachar district of Barak valley of Assam.
MATERIALS AND METHODS
We did a retrospective analysis of records of 1,60,500 blood samples grouped for ABO and Rh-D typing at Silchar Medical College and Hospital Blood Bank, Silchar, over a period of 10 years from 1st January 1999 to 31st December 2008.
RESULTS AND OBSERVATIONS
Out of total 1,60,500 blood samples grouped for ABO and Rh-D typing during the period in the centre, the distribution of phenotype A, B, AB and O were 24.80% (39,804), 32.00% (51,360), 5.60% (8,986) and 37.60% (60,350) respectively. The Rh-D positive phenotype was 95.40% (1, 53,117) and remaining 4.60% (7,383) was Rh-D negative. The frequency of Rh-D phenotypes in the various ABO blood groups was as - A Positive 23.70% (38,039), A Negative 1.10% (1,765), B Positive 30.80% (49,433), B Negative 1.20% (1,927), AB Positive 5.40% (8,665), AB Negative 0.20% (321), O Positive 35.50% (56,980) and O Negative 2.10% (3,370) respectively.
DISCUSSION
Silchar Medical College and Hospital Blood Bank receives blood samples for grouping of almost all population of Cachar district. Hence, the data revealed in the present study fairly reflects the prevalence of ABO and Rh-D groups distribution in the Cachar district in Barak valley of Assam.
CONCLUSION
The present study provide information on the status of ABO and Rh-D blood groups distribution of the region and the knowledge of it will help in effective management of regional blood transfusion service of the area.
KEYWORDS
Blood Group, ABO and Rhesus-D, Hereditary, Phenotype, Blood Transfusion, Health Care.
HOW TO CITE THIS ARTICLE: Kumbhakar D. Distribution of ABO and Rh-D blood groups in the Cachar district of Barak Valley of Assam: Implication for regional blood transfusion service. J. Evolution Med. Dent. Sci. 2016;5(58):4017-4021, DOI: 10.14260/jemds/2016/919
INTRODUCTION
Blood group antigens are integrated parts of the red blood cell membranes.[1,2] Despite the long list of several other
blood groups discovered so far, the ABO and Rh-D blood groups hold a respectable position in view of safety of blood/blood products transfusion, more importantly in compatibility test in blood transfusion and organ transplant to date.[3,4] The knowledge of the distribution of ABO and
Rh-D blood groups is essential for effective management of blood bank inventory, being it a smaller local transfusion service or a regional or national transfusion service.
Financial or Other, Competing Interest: None. Submission 13-06-2016, Peer Review 07-07-2016, Acceptance 13-07-2016, Published 20-07-2016. Corresponding Author:
Dr. Dharmakanta Kumbhakar,
Married Doctor’s Flat C-3,
Gauhati Medical College and Hospital Campus, P.O. Indrapur, Ghy-32, Kamrup (Metro), Assam. E-mail: [email protected] DOI: 10.14260/jemds/2016/919
ABO and Rh-D blood group antigens are genetically determined.[5,6] They are the most frequently studied genetic
markers in a large group of population.[7] ABO and Rh gene
and phenotypes vary widely across geographical boundaries despite the fact that the antigens involved are stable throughout the life.[8] A racial difference in the distribution of
these blood groups has been noted by some researchers. Apart from their importance in blood transfusion practice, the ABO and Rh-D blood group antigens are useful in population genetic studies, researching population migration patterns, evaluating the probability of haemolytic disease in the new born as well as resolving certain medico-legal issues, particularly disputes in paternity/maternity and for forensic purposes.[9] It is, therefore, imperative to have information on
the distribution of these blood groups in any population.[10]
J. Evolution Med. Dent. Sci./eISSN- 2278-4802, pISSN- 2278-4748/ Vol. 5/ Issue 58/ July 21, 2016 Page 4018
The population structure of Cachar district with over 10 lacks people, mainly comprises of Bengali, Assamese, Manipuri and Bodos. The Silchar Medical College and Hospital Blood Bank, Silchar, occupies an important place in the health sector of Cachar district of Barak valley of Assam. This blood bank receives blood samples for grouping from almost all population of Cachar district being blood donors, blood recipients, patients admitted and attended for treatment, routine antenatal care as well as for routine medical examinations of Silchar Medical College Hospital and other government and private health establishments. Thus the Silchar Medical College and Hospital Blood Bank does and keeps records of blood groups of these all. Hence, we did a retrospective analysis of records of ABO grouping and Rh-D typing of the blood donors, transfusion recipients and patients attending antenatal care or some other medical interventions at Silchar Medical College and Hospital Blood Bank, Silchar, over a period of 10 years from 1st January 1999
to 31st December 2008. This study seeks to provide data on
ABO and Rh-D groups distribution in the Cachar district in Barak valley of Assam. The collation of immuno-haematology data would therefore enhance sustainable regional blood bank services in the region of Cachar district.
MATERIALS AND METHODS
Records of ABO and Rh-D blood groupings of blood donors, transfusion recipients and patients attending routine antenatal care as well as individuals who presented for
routine medical examination at Silchar Medical College and Hospital Blood Bank, Silchar between 1st January 1999 and
31st December 2008 (10 years) were examined and a care
was exercised to eliminate any repeated entry. All entries were double checked by the author.
ABO and Rh-D blood groupings were carried out in our blood bank between 1st January 1999 and 30th June 2003 by
standard tiles technique with appropriate positive and negative controls using one drop of whole blood mixed with one drop of appropriate anti-sera and rocked gently and read for agglutination under microscope after 30 minutes. In case of doubt, the results were confirmed by reverse grouping using known Group A and B red blood cells.[2,11]
From 1st July 2003 to 31st December 2008, ABO and Rh-D
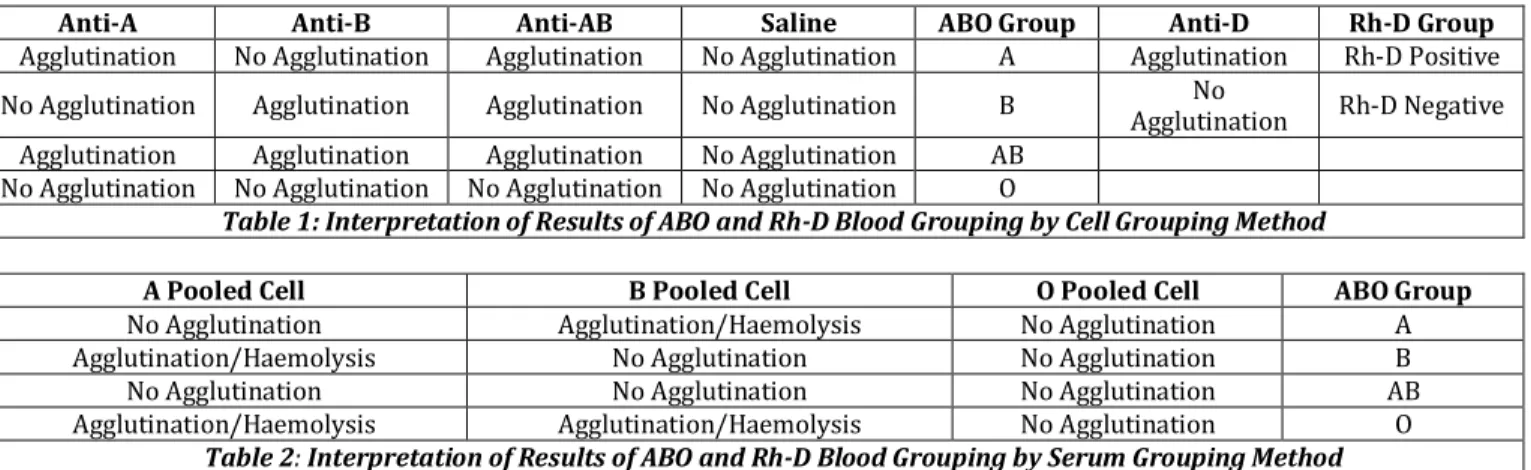
blood groupings were carried out in our blood bank by tube sedimentation method. Both cell and serum grouping were carried out for the entire samples with appropriate positive and negative controls. For cell grouping (Table 1), one drop of 5% three times washed cell suspension was mixed with one drop of appropriate anti-sera, mixed well and read for agglutination after 30 minutes keeping the tubes at 37 degrees centigrade in incubator.[2,11] In case of doubt, the test
was examined under microscope. Results were confirmed by reverse (Serum) grouping (Table 2) using known Group A and B red blood cells.[2,11] Data on the frequency of ABO and Rh-D
blood groups were reported in simple numbers and percentage.
Anti-A Anti-B Anti-AB Saline ABO Group Anti-D Rh-D Group
Agglutination No Agglutination Agglutination No Agglutination A Agglutination Rh-D Positive
No Agglutination Agglutination Agglutination No Agglutination B No
Agglutination Rh-D Negative Agglutination Agglutination Agglutination No Agglutination AB
No Agglutination No Agglutination No Agglutination No Agglutination O
Table 1: Interpretation of Results of ABO and Rh-D Blood Grouping by Cell Grouping Method
A Pooled Cell B Pooled Cell O Pooled Cell ABO Group
No Agglutination Agglutination/Haemolysis No Agglutination A
Agglutination/Haemolysis No Agglutination No Agglutination B
No Agglutination No Agglutination No Agglutination AB
Agglutination/Haemolysis Agglutination/Haemolysis No Agglutination O
Table 2: Interpretation of Results of ABO and Rh-D Blood Grouping by Serum Grouping Method
RESULTS AND OBSERVATIONS
During the period of 10 years between 1st January 1999 and
31st January 2008, a total of 1,60,500 blood samples were
collected in Silchar Medical College and Hospital Blood Bank for ABO and Rh-D grouping.
Sources of Blood Samples Numbers Percentage
Blood Donor 71,525 44.56%
Transfusion Recipient 50,110 31.22%
Antenatal case 31,025 19.33%
Routine Medical case 7,840 4.89%
Total 1,60,500 100.00%
Table 3: Different Sources of Samples for ABO and Rh-D Grouping
Table 3 shows that out of total 1,60,500 samples 71,525 (44.56%) were from blood donors; 50,110 (31.22%) were from transfusion recipients; 31,025 (19.33%) were from
antenatal cases and 7,840 (4.89%) were from routine medical samplings. Figure 1 shows the numbers and Figure 2 shows the percentage of different sources of samples for ABO and Rh-D grouping.
J. Evolution Med. Dent. Sci./eISSN- 2278-4802, pISSN- 2278-4748/ Vol. 5/ Issue 58/ July 21, 2016 Page 4019
Fig. 2: Diagram showing Different Sources of Samples for ABO and Rh-D Grouping (Percentage)
Blood Samples ABO Blood Group Phenotypes Rh-D Phenotype Group-A Group-B Group-AB Group-O Rh-D Positive Rh-D Negative
Number 39,804 51,360 8,986 60,350 1,53,117 7383
Percentage 24.80% 32.00% 5.60% 37.60% 95.40% 4.60%
Table 4: The Frequency of Blood Groups ABO and Rh-D Phenotypes in the Population Sample Studied
Table 4 shows the distribution of various ABO and Rh-D phenotypes among the sample studied. The frequency of Group O phenotype was the most prevalent at 37.60% (60,350) followed by B at 32.00% (51,360), A at 24.80% (39,804) and AB at 5.60% (8,986). Rh-D antigen was detected in 1,53,117 (95.40%) samples, while Rh-D negative phenotype was found in 7,383 (4.60%) samples in the total sample size of 1,60,500. Figure 3 shows the numbers of different ABO and Rh-D phenotypes among the sample studied. Figure 4 shows the percentage of different ABO Group and Figure 5 shows percentage of Rh-D phenotypes in the study sample.
Fig. 3: Diagram showing Numbers of Different ABO Blood Group and in Rh-D Phenotypes the Study Group
Fig. 4: Diagram showing Percentage of Different ABO Blood Group in the Study Group
Fig. 5: Diagram showing Percentage of Different Rh-D Grouping
Blood Samples A Pos. A Neg. B Pos. B Neg. AB Pos. AB Neg. O Pos. O Neg. Total
Numbers 38,039 1,765 49,433 1,927 8,665 321 56,980 3,370 1,60,500
Percentage 23.70% 1.10% 30.80% 1.20% 5.40% 0.20% 35.50% 2.10% 100%
Table 5: The Frequency of Rh-D Phenotypes in the Various ABO Blood Groups of the Different Population Sample
Table 5 shows the frequency of Rh-D Phenotypes among the samples studied with respect to ABO blood groups. Rh-D positivity to blood Group O, A, B, AB were found in the study as 56,980 (35.50%), 38,039 (23.70%), 49,433 (30.80%) and 8,665 (5.40%) respectively. Rh-D negativity to blood Group O,
A, B, AB were found in the study as 3,370 (2.10%), 1,765 (1.10%), 1,927 (1.20%) and 321 (0.20%) respectively. Figure 6 shows the numbers and Figure 7 shows the percentage of samples showing Rh-D typing amongst different ABO groups.
Fig. 6: Diagram showing Numbers of Samples showing
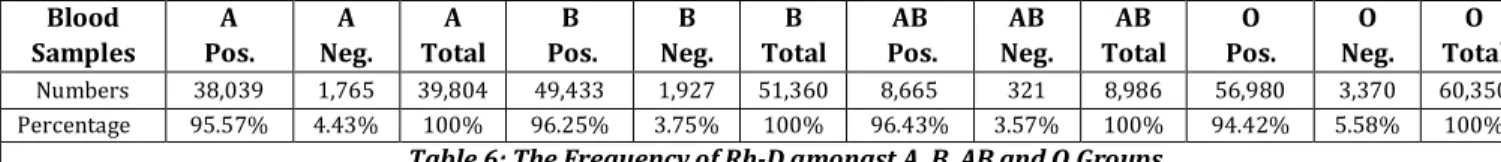
J. Evolution Med. Dent. Sci./eISSN- 2278-4802, pISSN- 2278-4748/ Vol. 5/ Issue 58/ July 21, 2016 Page 4020 Blood Samples A Pos. A Neg. A Total B Pos. B Neg. B Total AB Pos. AB Neg. AB Total O Pos. O Neg. O Total
Numbers 38,039 1,765 39,804 49,433 1,927 51,360 8,665 321 8,986 56,980 3,370 60,350 Percentage 95.57% 4.43% 100% 96.25% 3.75% 100% 96.43% 3.57% 100% 94.42% 5.58% 100%
Table 6: The Frequency of Rh-D amongst A, B, AB and O Groups
Table 6 shows the frequency of Rh-D phenotypes among the samples studied with respect to individual blood groups. The Rh-D positivity and negativity to total 60,350 (100%) Group O samples showed 56,980 (94.42%) and 3,370 (5.58%), whereas total 8,986 (100%) AB Group was 8,665 (96.43%) and 321 (3.57%); total 39,804 (100%) A Group was 38,039 (95.57%) and 1,765 (4.43%); total 51,360 (100%) B Group was 49,433 (96.25%) and 1,927 (3.75%).
DISCUSSION
ABO and Rh gene phenotypes vary widely across races and geographical boundaries despite the facts that the antigens involved are stable throughout the life.[12] The resultant
polymorphism remains important in population genetic studies, estimating the availability of compatible blood, evaluating the probability of haemolytic disease of newborn, resolving disputes in paternity/maternity and forensic purposes. A racial difference in the distribution of blood groups has been noted by some researchers.[7,8] Few studies
on the prevalence of ABO and Rh blood groups have been carried out in the Indian population, and majority of these studies are limited to individual communities or to a
particular region of the country.[13] No such study has yet
been reported from Cachar district of Barak valley of Assam. The present study revealed that blood Group O was the most prevalent at 37.60% followed by B at 32.0%, A at 24.80% and AB at 5.60%. This observation is in accordance with previous studies from other parts of India. The findings of studies conducted in the National Institute of Mental Health and Neuroscience, Bengaluru and on the population of some parts of Andhra Pradesh reveal similar trends. Amongst Indians, Group O is highest.[14] However, the study in the
North Indian population by Nanu A Thapliyal, Chandra and Gupta and Agarwal et al reported blood Group B to be the most prevalent.[13] Similar results with predominance of
blood Group B have also been noted in a study conducted in Gujarat. Some other studies from different parts of Europe, America and South-East Asia have reported blood Group O to be the commonest blood group (Table 7). Group O has been found to be more amongst Indian tribes of America, a section of Australian and Africa, North-Eastern Europeans, etc. White people of America, West Europeans and West Asians have a higher frequency of Group A; whereas Group B is more common in Central and South-East Asians.
ABO Phenotype Population
Caucasoid Whites Blacks Mexicans Asians British Indians
Group-O 47% 45% 49% 56% 43% 46.7% 37.5%
Group-A 41% 41% 28% 28% 27% 41.7% 24.7%
Group-B 09% 10% 19% 13% 25% 8.6% 32.5%
Group-AB 03% 04% 04% 03% 05% 3.0% 5.3%
Table 7: ABO Phenotypes Frequencies amongst Different World Population
The Rh-D blood group is the most polymorphic and its clinical significance in transfusion medicine is only next to the ABO blood group system.[5] The present study showed that
the prevalence of Rhesus D antigen is 95.40%. So Rh-D negative phenotype is 4.60%. This finding is in agreement with the results of other studies in India. Rh-D negative phenotype is 5.0% in India, whereas it is 15% in Europe. There was no association between Rh-D status.
Mordant et al[6]have earlier shown that the frequency of
ABO/Rh-D blood groups is valid only for the specific region or the specific population group from where the data were derived. The Silchar Medical College and Hospital Blood Bank receives blood samples for grouping of almost all population of Cachar district. Hence, the data revealed in the present study fairly reflects the prevalence of ABO and Rh-D groups distribution in the Cachar district in Barak valley of Assam. The present study is therefore useful in providing information on the status of ABO and Rh-D blood groups distribution in the region and the knowledge of it will help in effective management of regional blood transfusion service of the area.
CONCLUSION
With a large sample, we established that among the various ABO and Rh-D blood groups in the Cachar districts in Barak
valley of Assam, Group O is the commonest with Rh-D antigen, the occurrence of blood Group A and B with Rh-D antigen is nearly equal and frequency of AB is least. The frequency of Rh-D negative is, although, slightly lower in present series than the data of the country. The present study is therefore useful in providing information on the status of ABO and Rh-D blood groups distribution of the region and the knowledge of it will help in effective management of regional blood transfusion service of the area. However, studies of other minor blood group antigens are also needed in order to effective management for repeated transfusion dependant transfusions.
REFERENCES
1. Fischbach F. Nurses quick reference to laboratory and diagnostic tests. 3rd ed. Philadelphia, PA: Lippincott
2002:19-25.
2. Lewis SM, Bain JB, Imelda B. Dacie and Lewis practical haematology. 9th ed. Livingstone: Churchill
2001:483-503.
3. Harmening DM. Modern blood banking and transfusion practices. 4th ed. FA Davis Company, Philadelphia
J. Evolution Med. Dent. Sci./eISSN- 2278-4802, pISSN- 2278-4748/ Vol. 5/ Issue 58/ July 21, 2016 Page 4021
4. Worllrdg S, Odiemudia SE, Thomas CO, et al. Blood group antigens and antibodies in Nigeria. A Trop Med Parasitol 1974;68(3):249-64.
5. Avent ND, Reid ME. The RH blood group system. Blood 2000;95(2):375-87.
6. Mordant AE, Koppes AC, Donmainiewski-Sobezek K. The distribution of blood groups and other polymorphism. 2nd ed. Oxford University Press, London 1976.
7. Ahmed SG, Obi SO. The incidence of ABO and Rhesus-D blood group in Northern Nigeria. Nigeria J Med 1998;7:68-70.
8. Bakare AA, Azeez MA, Agbolade JO. Gene frequencies of ABO and rhesus blood groups and haemoglobin variants in Ogbomosho, South West Nigeria. Afr J Biotechnol 2012;13(2):147-53.
9. Guyton AC. Text book of physiology. 7th ed. Livingstone:
Churchill 1985:72-3.
10. Falusi AG, Ademowo OG, Latunji CA, et al. Distribution of ABO and RH genes in Nigeria. Afr J Med Sci 2000;29(1): 23-6.
11. Vengelen-Tyler. Technical manual. 12th ed. USA:
American Association of Blood Banks 2005.
12. Nathalang O, Kuvanont S, Punyaprasiddhi P, et al. A preliminary study of the distribution of blood group systems in Thai blood donors determined by the gel test. Southeast Asian J Trop Med Public Health 2001;32(1): 204-7.
13. Nanu A, Thapliyal RM. Blood group gene frequency in a selected North Indian population. Indian J Med Res 1997;106:242-6.