Rev Odontol UNESP. 2014 May-June; 43(3): 196-202 © 2014 - ISSN 1807-2577 ORIGINAL ARTICLE
Doi: http://dx.doi.org/10.1590/rou.2014.030
Salivary and microbiological parameters of chronic
periodontitis subjects with and without type 2
diabetes mellitus: a case-control study
Parâmetros salivares e microbiológicos em indivíduos com periodontite crônica
com ou sem diabetes melito tipo 2: estudo caso-controle
José Roberto CORTELLI
a, Regina Márcia Serpa PINHEIRO
b, Fernando de Oliveira COSTA
c,
Davi Romeiro AQUINO
a, Suzane A RASLAN
a, Sheila Cavalca CORTELLI
aaFaculdade de Odontologia, UNITAU – Universidade de Taubaté, Taubaté, SP, Brasil bCentro de Ensino São Lucas, Faculdade de Odontologia, Porto Velho, RO, Brazil
cFaculdade de Odontologia, UFMG – Universidade Federal de Minas Gerais, Belo Horizonte, MG, Brasil
Resumo
Introdução: Diversos estudos têm investigado as diferenças dos parâmetros salivares e microbianos entre pacientes diabéticos e não diabéticos, contudo, diferenças específicas ainda não estão claras, principalmente devido aos efeitos de variáveis de confusão. Objetivo: O objetivo deste estudo caso-controle foi avaliar os parâmetros salivares e microbianos de indivíduos com doença periodontal crônica com ou sem diagnóstico de diabetes melito tipo 2.
Material e método: Este estudo caso-controle incluiu 60 indivíduos com periodontite crônica, 30 diabéticos (casos) e 30 não diabéticos (controles), pareados pela severidade da doença periodontal, gênero e idade. Saliva total estimulada foi coletada de todos os voluntários para mensuração do pH salivar e fluxo salivar. Amostras bacterianas foram coletadas com pontas de papel absorvente dos sítios periodontais com maior profundidade de sondagem e perda de inserção clínica. A frequência de A. actinomycetemcomitans, P. intermedia, P. gingivalis, T. forsythia e
C. rectus foi avaliada por PCR. Os dados foram analisados estatisticamente pelo teste t de Student, Mann -Whitney e Qui-quadrado (p < 0,05). Resultado: Diabéticos apresentaram maior nível de glicose salivar e menor fluxo salivar em comparação aos não diabéticos. P. gingivalis e T. forsythia foram os patógenos mais frequentes (p < 0,05). Frequência bacteriana não diferiu entre os casos e controles. Conclusão: A condição diabetes influenciou o fluxo e os níveis de glicose salivar. Dentro da mesma severidade da periodontite crônica, indivíduos diabéticos não mostraram maior frequência de patógenos periodontais em comparação aos seus controles.
Descritores: Saliva; bactérias; periodontite crônica; diabetes mellitus.
Abstract
Background: Several studies have investigated the differences in salivary parameters and microbial composition between diabetic and non-diabetic patients, however, specific differences are still not clear mainly due to the effects
of confounder. Aim: The aim of this case-control study was to evaluate the salivary and microbial parameters of
chronic periodontitis subjects with and without type 2 diabetes mellitus. Material and method: This case-control
study included 60 chronic periodontitis subjects, 30 diabetics (case group) and 30 non-diabetics (control group), paired according to periodontitis severity, gender and age. Stimulated whole saliva was collected from all volunteers to measure the salivary pH and the salivary flow rate. Bacterial samples were collected with paper points from periodontal sites showing the deepest periodontal pocket depth associated with the highest clinical attachment loss. The frequency of A. actinomycetemcomitans, P. intermedia, P. gingivalis, T. forsythia and C. rectus was evaluated by PCR. Data was statistically analyzed by Student’s t, Mann-Whitney and Chi-square (p<0.05). Result: Diabetic subjects showed higher salivary glucose levels and lower stimulated flow rates in comparison to non-diabetic controls. P. gingivalis and T. forsythia were the most frequent pathogens (p<0.05). Bacterial frequency did not differ
between case and control groups. Conclusion: Diabetes status influenced salivary glucose levels and flow rate.
Within the same severity of chronic periodontitis, diabetic subjects did not show higher frequency of periodontal pathogens in comparison to their paired controls.
INTRODUCTION
Diabetes Mellitus is a group of metabolic diseases characterized by hyperglycemia resulting from failure of insulin secretion, insulin action or both. Several pathogenic processes are involved in the development of diabetes. hey range from autoimmune destruction of the beta-cells of the pancreas with consequent insulin deficiency to abnormalities that result in resistance to insulin action. he basis of abnormalities in carbohydrate, fat, and protein metabolism in diabetes is deficient action of insulin on target tissues1. he prevalence of type 2 diabetes worldwide, which
is increasing rapidly, represents a significant burden to human health because of its numerous and oten systemic complications. his challenge also afects Brazilian´s population2-4. he World
Health Organization estimates that there are 220 million adults with diabetes in the world today and that in 2030 this number may double. Diabetes is responsible for 3.5% of all deaths caused by noncommunicable diseases, which represent 63% of all 57 million estimated global deaths5.
he association between periodontal diseases and diabetes has been studied over the last decades and, today, there is enough scientific evidence to support the existence of a two-way relationship between them6-9. Diabetes increases the risk
of incidence and severity for periodontitis10. his may be due
to factors, such as vascular changes, neutrophil dysfunction, altered collagen synthesis, microbial factors and genetic predisposition11. he opposite relation can also be considered
since the inflammatory response observed in periodontitis may afect insulin resistance12.
Sbordone et al.13 demonstrated in diabetic and
non-diabetic patients a predominance of Gram-negative bacteria. However, microbial results are still controversial. According
to Field et al.14, Aggregatibacter actinomycetemcomitans
(A. actinomycetemcomitans), Fusobacterium nucleatum
(F. nucleatum) and Porphyromonas gingivalis (P. gingivalis) counts did not difer significantly between diabetics and non-diabetics. On the contrary, Sardi et al.15 reported that diabetics had a higher
prevalence of Candida spp. and a lower frequency of Tannerella forsythia (T. Forsythia), when compared to non-diabetic subjects, hus, additional studies are suggested for a better clarification of microbial behavior in diabetic patients.
Saliva is one important factor for oral health16. Unfortunately,
diabetes seems to negatively impact salivary flow17 which can
partially explain the poorer oral status among diabetics.
herefore, the aim of this case-control study was to evaluate the salivary parameters and microbiological profile of diagnosed chronic periodontitis subjects with and without type 2 diabetes mellitus.
MATERIAL AND METHOD
Participants included in the present study were recruited from two diferent areas, Taubaté-SP State and Porto Velho-RO State, Brazil. All subjects were screened from 2011 to 2012. he study had been previously approved by the Institutional Committee on
Research Involving Human Subjects of the University of Taubate (protocol number 491-10). We established for this survey a non-probability convenience sample population.
Among 127 eligible subjects according to inclusion and exclusion criteria, 60 chronic periodontitis patients were allocated in two groups: 30 diabetics (case-group) and 30 non-diabetics (control-group), paired according to severity of chronic periodontitis, gender and age. All eligible patients were thoroughly informed of the nature, potential risks, and benefits of their participation in the study and signed an informed consent form. Detailed medical and dental data were collected. Physical examination, Body Mass Index (BMI), blood pressure and blood glycemic level were determined.
1.
Inclusion and Exclusion Criteria
Inclusion criteria: ≥ 25 years old; both genders; ≥ 20 teeth (excluding third molars); diagnosis of generalized moderate chronic periodontitis based on the clinical and radiographic criteria18; and poorly controlled type 2 diabetes (fasting blood
glucose level > 140mg/dL and 2-hour post-prandial blood glucose levels > 200mg/dL) or no diabetes. Diabetic subjects should have received this diagnosis at least 5 years and no longer than 10 years prior to the study. Subjects receiving insulin supplementation, diet regimen, or oral hypoglycemic agents were selected. he physician used additional clinical features such as polyuria, polydipsia and polyphagia to establish diabetes diagnosis. Among controls examinations of blood glucose levels were performed to confirm non-diabetic status.
Exclusion criteria: pregnancy; lactation; current smoking and smoking within the past 5 years; kidney problems or dialysis treatment; systemic diseases, except diabetes for the case group; treatment with any kind of medications that could alter the saliva flow (anti-depressants, anxiolytic, antihistamine, diuretics, and other); periodontal or antibiotic therapies in the previous 6 months, and use of mouthrinses containing antimicrobials agents in the preceding 2 months.
2.
Fasting Plasma Glucose and Glycated Hemoglobin
Monitoring
he laboratory performed the blood analyses of all patients, including fasting plasma glucose (FPG) and glycated hemoglobin (HbA1c) monitoring. FPG was measured using the glucose oxidase method (milligrams per deciliters), and HbA1c (percentage) was measured by high-performance liquid chromatography. Criteria for diagnosis of diabetes were HbA1c ≥ 6.5% and FPG ≥ 126 mg/dL (7.0 mmol/L). Fasting is defined as no calorie intake for at least 8 h.
3.
Assessment of Body Mass Index
normal weight (<25 kg/m2), overweight (25 to 29.9 kg/m2), and
obesity: Class I (30 to 34.9 kg/m2), Class II (35 to 39.9 kg/m2) and
Class III (> 40 kg/m2).
4.
Clinical Examination
One blinded, trained and calibrated examiner conducted all clinical measurements. Intra-examiner agreement was high (kappa = 0.84 for probing depth and 0.82 for clinical attachment level).
A complete periodontal examination was carried out. Measurements of pocket depth (PD), clinical attachment level (CAL), Plaque index (PI) and Gingival index (GI) – presence/ absence19 were obtained in six sites per tooth (mesio-buccal,
buccal, disto-buccal, mesio-lingual, lingual and disto-lingual), excluding third molars, using a manual periodontal probe (PCPUNC 15 Hu-friedy Mfg Co Inc., Chicago, IL, USA). In addition, subjects underwent radiographic examination to evaluate the extent of periodontal bone resorption.
5.
Microbiological Examination
Pooled subgingival samples were taken from five periodontal sites (> PD)20. Each selected tooth was isolated with sterile cotton
rolls and the supragingival plaque was removed with sterile cotton pellets. A sterilized paper point (number 30) was carefully inserted to the depth of the periodontal pocket from the mesial dental aspect and kept in position for 60 s. he pooled subgingival samples were stored at –80 °C in microtubes containing 1mL of reduced Ringer’s solution.
Presence of A.actinomycetemcomitans, Prevotella intermedia (P. intermedia), P. gingivalis, T. forsythia and Campylobacter rectus (C. rectus) was established by polymerase chain reaction (PCR) using specific primers [A.actinomycetemcomitans, sense, 5’-AAACCCATCTCTGAGTTCTTCTTC-3’, and antisense, 5’-ATGCCAACTTGACGTTAAAT-3’ (PCR product size 550 bp);
P. intermedia, sense, 5’-TTTGTTGGGGAGTAAAGCGGG-3’, and antisense, 5’-TCAACATCTCTGTATCCTGCGT-3’ (575 bp);
P. gingivalis, sense, 5’-AGGCAGCTTGCCATACTGCGG-3’, and antisense, 5’-ACTGTTAGCAACTACCGATGT-3(404 bp);
T. forsythia, sense, 5’-GCGTATGTAACCTGCCCGCA-3’, and anti-sense, 5’-TGCTTCAGTGTCAGTTATACCT-3’ (641 bp) and C. rectus, sense: 5’-TTTCGGAGCGTAAACTCCTTTTC-3’, and antisense: 5’-TTTCTGCAAGCAGACACTCTT-3’ (598 bp)] under standard conditions. he DNA was extracted using InstaGene Matrix (BioRad Laboratories, Hercules, CA, USA) and the PCR was performed in a Mastercycler Gradient (Eppendorf , Westbury, NY, USA) thermocycler as follows: one cycle 94 °C for 5 min., 35 cycles 94 °C for 30 s, 55 °C for 30 s, 72 °C for 1min., and a final extension of 72 °C for 5 min. Ater electrophoresis in 1.5% agarose gel, DNA fragments were stained with SYBR Safet (Invitrogen, Carlsbad, CA, USA) and visualized by UV illumination. PCR products were compared with both positive and negative controls. A molecular weight marker (Ladder 100) was added in each set.
6.
Salivary Examination
Stimulated saliva samples were collected from the volunteers between 09:00 and 11:00 hours to avoid circadian rhythm efects. No food or drink was permitted for 2 h before collection. During the sample collection, volunteers remained in a seated position, with their head tilted forward (approximately 45°). he procedure was accomplished in a quiet and well-ventilated room. Initially,
volunteers were instructed to chew a Parafilms
(São Bernardo do Campo, SP-Brazil) block for 5 min. he examiner asked the individuals to spit out saliva each minute. he first 2 minutes. of collection were discarded, and so the analyses were performed using the last three collections21. Immediately ater collection,
the salivary pH was measured using a portable pH meter (Marconi P200, São Paulo, SP-Brazil). Its glass electrode was washed with deionized water and calibrated with bufer solutions pH 7.0 and 4.0.
Additionally, the salivary flow rate - defined as the total volume of saliva produced per unit time (mL/min.), whereas the volume of saliva (ml) was determined considering the diference between the weight (g) of the plastic tube before and ater collection. he density of saliva was considered to be 1.022. A stimulated salivary
flow rate between 1.0 and 3.0mL/min. was considered normal, while values <0.7ml/min. indicated a reduced flow rate23.
Subsequently, bufering capacity of saliva was performed by inoculating with a sterile disposable syringe, 1ml of total saliva in a bottle containing 3ml of 5mmol/l hydrochloric acid
and a system-individual pH indicator (Dentobuf
, Orion Diagnostica, Helsinki, Finland). he bottle was vigorously shaken for 20 seconds and then was allowed to stand for 5 minutes, without the rubber cap for the elimination of carbon dioxide. he color that appeared in the bottle was visually compared with a graduated color scale in pH units, supplied by the manufacturer. he reading of the test was based on the following parameters: (i) very low bufering capacity or lower, pH 3.0 to 4.0, (ii) intermediate bufering capacity, pH 4.5 to 5.0, (iii) normal and good bufer capacity at a challenge of pH <5.524. he glucose
concentration was determined enzymatically in the saliva by the method Glucose Oxidase (Labtest, Lagoa Santa-MG-Brazil).
7.
Statistical Analysis
An initial confirmatory statistical analysis was performed. At this phase all parameters measured to determine the paired population were evaluated. Subsequently, a comparative statistical analysis was done. BMI, body weight, salivary glucose levels and salivary flow rates were compared between diabetic and non-diabetic groups. In addition, frequency of the target bacterial species was compared intra- and inter-groups.
RESULT
The present case-control study included 60 subjects, males or females, 30 diabetics (case group), and 30 non-diabetics (control group), paired according to their clinical periodontal status, gender and age (Table 1). Therefore, as proposed by the study design, Table 2 shows that clinical periodontal Probing Depth (PD), Clinical Attachment Level (CAL), Plaque Index (PI) and Gingival Index (GI) did not differ between groups.
In addition, authors compared body weight and BMI between subjects in the control group and in the case group. Body weight and BMI were statistically similar (p<0.05). Also, diabetic
and non-diabetic diagnoses were confirmed by the observed diferences in blood glycemic levels (Table 3).
Salivary glucose levels and flow rates difered when case and control groups were compared (Table 4). Diabetes was associated with higher glucose levels and lower stimulated salivary flow rates. On the other hand, diabetes was not accompanied by diferences in both salivary pH and bufering capacity.
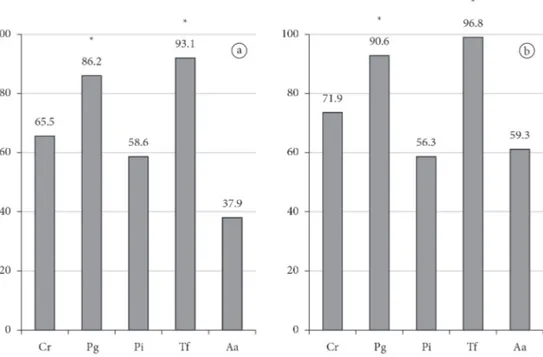
Finally, frequency of the target bacterial species was compared intra- and inter-groups. Intra-group analysis demonstrated that
P. gingivalis and T. forsythia were the most frequent pathogens in both case and control groups (Figure 1). Inter-groups comparative analysis did not show diferences in the frequency of the searched periodontal pathogens (Figure 2).
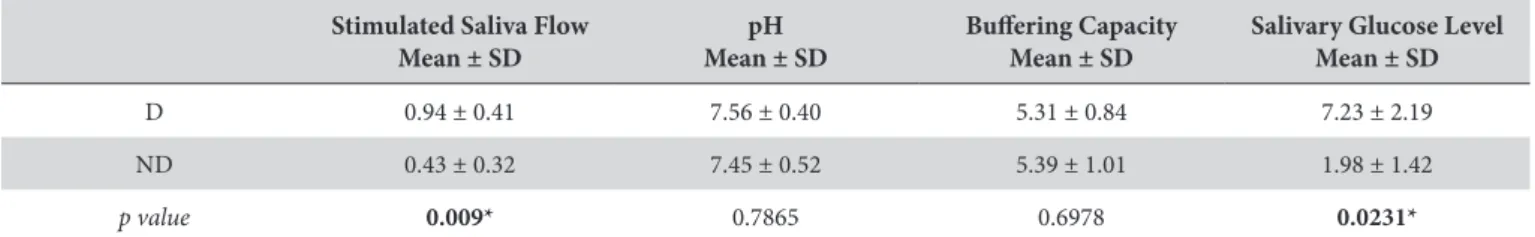
Table 4. Mean values of salivary flow rates, pH, bufering capacity and salivary glucose levels in case and control groups
Stimulated Saliva Flow Mean ± SD
pH Mean ± SD
Bufering Capacity Mean ± SD
Salivary Glucose Level Mean ± SD
D 0.94 ± 0.41 7.56 ± 0.40 5.31 ± 0.84 7.23 ± 2.19 ND 0.43 ± 0.32 7.45 ± 0.52 5.39 ± 1.01 1.98 ± 1.42
p value 0.009* 0.7865 0.6978 0.0231*
SD – Standard Deviation; Student’s t and Mann Whitney Tests; * statistically significant diference (p<0.05); D - Diabetic Cases; ND – Non-diabetic controls. Table 1. Distribution of study population by gender and age
Systemic status [Type 2 Diabetes mellitus] Total
Diabetic Cases Non-diabetic Controls
Male 12 12 24
Female 18 18 36
Total 30 30 60
(Mean age ± SD years) (49.23 ± 9.41) (49.23 ± 9.41) (49.23 ± 9.33)
SD – Standard Deviation.
Table 2. Mean values of the chronic periodontitis clinical parameters pocket depth (PD), clinical attachment level (CAL), plaque index (PI) and gingival index (GI) among diabetic and non-diabetic subjects
PD Mean ± SD
CAL Mean ± SD
PI Mean ± SD
GI Mean ± SD
D 3.41 ± 0.64 3.81 ± 1.66 0.76 ± 0.24 0.48 ± 0.15 ND 3.61 ± 0.71 3.39 ± 1.72 0.71 ± 0.24 0.56 ± 0.20
p value 0.3011 0.1429 0.8948 0.8432
SD – Standard Deviation; Student’s t Test and Mann Whitney Tests. D - Diabetic Cases. ND – Non-diabetic controls.
Table 3. Mean values of body weight, body mass index (BMI) and blood glycemic index, as related to diabetes status
Weight Mean ± SD
Body Mass Index Mean ± SD
Blood Glycemic Index Mean ± SD
D 71.13 ± 12.38 27.48 ± 5.39 178.36 ± 73.01 ND 75.39 ± 22.38 28.46 ± 7.02 88.13 ± 11.05
p value 0.9328 0.9312 0.0041*
DISCUSSION
he increasing number of diabetic subjects worldwide brings up the discussion of diabetes management and the diseases associated comorbidities. Studies have supported a two-way relation between diabetes and periodontal status6-9. Key public
strategies such as primary prevention and early diagnosis require deep knowledge related to risk factors and to the etiopathogenesis of the disease or diseases under analysis. Saliva has a straight risk relationship to oral diseases being a relevant auxiliary diagnostic body fluid. Also, many systemic diseases manifest themselves through salivary changes and diabetes seems to be one of them17.
Although several studies have compared the composition of subgingival biofilm between diabetic and non-diabetic patients many aspects are still unclear13-15. Up to now literature
is not enough to sustain whether a periodontal microbial diference exists or not. he existence of confounders can lead to misinterpretation. For this reason diferent study designs can help researchers to understand unanswered questions. herefore, aiming at controlling the expected efects of some recognized modulators of periodontal microbiota – age, periodontal status – the present study used a matched population to ofer a better understanding about the occurrence of target periodontal species in samples collected from diabetic subjects and their non-diabetic controls. In addition to limiting salivary/microbial and other systemic efects of diabetes a range of 5 years was used to determine the maximum duration of the disease. his came from the understanding that the longer a subject is exposed to diabetes the higher is the number of comorbidities, side efects and other health complications.
Combined with glycated hemoglobin, blood glucose levels are still one classical indicator of diabetes. hus, changes in oral glucose levels have been investigated as an oral environmental change indicator among diabetics. Ater analyzing newly diagnosed type 2 diabetes subjects, Abikshyeet et al.25 found
significant correlations between salivary glucose and both blood glucose and blood glycated hemoglobin. In addition to glucose levels, salivary flow rate is also a theme of study. Lasisi,
Fasanmade17 reported diferences related to salivary flow and
glucose levels ater comparing diabetic and non-diabetic subjects. On the other hand, Panchbhai et al.26 only observed diferences
related to glucose levels. When these authors compared salivary flow rate among uncontrolled diabetes, controlled diabetes and healthy controls they failed to sustain a significant diference. In
Figure 2. Frequency (%) of periodontal pathogens as related to systemic status of the individuals. Case indicates diabetic periodontally diseased subjects while control indicates the group composed of non-diabetic periodontally diseased subjects. Data from inter-group analysis. C.r – C. rectus; P.g – P. gingivalis; P.i – P. intermedia; T.f – T. forsythia; A.a – A. actinomycetemcomitans.
the present study diabetic subjects showed higher levels of glucose in saliva and lower salivary flow rates. As one of the outcomes of a chronic reduced salivary flow, Borges et al.27 found a prevalence
of dry mouth of 25% among elderly Brazilian diabetic subjects and 46% of the subjects revealed hyposalivation in stimulated conditions.
Considering case and control groups P. gingivalis and
T. forsythia were the most frequent species. Actually, both groups showed moderate to high frequency of all bacterial species,
even for the pathogen A. actinomycetemcomitans, showing
and approximate overall range from 40 to 90%. his observed frequency was compatible to other studies that evaluated chronic periodontitis subjects with no microbiological diferences between case and control groups14,28. It seems that subgingival
bacterial frequency was more dependent on local periodontal clinical status than on systemic diabetes status. In the present study the major factor that determined high bacterial frequency,
was the periodontal status per se. Unexpectedly, neither the
higher concentrations of glucose in saliva nor the lower flow rate did influence frequency of periodontal pathogens. Although Gram-negative bacteria are less glucolytic some species are able to uptake and use glucose as a substrate29. Despite the fact that
other researchers also failed to report microbial diferences between diabetics and non-diabetics14,28, the present study design
ofered a better support for this lack of diference. Our findings can partially justify why antibiotics or antiseptics only ofer diabetic subjects the same degree of benefits observed in systemic healthy controls.
he present study suggested that the greater severity of periodontal breakdown found among diabetic subjects is dictated by factors other than the bacterial component. Immunological factors are good candidates to sustain this pattern of greater severity. herefore, eforts should be done to clarify the immunological component related to diabetes/periodontitis patients.
Diabetes status influenced salivary glucose levels and flow rate. Within the same severity of chronic periodontitis, diabetic subjects did not show higher frequency of periodontal pathogens in comparison to their paired controls.
ACKNOWLEDGEMENTS
his research was partially supported by São Paulo State Research Foundation (São Paulo, Brazil; research grant # 2010/204240-1 and scholarship # 2011/02371-0) and National Council of Scientific and Technological Development (CNPq)-Productivity Research Fellows PQ.
REFERENCES
1. American Diabetes Association. Diagnosis and classification of diabetes mellitus: position statement. Diabetes Care. 2012; 35 Suppl 1: 64-71. PMid:22187472 PMCid:PMC3632174. http://dx.doi.org/10.2337/dc12-s064
2. Rezende KF, Ferraz MB, Malerbi DA, Melo NH, Nunes MP, Pedrosa HC, et al.Predicted annual costs for inpatients with diabetes and foot ulcers in a developing country – a simulation of the current situation in Brazil. Diabet Med. 2010; 27: 109-12. PMid:20121897. http:// dx.doi.org/10.1111/j.1464-5491.2009.02871.x
3. Santos VR, Lima JA, Miranda TS, Feres M, Zimmermann GS, Nogueira-Filho GR, et al. Relationship between glycemic subsets and generalized chronic periodontitis in type 2 diabetic Brazilian subjects. Arch Oral Biol. 2012; 57: 293-9. PMid:21890108. http://dx.doi. org/10.1016/j.archoralbio.2011.08.003
4. Costa FO, Miranda Cota LO, Pereira Lages EJ, Soares Dutra Oliveira AM, Dutra Oliveira PA, Cyrino RM, et al. Progression of periodontitis and tooth loss associated with glycemic control individuals under periodontal maintenance therapy: a 5-year follow-up study. J Periodontol. 2012; 84: 595-605. PMid:22769441. http://dx.doi.org/10.1902/jop.2012.120255
5. World Health Organization. Cause-specific mortality: regional estimates for 2008. Geneva: WHO; 2011. Avaliable from: http://www.who. int/healthinfo/global_burden_disease/estimates_regional/en/index.html
6. Taylor GW, Burt BA, Becker MP, Genco RJ, Shlossman M, Knowler WC, et al. Non-insulin dependent diabetes mellitus and alveolar bone loss progression over 2 years. J Periodontol. 1998; 69: 76-83. PMid:9527565. http://dx.doi.org/10.1902/jop.1998.69.1.76
7. Soskolne WA, Klinger A. he relationship between periodontal diseases and diabetes: an overview. Ann Periodontol. 2001; 6: 91-8. PMid:11887477. http://dx.doi.org/10.1902/annals.2001.6.1.91
8. Lakschevitz F, Aboodi G, Tenenbaum H, Glogauer M. Diabetes and periodontal diseases: interplay and links. Curr Diabetes Rev. 2011; 7: 433-9. PMid:22091748. http://dx.doi.org/10.2174/157339911797579205
9. Preshaw PM, Alba AL, Herrera D, Jepsen S, Konstantinidis A, Makrilakis K, et al. Periodontitis and diabetes: a two-way relationship. Diabetologia. 2012; 55: 21-31. PMid:22057194 PMCid:PMC3228943. http://dx.doi.org/10.1007/s00125-011-2342-y
10. Campus G, Salem A, Uzzau S, Baldoni E, Tonolo G. Diabetes and periodontal disease: a case-control study. J Periodontol. 2005; 76: 418-25. PMid:15857077. http://dx.doi.org/10.1902/jop.2005.76.3.418
11. Oliver RC, Tervonen T. Diabetes a risk factor for periodontitis in adults?J Periodontol. 1994; 65 (Suppl 5): 530-8. PMid:8046569. http:// dx.doi.org/10.1902/jop.1994.65.5s.530
12. Mealey BL, Ocampo GL. Diabetes mellitus and periodontal disease. Periodontol 2000. 2007; 44: 127-53. PMid:17474930. http://dx.doi. org/10.1111/j.1600-0757.2006.00193.x
14. Field CA, Gidley MD, Preshaw PM, Jakubovics N. Investigation and quantification of key periodontal pathogens in patients with type 2 diabetes. J Periodontal Res. 2012; 47: 470-8. PMid:22220967. http://dx.doi.org/10.1111/j.1600-0765.2011.01455.x
15. Sardi JC, Duque C, Camargo GA, Hofling JF, Gonçalves RB. Periodontal conditions and prevalence of putative periodontopathogens and Candida spp. in insulin-dependent type 2 diabetic and non-diabetic patients with chronic periodontitis-a pilot study. Arch Oral Biol. 2011; 56: 1098-105. PMid:21529777. http://dx.doi.org/10.1016/j.archoralbio.2011.03.017
16. Dodds MW, Johnson DA, Yeh CK. Health benefits of saliva: a review. J Dent. 2005; 33: 223-33. PMid:15725522. http://dx.doi.org/10.1016/j. jdent.2004.10.009
17. Lasisi TJ, Fasanmade AA. Salivary flow and composition in diabetic and non-diabetic subjects. Niger J Physiol Sci. 2012; 27: 79-82. PMid:23235312.
18. American Academy or Periodontology. International workshop for a classification of periodontal diseases and conditions. Ann Periodontol. 1999; 4: 1-6. PMid:10863370. http://dx.doi.org/10.1902/annals.1999.4.1.1
19. Ainamo J, Bay I. Problems and proposals for recording gingivitis and plaque. Int Dent J. 1975; 25: 229-35. PMid:1058834.
20. Cortelli JR, Aquino DR, Cortelli SC, Fernandes CB, Carvalho-Filho J, Franco GCN, et al. Etiological analysis of initial colonization of periodontal pathogens in oral cavity. J Clin Microbiol. 2008; 46(4): 1322-9. PMid:18287326 PMCid:PMC2292974. http://dx.doi. org/10.1128/JCM.02051-07
21. Navazesh M, Christensen C, Brightman V. Clinical criteria for the diagnosis of salivary gland hypofunction. J Dent Res. 1992; 71: 1363-9. PMid:1629451. http://dx.doi.org/10.1177/00220345920710070301
22. Navazesh M. Methods for collecting saliva. Ann N Y Acad Sci. 1993; 694: 72-7. PMid:8215087. http://dx.doi.org/10.1111/j.1749-6632.1993. tb18343.x
23. Krasse B. Biological factors as indicators of future caries. Int Dent J. 1988; 38: 219-25. PMid:3063665.
24. Frostell G. A colourimetric screening test for evaluation of the bufer capacity of saliva. Swed Dent J. 1980; 4: 81-6. PMid:6933707.
25. Abikshyeet P, Ramesh V, Oza N. Glucose estimation in the salivary secretion of diabetes mellitus patients. Diabetes Metab Syndr Obes. 2012; 5: 149-54. PMid:22923999 PMCid:PMC3422906.
26. Panchbhai AS, Degwekar SS, Bhowte RR. Estimation of salivary glucose, salivary amylase, salivary total protein and salivary flow rate in diabetics in India. J Oral Sci. 2010; 52: 359-68. PMid:20881327. http://dx.doi.org/10.2334/josnusd.52.359
27. Borges BC, Fulco GM, Souza AJ, de Lima KC. Xerostomia and hyposalivation: a preliminary report of their prevalence and associated factors in Brazilian elderly diabetic patients. Oral Health Prev Dent. 2010; 8: 153-8. PMid:20589249.
28. Lalla E. Periodontal infections and diabetes mellitus: when will the puzzle be complete? J Clin Periodontol. 2007; 34: 913-6. PMid:17935499. http://dx.doi.org/10.1111/j.1600-051X.2007.01140.x
29. Ryan CS, Kleinberg I. A comparative study of glucose and galactose uptake in pure cultures of human oral bacteria, salivary sediment and dental plaque. Arch Oral Biol. 1995; 40: 743-52. http://dx.doi.org/10.1016/0003-9969(95)00028-N
CONFLICTS OF INTERESTS
he authors declare no conflicts of interest.
CORRESPONDING AUTHOR
José Roberto Cortelli
UNITAU – Universidade de Taubaté, Rua Expedicionário Ernesto Pereira, 110, 12020-330 Taubaté - SP, Brasil e-mail: [email protected]