1
Universidade de Santa Cruz do Sul, Departamento de Educação Física e Saúde, Programa de Pós-Graduação em Promoção da Saúde. Av. Independência, 2293, Sala 4206, Campus Universitário, 96815-900, Santa Cruz do Sul, RS, Brasil. Correspondência para/Correspondence to: SIR FRANKE. E-mail: <[email protected]>.
2
Universidade de Santa Cruz do Sul, Departamento de Educação Física e Saúde, Laboratório de Nutrição Experimental. Santa Cruz do Sul, RS, Brasil.
3
Universidade de Santa Cruz do Sul, Departamento de Biologia e Farmácia, Curso de Ciências Biológicas. Santa Cruz do Sul, RS, Brasil.
Article based on the master’s theses of P. MOLZ, entitled “Influência in vivo de nutrientes sobre a citotoxicidade e estabilidade genômica associadas à sobrecarga de açúcar”. Universidade de Santa Cruz do Sul; 2015.
Suport: Conselho Nacional de Desenvolvimento Científico e Tecnológico (Process nº 479554/2013-7), by Fundação de Amparo à Pesquisa do Estado do Rio Grande do Sul, and by the Laboratory of Experimental Nutrition of Universidade de Santa Cruz do Sul.
Vitamin C decreases the obesogenic and
hyperglycemic effect of invert sugar
in prediabetic rats
Vitamina C reduz o efeito obesogênico e
hiperglicemiante do açúcar invertido
em ratos pré-diabéticos
Patrícia MOLZ1,2 Alana Nunes RAEL3 Maiara de Queiroz FISCHER2 Luana Beatriz LIMBERGER2 Daniel PRÁ1,2,3
Silvia Isabel Rech FRANKE1,2
A B S T R A C T
Objective
To evaluate whether vitamin C can help to prevent obesity and hyperglycemia in Wistar rats treated with excess invert sugar to induce prediabetes.
Methods
water ad libitum and were treated for 17 weeks. Prediabetes was assessed according to two criteria: obesity (based on body mass indexand peritoneal fat content) and impaired glucose tolerance (assessed by the intraperitoneal glucose tolerance test and expressed as area under the curve).
Results
Group invert sugar control gained significantly more weight (p=0.035) and visceral fat (p<0.001) than groups vitamin C control and vitamin C plus invert sugar. Consequently, groups vitamin C control and vitamin C plus invert sugar had gained as little body mass index as group C by the end of the experiment. Vitamin C decreased the fasting glycemia of both groups supplemented with vitamin C and normalized the glucose tolerance of group vitamin C plus invert sugar, whose area under the curve matched that of group C.
Conclusion
Vitamin C has anti-obesogenic and glycemia-lowering effects in Wistar rats, which might be promising to prediabetics. Future studies are needed to understand the anti-obesogenic and anti-hyperglycemic mechanisms of vitamin C in prediabetes.
Keywords: Hyperglycemia. Obesity. Prediabetes states. Vitamin C.
R E S U M O
Objetivo
Avaliar o efeito da vitamina C na prevenção da obesidade e da hiperglicemia, em ratos Wistar tratados com sobrecarga de açúcar invertido, para induzir o estágio de pré-diabetes.
Métodos
Ratos Wistar machos (100 dias de vida e peso médio de 336,58±23,43g) foram distribuídos aleatoriamente nos grupos: (1) controle água; (2) controle açúcar invertido, recebendo 32% de açúcar invertido diluído em água; (3) controle vitamina C, recebendo vitamina C (60mg/L) diluído em água e, (4) açúcar invertido+vitamina C, tratados com vitamina C e açúcar invertido diluídos em água. Todos os animais receberam ração e água ad libitum, sendo tratados por 17 semanas. O estágio de pré-diabetes foi avaliado considerando-se obesidade (índice de massa corporal e quantidade de gordura peritoneal) e tolerância à glicose diminuída (Teste de Tolerância à Glicose Intraperitoneal, expresso pela área sob a curva).
Resultados
Os grupos vitamina C e açúcar invertido + vitamina C apresentaram redução significativa do peso (p=0,035) e da gordura visceral (p<0,001) em relação ao grupo açúcar invertido. Consequentemente, verificou-se uma diminuição do índice de massa corporal dos grupos vitamina C e açúcar invertido+vitamina C, assemelhando-se ao do grupo C no final do experimento. A vitamina C reduziu a glicemia de jejum dos animais de ambos os grupos suplementados com Vitamina C e normalizou a tolerância à glicose do grupo açúcar invertido+vitamina C, igualando-se a área sob a curva a do grupo C.
Conclusão
A suplementação de vitamina C teve efeito anti-obesogênico e hipoglicemiante, mostrando-se promissora no pré-diabetes. Estudos futuros são necessários para entender os mecanismos anti-obesogênicos e anti-hiperglicemiantes da vitamina C no pré-diabetes.
Palavras-chave: Hiperglicemia. Obesidade. Estado pré-diabétes. Vitamina C.
I N T R O D U C T I O N
Vitamin C, also known as ascorbic acid, is one of the main dietary vitamins. It is present in a variety of foods, such as fruits and vegetables1.
Moreover, vitamin C is a natural antioxidant whose action has been studied because of its numerous important biological effects2.
One of the possible beneficial effects of vitamin C is prevention and treatment of obesity3.
Human4 and animal5 studies have found that
transport in the cell7, contributing to better
glycemic control in DM2.
Prediabetes occurs before the onset of DM2. It is an intermediate hyperglycemic state where individuals present low glucose tolerance and initial insulin resistance8. It is during this stage
that individuals are more likely to develop functional or pathological changes, before the establishment of DM2 diagnosis9. This stage is
also closely related to an increase in overweight and obesity, a predictor for the development of DM2 and its complications10,11. Excess energy
intake and a sedentary lifestyle are among the main risk factors for obesity and the development of DM2. In this context, excess sugar intake has an important role in the growing global prevalence of both conditions11-13. In most
situations, higher dietary glycemic load leads to a positive energy balance, increasing body fat and insulin resistance14.
More studies are needed on factors that minimize the adverse health effects caused by excess sugar intake, and vitamin C may be a nutritional strategy to reduce weight gain, visceral fat, Body Mass Index (BMI), glycemia, and low glucose tolerance in prediabetes, given that this stage is still little explored. Therefore, the objective of this study was to assess whether vitamin C can prevent obesity and hyperglycemia in Wistar rats given excess invert sugar to induce prediabetes.
M E T H O D S
Animals
This study was approved by the Animal Research Ethics Committee of Universidade de Santa Cruz do Sul (under Protocol nº 14/2013). Thirty-two male Wistar rats with approximately 100 days age and average body weight of 336.58±23.43 g were placed in individual cages at the university’s vivarium at a temperature of 22±3°C, 12:12-hour light-to-dark cycle, and relative humidity of 60%.
Treatment
The animals were allowed to adapt to their new environment for seven days, during which they received a chow with normal protein and energy contents (Nuvilab®, Quimtia, Colombo,
Brazil; pertinent composition presented in Table 1) and water ad libitum. After this time, the 32 animals were divided into four groups (8 animals in each group) to receive the following treatments for 17 weeks: 1) Control group (group C), given only water; 2) group Invert Sugar (IS) control, given a watery solution of invert sugar; 3) group Vitamin C (VitC) control, given a watery solution of vitamin C; and 4) group Vitamin C + Invert Sugar (VitCIS), given a watery solution of vitamin C and invert sugar. Eight animals were placed in each group based on the research group’s past experience, always trying to use fewer animals than similar experiments15,16.
Water was used as the vehicle for vitamin C and invert sugar administration, which was provided ad libitum to the animals, along with the chow, the same one with normal protein and energy contents used during the adaptation
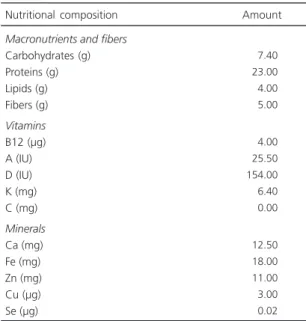
Table 1. Nutritional composition of the chow Presence by
Nuvilab® (Quimtia, Colombo, Brazil).
Macronutrients and fibers Carbohydrates (g) Proteins (g) Lipids (g) Fibers (g) Vitamins B12 (µg) A (IU) D (IU) K (mg) C (mg) Minerals Ca (mg) Fe (mg) Zn (mg) Cu (µg) Se (µg)
007.40 023.00 004.00 005.00
004.00 025.50 154.00 006.40 000.00
012.50 018.00 011.00 003.00 000.02
Nutritional composition Amount
period. Food and water intake were measured weekly by subtracting the volumes not ingested from the volumes provided.
Test substances: Induction of prediabetes and vitamin C supplementation
In order to induce prediabetes in the animals we used an overload of invert sugar (Pantec®, São Paulo, SãoPaulo,Brazil) dissolved
in water at a concentration of 32%17.
Vitamin C supplementation (Sigma A4544) was based on the concentrations of the Tolerable Upper Intake Level for humans (Upper Level [UL])18 adapted for rats. UL is the maximum
tolerable daily intake to avoid the chance of a nutrient causing adverse health effects. Thus, to avoid health risks to the animals caused by excess vitamin C (UL according to the Dietary Reference Intakes=2,000 mg/day18), the animals were given
only 0.5UL. In humans, 0.5UL is equivalent to 14mg/kg for an adult male weighing 70kg, so extrapolating to rats, which weigh on average 400g and consume approximately 100mL of fluids
per day19, the amount provided was
approximately 60mg/L. A watery solution of vitamin C remained available for one week at a controlled temperature of 22±3°C. The solution was protected from light to minimize vitamin C loss. At the end of the experiment, the mean fluid intake was measured, and the vitamin C intake of each group was calculated.
Two criteria were used for confirming prediabetes: obesity and low glucose tolerance, adapted from Hafizur et al.15, who presented a
‘humanized’ prediabetes model in rats.
Obesogenic markers
A rodent-specific BMI was used for assessing obesity. It is given by the relationship between the animal’s weight and length. The rats’ BMI were calculated weekly as recommended by
Novelli et al.20. Rats with BMI>0.67g/cm2 were
considered obese. The animals were weighed by an analytical balance (Toledo®, SãoBernardodo Campo, SãoPaulo, Brazil) with minimum accuracy of 25.00g and maximum load of 35.00kg. An anthropometric tape measure (Carci®, SãoPaulo, São Paulo, Brazil) measured the length of the animal’s body from nose to anus.
At the end of the experiment, the body fat of the animals was collected as recommended by Cinti21, which involves collecting the visceral
fat deposits, located in the thorax and abdominal cavity, to weigh and assess the amount of visceral fat.
Hyperglycemia marker
Glucose tolerance was assessed by the Intraperitoneal Glucose Tolerance Test (ipGTT)22
at the end of the experiment (17th week). The
ipGTT curve was measured by the portable glucometer Accu-Chek® (São Paulo, São Paulo,
Brazil), using blood collected from the tail’s vein after a 6-hour fast (time 0). Next, intraperitoneal glucose was administered (1mg of glucose per g of rat weight) and glycemia was measured 5, 15, 30, 60, and 120 minutes later. Blood glucose changes during the ipGTT were expressed as glucose Area Under the Curve (AUC).
Statistical analysis
R E S U L T S
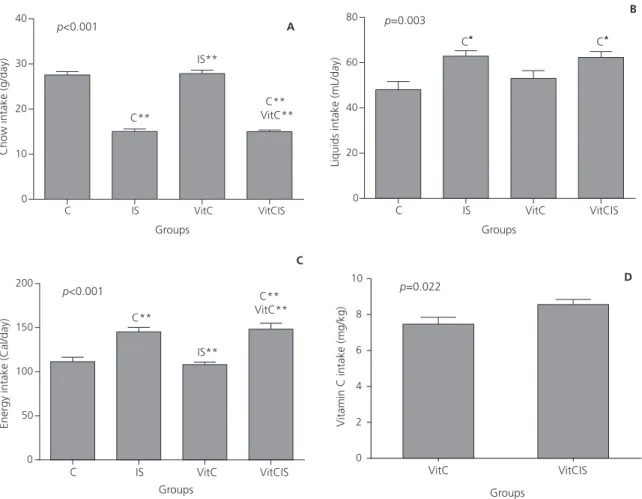
The food and liquid intakes (Figure 1A and 1B) of the groups were: (C=27.56±1.93g; IS=15.00±1.60g; VitC=27.85±2.12g; VitCIS= 14.99±0.98; p<0.001 and C=48.10±10.08mL/day; IS=62.92±6.72mL/day; VitC=53.13±9.56mL/day; VitCIS=62.35±7.39; p=0.003). The group VitCIS consumed more energy (148.20±19.53 Cal) than the other groups (C=111.36±14.28Cal; IS=145.19±14.23Cal; and VitC=108.07±8.23Cal; p<0.0001). On the other hand, the group given only vitamin C consumed 37% less energy than group VitCIS, and 3% less energy than group C (Figure 1C). At the end of the experiment, groups
VitC (7.48±1.07mg/kg) and VitCIS (8.56±0.77mg/ kg) had significantly different vitamin C intakes (p=0.022) (Figure 1D).
The groups had significantly different final weight (C=471.88±34.24g; IS=526.43±41.81g; VitC=473.63±32.57g; and VitCIS=495.57±42.87g; p=0.035). The group given the watery invert sugar solution had a higher final weight than the other groups (Figure 2A). Vitamin C intake by group VitCIS (8.93±1.76mg/kg) reduced the weight gained by the animals by 6%. A similar effect was verified for peritoneal fat (Figure 2B), with an even greater difference between the g r oups (C=4.29±1.43g; IS=11.23±2.81g;
Figure 1. Difference between food (A), liquids (B), and energy (C) intake of groups: Control groups (C), Invert Sugar (IS) control, group Vitamin C (VitC) control, and Vitamin C+ control Invert Sugar (VitCIS), and of vitamin C intake (D) of the groups VitC and VitCIS. Laboratory of Experimental Nutrition of the Universidade de Santa Cruz do Sul (RS), Brazil, 2013.
Note:*p<0.05; **p<0.001. p: Significance level according to on-way Analysis of Variance followed by the Bonferroni post hoc test or Student’s t-test.
C IS VitC VitCIS 0
10 20 30 40
C**
A
C** VitC** IS**
p<0.001
Groups
Chow intake (g/day)
C IS VitC VitCIS
0 20 40 60
80 p=0.003 B
C C
Groups
Liquids intake (mL/day)
* *
C IS VitC VitCIS
0 50 100 150 200
C**
C
C** VitC**
IS** p<0.001
Groups
Energy intake (Cal/day)
VitC VitCIS
0 2 4 6 8 10
p=0.022 D
Groups
V
VitC=6.01±1.76g; and VitCIS=8.14±3.47g; p<0.001). Group VitCIS had 28% less peritoneal fat than group IS.
The body mass index of the groups differed significantly (p=0.005). The group given invert sugar presented the highest gain in BMI, with a Figure 2. Difference between body weight (A) and visceral fat (B) of the groups: Control groups (C), Invert Sugar (IS) control, group Vitamin C (VitC) control, and Vitamin C+ control Invert Sugar (VitCIS). Laboratory of Experimental Nutrition of the Universida-de Universida-de Santa Cruz do Sul, Santa Cruz do Sul (RS), Brazil, 2013.
Note: *p<0.05; **p<0.01; ***p<0.001. p: Significance level according to one-way Analysis of Variance followed by Bonferroni post hoc test.
Figure 3. Evolution of body mass index of groups Control groups (C), Invert Sugar (IS) control, group Vitamin C (VitC) control, and Vitamin C+ control Invert Sugar (VitCIS). Laboratory of Experimental Nutrition of the Universidade de Santa Cruz do Sul, Rio Grande do Sul (RS), Brazil. 2013.
Note: r: Correlation coefficient and significance level of p according to the Pearson’s correlation test. The horizontal dashed line indicates the body mass index cut-off point for the classification of obesity in rats according to Novelli et al.20.
C IS VitC VitCIS
0 200 400 600
800 p=0.035
C
A
Groups
Body weight (g)
*
C IS VitC VitCIS
0 5 10 15
20 p<0.001 B
C
IS
C
Groups
V
iceral fat (g)
***
**
*
2 4 6 8 10 12 14 16 18
0.50 0.55 0.60 0.65 0.70
0.68
Time (weeks)
Body mass index (g/cm²)
Group C
Group IS Group VitCIS Group VitC
r=0.688; =0.001p
final mean BMI of 0.69±0.03g/cm2. The BMI of
group VitCIS was 9% lower than that of group IS at the end of 17 weeks. The BMI of group VitC (0.62±0.05g/cm2) was similar to that of group C
(0.62±0.04g/cm2) at the end of treatment. Three
groups (VitCIS, VitC, and C) had similar final BMI (p=0.641), while the final BMI of groups VitCIS and IS differed significantly (p=0.007) (Figure 3).
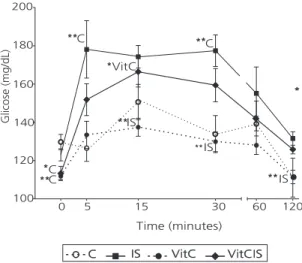
At time 0, the fasting glycemia of all groups differed significantly (p=0.002). The groups given vitamin C (VitC=110.75±5.99mg/dL and VitCIS=113.28±9.86mg/dL) had lower glycemia than groups C (129.75±11.25mg/dL) and IS (123.00±8.29mg/dL). Measurement of glycemia at the established times after glucose infusion showed that group IS had a greater glycemic AUC than the other groups (p=0.001). The rats of both groups treated with vitamin C had lower glycemia at times 5 (p<0.001), 15
(p=0.003), 30 (p=0.001), and 60 minutes
(p=0.160). Moreover, at 120 minutes (p=0.002), group VitCIS (AUC=17255.71±1392.54) had better glucose tolerance than group IS
(AUC=18743.00±2116.67), and glycemia of group VitC (AUC=15023.14±963.83) was similar to that of group C (AUC=16114.14±1489.96) (Figure 4).
D I S C U S S I O N
Treatment with an overloaded watery solution (32% concentrated) of invert sugar was capable of inducing prediabetes in rats, as their tolerance to glucose decreased according to the ipGTT, as well as obesity. Invert sugar was used for inducing prediabetes because it is present in sugary beverages. It consists of a mixture of equal parts (33% of each with 33% of inversion) of glucose, fructose, and invert sucrose23,24.
Moreover, studies have found that sugar overload can promote metabolic, hemodynamic, structural, and functional disorders in rodents, increasing plasma insulin, leptin, triglycerides, glucose, and free fatty acids, leading to low glucose tolerance25,
typical prediabetes characteristics.
Finding nutritional alternatives that can minimize the adverse health effects caused by excess sugar can be an important strategy as it is extremely challenging to reduce the intake of high-sugar foods26. In this sense, vitamin C could
easily be included in the composition of commercially prepared foods or added to the diet as a supplement. Vitamin C may benefit all individuals, including nondiabetics (vitamin C control group) as found by the present and other studies3-5, reducing the amount of weight and
visceral fat gain, normalizing BMI, and acting as a blood glucose-lowering agent.
The groups given invert sugar (group IS and VitCIS) had higher liquid and lower chow intakes. The energy intake of these two groups were similar, but the weight gained by the rats co-treated with vitamin C (group VitCIS) was lower than that gained by the group given only IS. Studies have reported that high energy intake is the main cause of excess weight27. Sugary
beverages increase appetite more than solid foods given the low satiety and incomplete compensation of fluid calories, being an important contributor Figure 4. Glycemia curve of 120 minutes for the intraperitoneal
glucose tolerance test of groups: Control groups (C, n=8), group Invert Sugar (IS, n=8) control, group Vitamin C (VitC, n=8) control, and group Vitamin C + control Invert Sugar (VitCIS, n=8). Laboratory of Experimental Nutrition of the Universidade de Santa Cruz do Sul, Santa Cruz do Sul (RS), Brazil, 2013.
Note: *p<0.05; **p<0.01. The points refer to mean ± standard deviation.
One-way Analysis of Variance.
C IS VitC VitCIS
100 120 140 160 180 200
0 5 15 30 60 120
C
*
C
VitC
Time (minutes)
Glicose (mg/dL)
* **
IS
**
C
**
*
C
**
IS
**
IS
to higher fat deposition14,28. Since vitamin C
reduces weight and visceral fat gain3,4, it may have
helped to reduce weight gain in the study rats.
Co-treatment with vitamin C was capable of reducing induced weight gain promoted by invert sugar intake. At the same time, vitamin C effectively reduced visceral fat accumulation. These effects may be related to the antioxidant nature of vitamin C, as demonstrated by Garcia--Diaz et al.3. In the present study, both lower
weight gain and lower visceral fat in the group co-treated with vitamin C and invert sugar are similar to those of the control group. Both parameters (weight gain and visceral fat) effectively reduced the BMI gain of group VitCIS. BMI is an important tool to assess obesity20 as
obesity is one of the risk factors for DM2 development10,27.
Al-Shamsi et al.5 found that weight loss in
streptozotocin-induced diabetic Wistar rats was associated with vitamin C dose. Moderate and high doses (50mg/kg; 100mg/kg) of vitamin C for 10 days slowed down weight gain more effectively, especially after DM onset5. Still in this
context, Leffa et al.29 assessed the effect of vitamin
C (1mg/kg) in rats given a cafeteria diet for 13 weeks and also found that animals co-treated with vitamin C gained less weight. Nonetheless, the mean energy intake of the group fed the cafeteria diet was lower than that of the control group, despite the cafeteria diet’s high energy density and low nutrient density. The cafeteria diet consists of chocolate, biscuits, cookies, hot dogs, potato chips, and carbonated beverages, among others25.
Even though Al-Shamsi et al.5 used
relatively high doses of vitamin C (50 mg/kg; 100 mg/kg) to slow down weight gain, the treatment time (10 days) was much shorter than that of the present study. On the other hand, Leffa et al.29 not only used a lower dose of vitamin C
(1 mg/kg) than the dose used herein, but also treated their rats for a shorter period (13 weeks). In the present study, the difference in weight gained by groups VitCIS and IS only appeared in week twelve.
The mechanisms by which vitamin C slows down weight gain have not been fully elucidated, but Garcia-Diaz et al.3 suggest that this beneficial
effect may be associated with vitamin C ability to modulate adipocyte lipolysis, regulate the release of glucocorticoids by the adrenal glands, inhibit glucose metabolism and leptin release by isolated adipocytes, reduce hyperglycemia and glycosylation in obese-diabetic models, and reduce the inflammatory response. Carillon et al.30
pointed out that obesity induced by an inadequate diet may be associated with oxidative stress, reducing the antioxidant defenses and allowing vitamin C to act as a natural antioxidant, which helps to treat obesity. Still in this context, in oxidant conditions, obesity may favor the development of insulin resistance by deregulating pro-inflammatory adipokines and cytokines31.
Hence, dietary antioxidant supplementation, especially of vitamin C, may be beneficial.
Little is known about the effects of vitamin C in prediabetes, especially because controlled DM2-prevention studies using vitamin C are still needed32. In the present study, both groups given
vitamin C had significantly lower fasting glycemia than the control group, demonstrating a glycemia-lowering effect of the vitamin. Likewise, groups VitC and C had similar glucose AUC. The AUC of the animals treated with invert sugar and vitamin C was lower than that of group IS. Both AUC showed that vitamin C reduced glucose intolerance. Leffa et al.29 found that the
group given vitamin C supplements or vitamin C-containing juices did not have smaller glucose AUC than the group treated with the cafeteria diet. Corroborating the present study, Al-Shamsi et al.5 found that 10mg/kg of vitamin C reduced
fasting glycemia and glucose AUC. However, higher doses of vitamin C (100mg/kg) did not have a glycemia-lowering effect5.
There is evidence that vitamin C can improve DM2-related endothelial dysfunction and improve insulin resistance by improving insulin signaling3,33. Another hypothesis for the ability of
study animals was not measured, but it would provide better evidence of the vitamin C effects found by the present study. Unlike humans, rats are capable of synthesizing vitamin C, even though most humans can easily consume the recommended daily dose of vitamin C. The present study was careful not to use a high dose of vitamin C, using only 0.5UL, taking into account the rat’s endogenous vitamin C production, as high doses of vitamin C (exceeding the UL) can adversely affect the animal’s health, promoting pro-oxidant effects2.
C O N C L U S I O N
Vitamin C intake by rats with prediabetes induced by invert sugar overload was anti-obesogenic and anti-hyperglycemic. This is an important finding given that epidemiological data have shown alarming rates of obesity with simultaneous increase of sugary beverages. These factors have increased the prediabetic population, and vitamin C can be a strategy to prevent the development of DM2 without the need of high doses. Additional studies are needed to understand the obesogenic and anti-hyperglycemic mechanisms of vitamin C in prediabetes.
A C K N O W L E D G M E N T S
Colleagues at the Laboratory of Histology and Pathology, Laboratory of Biotechnology, and Laboratory of Experimental Nutrition of Universidade de Santa Cruz
for help to sacrifice the animals.
C O N T R I B U T O R S
P MOLZ helped to conceive the study and experimental design, analyze and interpret data, and review the manuscript; AN RAEL and MQ FISCHER helped in the experimental design and reviewed the manuscript; LB LIMBERGER helped in the experimental design; D PRÁ helped to conceive the study and experimental design, and review the manuscript; SIR FRANKE helped to conceive the study and experimental design, interpret the data, and review the manuscript.
R E F E R E N C E S
1. Chambial S, Dwivedi S, Shukla KK, John PJ, Sharma P. Vitamin C in disease prevention and cure: An overview. Indian J Clin Biochem. 2013;28(4):314-28. https://doi.org/10.1007/s12291-013-0375-3 2. Franke SI, Pra D, Silva J, Erdtmann B, Henriques JA.
Possible repair action of Vitamin C on DNA damage induced by methyl methanesulfonate, cyclophosphamide, FeSO4 and CuSO4 in mouse blood cells in vivo. Mutat Res. 2005;583(1):75-84. https://doi.org/10.1016/j.mrgentox.2005.03.001 3. Garcia-Diaz DF, Lopez-Legarrea P, Quintero P,
Martinez JA. Vitamin C in the treatment and/or prevention of obesity. J Nutr Sci Vitaminol. 2014;60(6):367-79. https://doi.org/10.3177/jnsv. 60.367
4. Choi MK, Song HJ, Paek YJ, Lee HJ. Gender differences in the relationship between vitamin C and abdominal obesity. Int J Vitam Nutr Res. 2013;83(6):377-84. https://doi.org/10.1024/030 0-9831/a000179
5. Al-Shamsi M, Amin A, Adeghate E. The effect of vitamin C on the metabolic parameters of experimental diabetes Mellitus. Am J Pharmacol Toxicol. 2007;2(1):4-9. https://doi.org/10.3844/ ajptsp.2007.4.9
6. Styskal J, Van Remmen H, Richardson A, Salmon AB. Oxidative stress and diabetes: What can we learn about insulin resistance from antioxidant mutant mouse models? Free Radic Biol Med. 2012;52(1):46-58. https://doi.org/10.1016/j. freeradbiomed.2011.10.441
7. Rafighi Z, Shiva A, Arab S, Mohd Yousof R. Association of dietary vitamin C and e intake and antioxidant enzymes in type 2 diabetes Mellitus
patients. Glob J Health Sci. 2013;5(3):183-7. https:// doi.org/10.5539/gjhs.v5n3p183
8. Grundy SM. Pre-diabetes, metabolic syndrome, and cardiovascular risk. Am Coll Cardio Found. 2012;59(7):635-43. https://doi.org/10.1016/j.jacc. 2011.08.080
9. Pereira CS, Molz P, Palazzo RP, Freitas TA, Maluf SW, Horta JA, et al. DNA damage and cytotoxicity in adult subjects with prediabetes. Mutat Res. 2013;753(2):76-81. https://doi.org/10.1016/j. mrgentox.2013.02.002
10. Neeland IJ, Turer AT, Ayers CR, Powell-Wiley TM, Vega GL, Farzaneh-Far R, et al. Dysfunctional adiposity and the risk of prediabetes and type 2 diabetes in obese adults. JAMA. 2012;308(11):1150-9. https://doi.org/10.1001/ 2012.jama.11132
12. Malik VS, Hu FB. Sweeteners and risk of obesity and type 2 diabetes: The role of sugar-sweetened beverages. Curr Diab Rep. 2012;12(2):195-203. https://doi.org/10.1007/s11892-012-0259-6 13. Aller EEJG, Abete I, Astrup A, Martinez JA, van Baak
MA. Starches, sugars and obesity. Nutrients. 2011;3(3):341-69. https://doi.org/10.3390/ nu3030341
14. Sheludiakova A, Rooney K, Boakes RA. Metabolic and behavioural effects of sucrose and fructose/ glucose drinks in the rat. Eur J Nutr. 2012; 51(4):445-54. https://doi.org/10.1007/s00394-0 11-0228-x
15. Hafizur RM, Raza SA, Chishti S, Shaukat S, Ahmed A. A ‘Humanized’rat model of pre-diabetes by high fat diet-feeding to weaning wistar rats. Integr Obesity Diabetes. 2015;1(2):44-8. https://doi.org/ 10.15761/IOD.1000111
16. Yokoi N, Beppu M, Yoshida E, Hoshikawa R, Hidaka S, Matsubara T, et al. Identification of putative biomarkers for prediabetes by metabolome analysis of rat models of type 2 diabetes. Metabolomics. 2015;11(5):1277-86. https://doi.org/10.1007/ s11306-015-0784-9
17. Glendinning JI, Breinager L, Kyrillou E, Lacuna K, Rocha R, Sclafani A. Differential effects of sucrose and fructose on dietary obesity in four mouse strains. Physiol Behav. 2010;101(3):331-43. https:// doi.org/10.1016/j.physbeh.2010.06.003
18. Monsen ER. Dietary reference intakes for the antioxidant nutrients: Vitamin C, vitamin E, selenium, and carotenoids. J Am Diet Assoc. 2000;100:637-40. https://doi.org/10.1016/S0002-8 223(00)00189-9
19. Wade CE, Miller MM, Baer LA, Moran MM, Steele MK, Stein TP. Body mass, energy intake, and water consumption of rats and humans during space flight. Nutrition. 2002;18(10):829-36. https://doi. org/10.1016/S0899-9007(02)00914-0
20. Novelli EL, Diniz YS, Galhardi CM, Ebaid GM, Rodrigues HG, Mani F, et al. Anthropometrical parameters and markers of obesity in rats. Lab Anim. 2007;41(1):111-9. https://doi.org/10.1258/ 002367707779399518
21. Cinti S. The adipose organ. Prostaglandins Leukot Essent Fattys Acids. 2005;73(1):9-15. https:// doi.org/10.1016/j.plefa.2005.04.010
22. McClain D. Validation of models of cardiovascular disease in diabete. In: Animal models of diabetic complications consortium protocols. Augusta: Georgia Health Sciences University; 2003 [cited 2014 Dec 12]. http://www.diacomp.org/shared/ document.aspx?id=11&docType=Protocol 23. Chinachoti P. Carbohydrates: Functionality in foods.
Am J Clin Nutr. 1995;61(4Suppl.):922S-9S. 24. Hansson A, Andersson J, Leufven A. The effect of
sugars and pectin on flavour release from a soft
drink-related model system. Food Chem. 2001;72(3):363-8. https://doi.org/10.1016/S0308-8146(00)00243-0
25. Lehnen AM, Rodrigues B, Irigoyen MC, De Angelis K, Schaan BD. Cardiovascular changes in animal models of metabolic syndrome. J Diabetes Res. 2013;2013:761314. https://doi.org/10.1155/20 13/761314
26. He Q, Xiao L, Xue G, Wong S, Ames SL, Schembre SM, et al. Poor ability to resist tempting calorie rich food is linked to altered balance between neural systems involved in urge and self-control. Nutr J. 2014;13(2014):92. https://doi.org/10.1186/1475-2 891-13-92
27. Hu FB. Globalization of diabetes: The role of diet, lifestyle, and genes. Diabetes Care. 2011; 34(6):1249-57. https://doi.org/10.2337/dc11-0442 28. Olsen NJ, Andersen LB, Wedderkopp N, Kristensen PL, Heitmann BL. Intake of liquid and solid sucrose in relation to changes in body fatness over 6 years among 8- to 10-year-old children: The European Youth Heart Study. Obesity Facts. 2012;5(4):506-12. https://doi.org/10.1159/000341631
29. Leffa DD, Silva J, Daumann F, Dajori AL, Longaretti LM, Damiani AP, et al. Corrective effects of acerola (Malpighia emarginata DC.) juice intake on biochemical and genotoxical parameters in mice fed on a high-fat diet. Mutat Res. 2014;770:144-52. https://doi.org/10.1016/j.mrfmmm.2013.11.005 30. Carillon J, Romain C, Bardy G, Fouret G,
Feillet-Coudray C, Gaillet S, et al. Cafeteria diet induces obesity and insulin resistance associated with oxidative stress but not with inflammation: Improvement by dietary supplementation with a melon superoxide dismutase. Free Radic Biol Med. 2013;65:254-61. https://doi.org/10.1016/j.freerad biomed.2013.06.022
31. Bonnefont-Rousselot D. Obesity and oxidative stress: Potential roles of melatonin as antioxidant and metabolic regulator. Endocr Metab Immune Disord Drug Targets. 2014;14(3):159-68. https:// doi.org/10.2174/1871530314666140604151452 32. Christie-David DJ, Girgis CM, Gunton JE. Effects of vitamins C and D in type 2 diabetes Mellitus. J Nutr Diet Supp. 2015;2015(7):21-8. https://doi.org/10. 2147/NDS.S52022
33. Khodaeian M, Tabatabaei-Malazy O, Qorbani M, Farzadfar F, Amini P, Larijani B. Effect of vitamins C and E on insulin resistance in diabetes: A meta-analysis study. Eur J Clin Invest. 2015;45:1161-74. https://doi.org/10.1016/j.freeradbiomed.2013. 06.022
Received: May 24, 2016