http://dx.doi.org/10.1590/s2175-97902017000215197
A
r
*Correspondence: S.A.S.C. Faria. Departamento de alimentos de nutrição Experimental. Faculdade de Ciências Farmacêuticas. Universidade de São Paulo. Av. Prof. Lineu Prestes, 580, Bl. 14 - 05508-900 - São Paulo, SP – Brasil. E-mail: [email protected]
Vitamin K: content in food consumed in São Paulo, Brazil
Simone Aparecida dos Santos Conceição Faria
*, Vanilda Aparecida Soares de Arruda, Elias da Silva
Araújo, Marilene De Vuono Camargo Penteado
Department of Food and Experimental Nutrition, Faculty of Pharmaceutical Sciences, University of São Paulo
Recent research on Vitamin K has shown its importance in maintaining vascular and bone health. Brazilian food composition tables do not show phylloquinone content in national foods. These data are needed to obtain more reliable results in nutritional status assessment studies of individuals in relation to this vitamin as studies have shown a geographical inluence in food phylloquinone content. This study aims to determine phylloquinone (Vitamin K1) levels in its most important source: dark green leaved vegetables. Several varieties of vegetables were purchased directly from CEAGESP (General Warehouse Company of São Paulo) at diferent times. Phylloquinone was extracted using organic solvents and quantiied by High Performance Liquid Chromatography - HPLC. Results show the concentrations of phylloquinone in commonly consumed foodstufs. In general, results showed variations with data from literature on the amount of Vitamin K in the plants analysed.
Keywords: Phylloquinone/determination/leaf vegetables. Food composition. High Performance Liquid Chromatography. Vitamin K/study/Brazil. Cooking/Loss.
INTRODUCTION
Vitamin K is a fat-soluble vitamin that was originally identified as an essential factor in blood synthesis of
coagulation proteins (factors II, VII, IX, and X) (Booth,
Davidson, Sadowski, 1994).Several recent studies have demonstrated an important role in maintaining vascular and bone health through the Vitamin K-dependent proteins (Claussen et al., 2015; Viegas et al., 2014; Yamaguchi, 2014; Beulens et al., 2013; Booth, 2012). The natural forms of Vitamin K are: phylloquinone and menaquinone, the latter being synthesized by bacteria in the intestinal flora and known as “menaquinone-n” or Vitamin K2 (Booth, 2012; Penteado, 2003). Vitamin K1 (phylloquinone) is found in foods of both animal and vegetable origin, but is the only analogue of the vitamin present in plants, being predominantly found in vegetables and vegetable oils (Booth, 2012; Damon et al., 2005).
Although it is generally assumed that Vitamin K deiciency
is probably more common than previously believed, there are several questions about recommended adequate
intake (AI) levels and the true dietary requirement of
Vitamin K is unknown (Booth, 2012; Booth et al., 2003). The precise physiological functions of newly discovered Vitamin K proteins are not known except for the function of osteocalcin in bone growth regulation (Vermeer et al., 1996).It is also unclear which markers are best for evaluating Vitamin K status (Booth et al., 2003). With
the discovery of new roles for diferent forms of Vitamin
K, it is important to quantify their content in a variety of foods (Elder et al., 2006). In place of biological and chemical methods, the introduction of High Performance Liquid Chromatography (HPLC) has facilitated routine analysis of Vitamin K in foods (Otles, Cagindi, 2007; Pérez-Ruiz et al., 2007; Jakob, Elmadfa, 2000; 1996; Ferland, Sadawski, 1992). Recently, methods have been developed for determining Vitamin K levels in foods using High Performance Liquid Chromatography-Tandem Mass Spectrometry HPLC-MS/MS (Claussen et al., 2015) and Gas Chromatography-Mass Spectrometry GC-MS (Jang,
Moon, Shibamoto, 2015). Although, these methods ofer
high sensitivity and accuracy, they are very expensive for routine assays. However, separation and detection by
HPLC with electrochemical and luorescence detectors
of phylloquinone levels for nationally produced foods (Dôres, Paiva, Campana, 2001). There is therefore a need to analyse Vitamin K levels in foods grown in Brazilian soil to assist researchers in the nutrition area, as studies
have shown that geography can inluence phylloquinone
levels in analysed foods (Otles, Cagindi, 2007; Ferland, Sadawski, 1992). This study therefore aims to determine phylloquinone levels in its most important source: leafy green vegetables by HPLC fluorescence using post-column chemical reduction for Vitamin K derivatives.
MATERIAL AND METHODS
Samples
Samples were acquired directly from CEAGESP (São Paulo General Warehouse Company), the largest supply centre in Latin America (Brasil, 2010). Twenty
diferent leafy vegetables were collected between February
2011 and October 2012 and a “pool” of samples was set up with approximately 10 kg per collection for each vegetable type (Faria, 2013). The samples were analysed at the Food Analysis Laboratory of the Department of Food and Experimental Nutrition, Pharmaceutical Sciences Faculty, University of São Paulo. The day after collection sample pre-analysis preparation began following procedures described by Kawashima and Soares (2003). For vegetables that underwent a cooking process,
the procedures were as established by UNICAMP (2011)
according to vegetable characteristics: for broadleaf samples, baking time was 10 minutes and for floral samples, 20 minutes. About 300 g of each sample was weighed on an analytical scale. They were then placed in a 4-L stainless steel pan and 1.5 L of water added. Cooking was performed on a conventional stove, always using the
same stove with a medium lame. Cooking time began
when the water started boiling.
Analytical reference standards
Phylloquinone analytical standard and Vitamin K2, used as internal standards (IS), were purchased from the Sigma Chemical Co. (St. Louis, MO, USA). A stock
solution containing 20 μg/mL total phylloquinone in
hexane was prepared. A similar stock solution containing
of 20 μg/mL total IS in hexane was prepared. All
standard solutions were stored refrigerated (-20 °C) in amber Eppendorf tubes. Working standard solutions and subsequent dilutions for construction of the standard curve were prepared according to Gao and Ackman (1995). The concentration range was 0.052–2.08 µg mL-1 (n=10 points)
to determine the limit of detection (LOD) and limit of quantitation (LOQ) for the method. The whole procedure was protected from light.
The reagents used to prepare mobile phases and solutions for the standard curves were HPLC grades from Merck (Merck Millipore Corp., Germany). Ultra-pure water was obtained through a Milli-Q Plus Direct – Q3 system from Millipore. All standard and sample
solutions were iltered through a 13 mm diameter 0.45 µm pore size Millipore ilter unit prior to injection into
the chromatographic system. The mobile phases were
vacuum-iltered through 0.45µm pore size nylon Millipore ilter (FHLC04700) and degassed by ultrasonic bath for the required period before injection into the chromatographic
system.
HPLC analyses
The extraction and concentration of phylloquinone from food matrices used organic solvents with subsequent quantification by HPLC. Analysis was based on the methodology by Jakob and Elmadfa (2000; 1996) with an
adjustment in the extract puriication stage; after 5 minutes
centrifuging at 3000 rpm and 4 °C, the supernatant was
collected, iltered through a membrane, and transferred to a 50 mL evaporation lask and evaporated at 40 °C for
15 minutes using a rotary evaporator and vacuum system.
The residue was dissolved in 200 μL of mobile phase and 50 μL was injected. A Shimadzu HPLC included a
CBM-20A system (SCL-10AVP), LC-Solution Software,
a SIL-20A auto sampler, an LC-20AT isocratic pump, and an RF-10AXL luorescence detector. The separation was in reverse phase with a LiChrospher RP-18 5 μm endcapped
LiChroCART 250-4.6 column, with a pre-column from Merck and a mobile phase consisting of dichloromethane/ methanol (10:90 v/v) with the addition of 5ml of methanol solution with zinc chloride (1.37 g), sodium acetate (0.41 g) and acetic acid (0.30 g) per litre of mobile phase and
was pumped at a low rate 1.00 mL min -1 with isocratic
elution. The post-column reduction (20 x 4.0 mm id) was
illed manually with zinc dust p.a. grade from Merck with particles <45 μ, kept in a furnace (Shimadzu-CTO-6A) at 40 °C, with luorescence detector excitation 243 nm and
emission 430 nm.
Validation method
seven separate occasions. Procedures were performed to validate the method for: Linearity, Limit of Detection
and Quantiication, Precision, Accuracy, Selectivity and
Robustness (Lanças, 2004; Ribani et al., 2004; Youden, Steiner, 1975).
Statistical analysis
The experiments were conducted in a completely randomized way and all data were tested for normal distribution (Shapiro-Wilk’s test) and homogeneity of variance (Levene and Brown-Forsythe’s tests). For fresh vegetables analysed in nature, analyses of variance (ANOVA) were performed with a random factor followed by Bonferroni multiple comparisons (Neter, et al., 1996) to compare Vitamin K levels at two different times per sample. Vitamin K greenery from CEAGESP and American values were compared by using the Student t
test against a ixed value (Kirkwood, Sterne, 2006). The
results were expressed as means of results ± standard deviation. All statistical analyses were performed using
the STATISTICA 8.0 program with a signiicance level
of 5% (p<0.05).
RESULTS AND DISCUSSION
Vitamin K can be separated by normal and reverse
phase chromatography. In this work, the reversed-phase
C18 system was used as the chromatography column
showed good resolution on simultaneous separation of phylloquinone peaks. These conditions were also used by Otles and Cangindi (2007). The use of post-column reduction proved important for detection as no natural Vitamin K homologues emit fluorescence. Sample fluorescence was induced using a chemical reduction method employed by some authors to quantify Vitamin K in green vegetables (Pérez-Ruiz et at., 2007; Penteado, 2003; Kamao et al., 2005; Maccrehan, Schönberger,
1995). The method was stated to be speciic and linear in the range of 0.025-2.8 μg/mL (r=0.9997). Precision was
demonstrated by calibration curve standard deviation (SD=0.0088). The method is robust relative to changes in flow rate, column, and temperature. Detection and
quantitation limits were 0.0051 and 0.0157 μg/mL
respectively.
Selected method precision was tested and the accuracy of the selected methods was tested and phylloquinone recovery calculated by adding three standard levels (25, 50 and 100%). Standard recovery corresponded to 80% based on sample concentration.
Leafy vegetables occupy an important place in well
balanced diets with the most common leafy vegetables consumed raw in Southeast Brazil being lettuce, arugula,
and watercress, with cabbage, caulilower, endive, and
spinach used as cooked vegetables (Kawashima, Soares, 2003). The lack of information on the composition of Brazilian foods highlights the need for more data on the composition of leafy vegetables as these are present in the main meals of all social classes (Kawashima, Soares, 2003; Dôres, Paiva, Campana, 2001). Brazilian researchers explain that the national bibliography is quite sparse regarding Vitamin K; for this reason, it is necessary to carry out further studies and improve composition tables, to increase knowledge of Vitamin K levels in Brazilian foods (Klack, Carvalho, 2006; Dôres, Paiva, Campana, 2001).
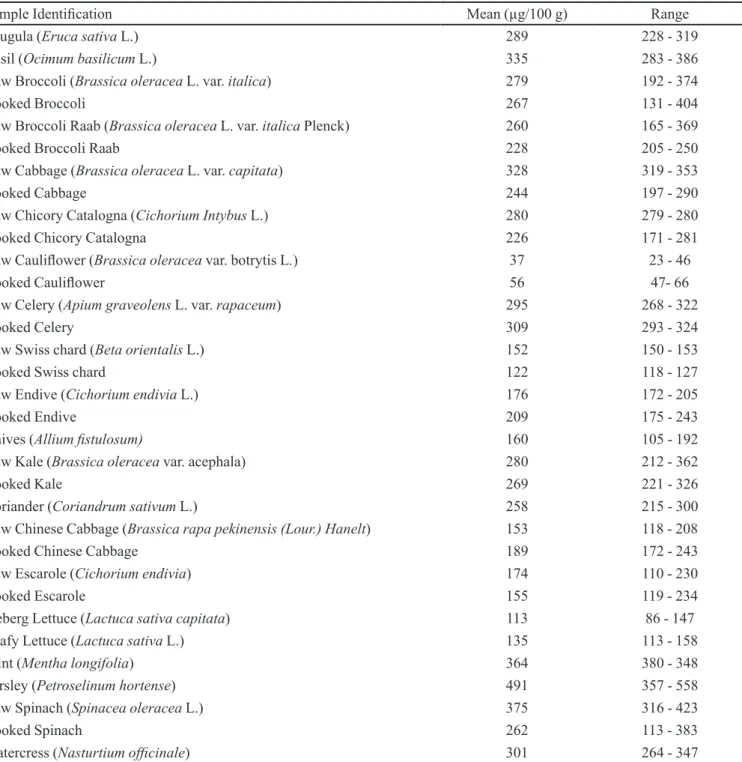
Table Ishows the means of triplicate data for both in nature and processed samples collected at CEAGESP
at diferent times of the year in 2011 and 2012. Results
show that higher levels of phylloquinone were found in raw leafy vegetables, which was present in those
with darker green leaves and/or darker lowers, such as
parsley, spinach, broccoli, kale, chicory catalogna, and watercress. These results agree with literature (Beulens et al., 2013; Booth, 2012) which mentions the group of dark green vegetables as foods rich in phylloquinone and state that this compound should be associated with tissues that perform photosynthesis, causing dark green vegetables with high chlorophyll concentrations to contain
the highest levels of the vitamin. In contrast, lower levels
were obtained in samples of cauliflower, lettuce, and chard; these vegetables are lighter green. Data from in nature vegetables were compared for diferent seasons of the year. These results generally showed statistical
diferences in Vitamin K levels for all samples. There was signiicant temporal variation in maximum and minimum
Vitamin K levels except for samples of chicory catalogna
279-280 μg/100 g and chard 150-153 μg/100 g. This
variation factor was particularly accentuated in broccoli which presented high and low mean vitamin values of
374 μg and 192 μg/100 g, in broccoli raab of 369 and 165 μg/100 g, and in spinach of 383 and 113 μg/100 g.
For the latter, drastic temperature changes during the year cause prolonged periods of drought and irregular rainfall – conditions which have also been cited by Kawashima and Soares (2003) to explain the variations in mineral content found in samples of fresh leafy vegetables such as lettuce, kale, spinach, cabbage and chicory purchased from markets in Southeast Brazil.
Regarding processed samples, the aim was to reproduce the domestic practice of heat treatment for
products such as leafy and loral vegetables commonly used in Brazilian cuisine (UNICAMP, 2011).Table I
shows the influence of domestic processing on total phylloquinone content for the evaluated vegetables.
In most cases the cooking process produced losses in
TABLE I -Concentration of phylloquinone in fresh and processed vegetables
Sample Identiication Mean (µg/100 g) Range
Arugula (Eruca sativa L.) 289 228 - 319
Basil (Ocimum basilicum L.) 335 283 - 386
Raw Broccoli (Brassica oleracea L. var. italica) 279 192 - 374
Cooked Broccoli 267 131 - 404
Raw Broccoli Raab (Brassica oleracea L. var. italica Plenck) 260 165 - 369
Cooked Broccoli Raab 228 205 - 250
Raw Cabbage (Brassica oleracea L. var. capitata) 328 319 - 353
Cooked Cabbage 244 197 - 290
Raw Chicory Catalogna (Cichorium Intybus L.) 280 279 - 280
Cooked Chicory Catalogna 226 171 - 281
Raw Caulilower (Brassica oleracea var. botrytisL.) 37 23 - 46
Cooked Caulilower 56 47- 66
Raw Celery (Apium graveolens L. var. rapaceum) 295 268 - 322
Cooked Celery 309 293 - 324
Raw Swiss chard (Beta orientalis L.) 152 150 - 153
Cooked Swiss chard 122 118 - 127
Raw Endive (Cichorium endivia L.) 176 172 - 205
Cooked Endive 209 175 - 243
Chives (Allium istulosum) 160 105 - 192
Raw Kale (Brassica oleracea var. acephala) 280 212 - 362
Cooked Kale 269 221 - 326
Coriander (Coriandrum sativum L.) 258 215 - 300
Raw Chinese Cabbage(Brassica rapa pekinensis (Lour.) Hanelt) 153 118 - 208
Cooked Chinese Cabbage 189 172 - 243
Raw Escarole (Cichorium endivia) 174 110 - 230
Cooked Escarole 155 119 - 234
Iceberg Lettuce (Lactuca sativa capitata) 113 86 - 147
Leafy Lettuce (Lactuca sativa L.) 135 113 - 158
Mint (Mentha longifolia) 364 380 - 348
Parsley (Petroselinum hortense) 491 357 - 558
Raw Spinach (Spinacea oleracea L.) 375 316 - 423
Cooked Spinach 262 113 - 383
Watercress (Nasturtium oicinale) 301 264 - 347
Analyses carried out in triplicate and results expressed as mean ± SD = Standard Deviation. Samples that have undergone the
phylloquinone content compared to the raw values with some samples such as spinach, broccoli and cabbage showing losses of up to 30% indicating consumption in the raw form would provide better utilization of the vitamin. Kale samples lost an average of 1.15% of phylloquinone,
indicating practically no loss was sufered from the efects
of cooking. Chicory, cauliflower and celery samples showed higher levels of the vitamin in processed samples than their raw counterparts; we can therefore conclude that the cooking process favoured higher vitamin extraction due to disrupting the cell membranes of the food matrices by heating leaving the compound of interest more exposed thus facilitating its extraction. This factor was also reported by Gliszczynska-Swiglo et al. (2006) in a study evaluating cooking by boiling
vegetable samples. The diferentiated behaviour observed
in relation to vitamin content of samples which have experienced the cooking process may have been caused by the loss or amount of water incorporated by the samples
through the process. The efects of cooking by steam and
microwave on phytochemical substances (polyphenols, carotenoids and ascorbic acid) in foods such as fresh fruits and vegetables have been extensively studied with both positive and negative effects reported depending on differences in process conditions, morphology, and nutritional characteristics of different plant species (Mazzeo et al., 2011; Pellegrini et al., 2010; Miglio et al., 2008; Gliszczynska-Swiglo et al., 2006; Turkmen, Sari, Velioglu, 2005). Mazzeo et al. (2011) evaluated the efects
of steaming and boiling spinach and caulilower samples
and reported that both treatments showed significant changes in the nutritional composition both vegetables. Pellegrini et al. (2010)demonstrated that diferent thermal household processes increased the bioavailability of polyphenols and carotenoids, highlighting the positive role of cooking on the nutritional qualities of vegetables. These
improvements ofered by heat treatment in vegetables were
also reported by Damon et al. (2005) and Miglio et al. (2008). Pellegrini et al. (2010) reported that the absorption
eiciency of phylloquinone can vary substantially and
be less efficient when the food is eaten raw because the vitamin is intimately linked to the thylakoid and chloroplast membranes in the cells of these plants. Absorption is most efficient when foods are ingested processed because breaking the food matrix promotes increased bioavailability of many phytochemicals thereby improving the nutritional quality of the plants.
The authors also emphasize that existing data on diferent
methods of thermal vegetable processing are fragmented
and incomplete making it diicult to make comparisons
between studies.
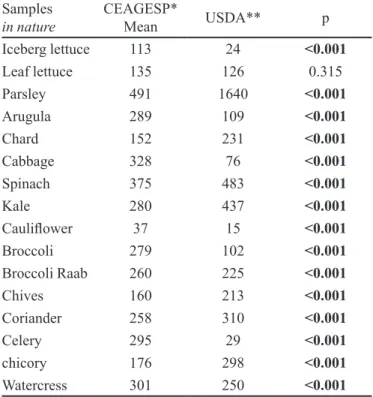
Evaluation of phylloquinone levels in samples collected at CEAGESP compared to those of USDA.
Table IIpresents the mean of triplicate samples collected
at CEAGESP during diferent seasons of 2011 and 2012
compared to levels for the same vegetables in the USDA database.
Table II shows that only raw leafy lettuce has statistically the same amount of phylloquinone (p>0.05) as online data from the United States Department of Agriculture - USDA. Parsley, chard, spinach, kale, chives, coriander, and chicory samples sourced from CEAGESP have lower vitamin content, and iceberg lettuce, arugula,
cabbage, caulilower, broccoli, celery and watercress have
higher vitamin content than online USDA data (p<0.05).
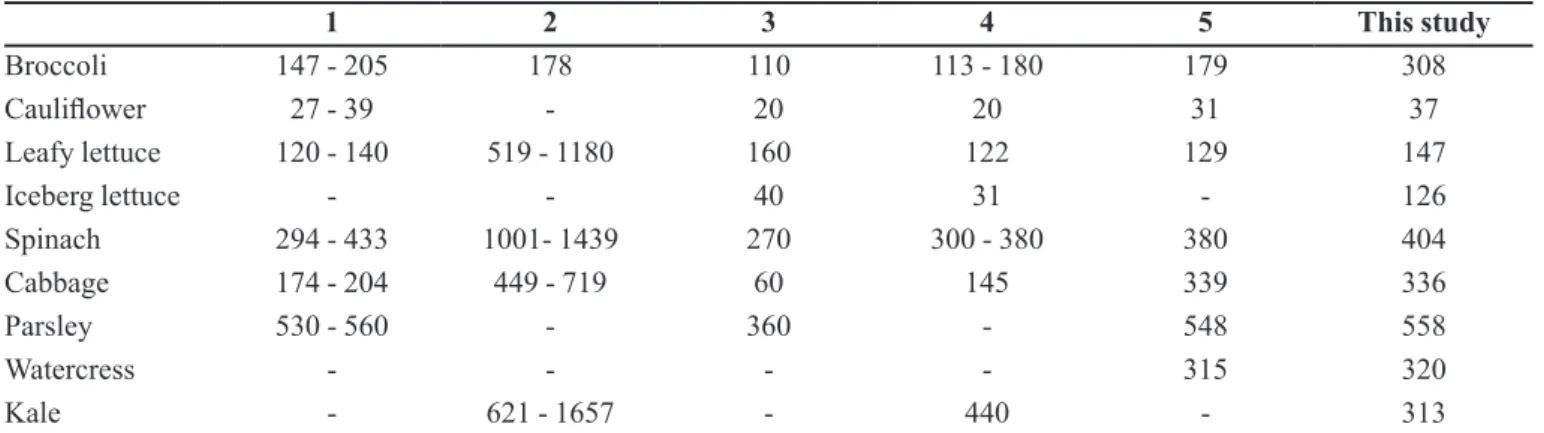
Table III shows data from other studies and highlights
significant variations in phylloquinone content for the same vegetables. As described here and by other authors,
diferences in phylloquinone levels for certain vegetables
according to geographic location suggest that levels of
this vitamin may be inluenced by growing conditions,
soil, climate, and agricultural tracts (Booth, 2012; Klack, Carvalho, 2006).
TABLE II – Comparison between Brazilian and American
phylloquinone concentration data in fresh vegetables (µg/100 g)
Samples
in nature
CEAGESP*
Mean USDA** p
Iceberg lettuce 113 24 <0.001
Leaf lettuce 135 126 0.315
Parsley 491 1640 <0.001
Arugula 289 109 <0.001
Chard 152 231 <0.001
Cabbage 328 76 <0.001
Spinach 375 483 <0.001
Kale 280 437 <0.001
Caulilower 37 15 <0.001
Broccoli 279 102 <0.001
Broccoli Raab 260 225 <0.001
Chives 160 213 <0.001
Coriander 258 310 <0.001
Celery 295 29 <0.001
chicory 176 298 <0.001
Watercress 301 250 <0.001
* Triplicate results from GEACESP samples analysed at
diferent times of the year in 2011 and 2012. **USDA - United
Table III compares phylloquinone content in
vegetables from this study with other data from literature. Knowledge on Vitamin K in food is very important in studies which evaluate the relationship between dietary vitamin intake and nutritional status of the individual.
Signiicant variations can be seen in consumption levels for this vitamin in diferent studies: Booth et al. (2004) analysing Vitamin K intake and bone mineral density in
men and women, observed a consumption of 171 μg/day for women and 153 μg/day for men. However, average
phylloquinone consumption in The Rotterdam Study was
244 μg/day for women and 257 μg/day for men (Geleijnse
et al., 2004). The discrepancies between Vitamin K levels
in diferent food composition tables may relect the results
of these studies on the intake of this vitamin. Research has shown that Vitamin K has been inadequately studied; one of the biggest issues is related to the food composition tables presenting large variations in Vitamin K levels for the same food. Researchers emphasize that geographical
diferences in food composition data should be considered
when applying database composition values for regional surveys (Booth, 2012; Souza, Rodrigues, Penteado, 2012; Klack, Carvalho, 2006; Dôres, Paiva, Campana, 2001). For this reason, further studies are needed to improve composition tables and increase knowledge on
Vitamin K levels in Brazilian foods. In summary, the
results of this study show variations in phylloquinone content between analysed samples and data described in international literature for the same vegetables; this can
be explained by the inluence of geographical diferences.
The validation procedure for the analysis method used in
this study was efective and can be used in determining
phylloquinone levels in leafy vegetable samples. The processing of leafy vegetables by cooking caused changes in phylloquinone levels compared to fresh samples. Most
vegetables obtained in spring showed the highest levels of phylloquinone.
ACKNOWLEDGEMENTS
The authors would like to thank São Paulo Teaching and Research Foundation Support - CNPq (the
Brazilian National Council Scientiic and Technological Development) for their inancial support.
REFERENCES
BEULENS, J.W.J.; BOOTH, S.L.; VAN DEN HEUVEL,
E.G.H.M.; STOECKLIN, E.; BAKA, A.; VERMEER, C.
The role of menaquinones (Vitamin K2) in human health.
Brit. J. Nutr., v.110, n.8, p.1-12,2013.
BOLTON-SMITH, C.; PRICE, R.J.G.; FENTON, S.T.; HARRINGTON, D.J.; SHEARER, M.J. Compilation of
provisional UK database for the phylloquinone (Vitamin K1)
content of foods. Brit. J. Nutr., v.83, n.4, p.389-399,2000.
BOOTH, S.L. Vitamin K: food composition and dietary intakes.
J. Food Nutr., v.56, p. 5505,2012.
BOOTH, S.L.; GOLLY, I.; SACHECK, J.M.; ROUBENOFF,
R.; DALLAL, E.G.; HAMADA, K.; BLUMBERG, J.B.
Efect of vitamin E supplementation on Vitamin K status
in adults with normal coagulation status. Am. J. Clin. Nutr., v.80, n.1, p.143-148.2004.
BOOTH, S.L.; MARTINI, L.; PETERSON, J.W.; SALTZMAN,
E.; DALLAL, G.E.; WOOD, R.J. Dietary phylloquinone depletion and repletion in older women. J. Food Nutr., v.133, n.8, p.2565-2569,2003.
TABLE III – Comparison between diferent studies for phylloquinone content in vegetables (µg/100 g)
1 2 3 4 5 This study
Broccoli 147 - 205 178 110 113 - 180 179 308
Caulilower 27 - 39 - 20 20 31 37
Leafy lettuce 120 - 140 519 - 1180 160 122 129 147
Iceberg lettuce - - 40 31 - 126
Spinach 294 - 433 1001- 1439 270 300 - 380 380 404
Cabbage 174 - 204 449 - 719 60 145 339 336
Parsley 530 - 560 - 360 - 548 558
Watercress - - - - 315 320
Kale - 621 - 1657 - 440 - 313
1) Bolton-Smith et al., 2000 2) Ferland, Sadowski, 1992; 3) Koivu et al., 1997; 4) Booth, 2012 and Booth et al., 1994; 5) Shearer
BOOTH, S.L.; DAVIDSON, K.W.; SADOWSKI, J.A.
Evaluation of an HPLC method for the determination of phylloquinone (Vitamin K1) in various food matrices. J.
Agric. Food Chem., v.42, n.2, p.295-300,1994.
BRASIL. Ministério da Agricultura, Pecuária e Abastecimento.
PROHORT - Programa Brasileiro de Modernização do
Mercado Hortigranjeiro. Disponível em: <http://www.
ceasa.gov.br/index.php?pag=10>. Access: May 19, 2010.
CLAUSSEN, F.A.; TAYLOR, M.L.; BREEZE, M.L.; LIU, K.
Measurement of Vitamin K1 in commercial canola cultivars
from growing locations in north and south America using High-Performance Liquid Chromatography-Tandem Mass Spectrometry. J. Agric. Food Chem., v.63, p.1076-1081,2015.
DAMON, M.; ZHANG, N.Z.; HAYTOWITZ, D.B.; BOOTH,
S.L. Phylloquinone (Vitamin K1) content of vegetables. J.
Food Compos. Anal., v.18, n.8, p.751-758,2005.
DÔRES, S.M.C.; PAIVA, S.A.R.; CAMPANA, A.O. Vitamina
K: metabolismo e nutrição. Rev. Nutr., v.14, n.3, p.207-218, 2001.
ELDER, S.J.; HAYTOWITZ, D.B.; HOWE, J.; PETERSON,
J.W.; BOOTH, S.L. Vitamin K contents of meat, dairy, and fast food in the U.S. diet. J. Agric. Food Chem., v.54, n.2, p.463-467, 2006.
FARIA, S.A.S.C. Teores de vitamina K em hortaliças consumidas na cidade de São Paulo. 2013. 113f. Tese (Doutorado em Ciências dos Alimentos) - Faculdade de Ciências Farmacêuticas, Universidade de São Paulo, São Paulo, 2013.
FERLAND, G.; SADAWSKI, J.A. Vitamin K1 (phylloquinone)
content of green vegetables: Efects of plant Maturation and
geographical growth location. J. Agric. Food Chem., v.40, n.10, p.1874-1877, 1992.
GAO, Z.H.; ACKMAN, R.G. Determination of vitamin K1 in
canola oils by high performance liquid chromatography with menaquinone-4 as an internal standard. Food Res. Int., v.28, n.1, p.61-69,1995.
GELEIJNSE, J.M.; VERMEER, C.; GROBBEE, D.E;
SCHURGERS, L.J.; KNAPEN, M.H.; VAN DER MEER,
I.M.; HOFMAN, A.; WITTEMAN, J.C. Dietary intake of
menaquinone is associated with a reduced risk of coronary heart disease: the Rotterdam Study. J. Nutr., v.134, n.11, p.3100-3105, 2004.
GLISZCZYNSKA-SWIGLO, A.; CISKA, E.; PAULAK-LEMANSKA, K.; CHMIELEWSKW, J.; BORKOWSKW,
T.; TYRAKOWSKA, B. Changes in the content of health-promoting compounds and antioxidant activity of broccoli after domestic processing. Food Addit. Contam., v.23, n.11, p.1088-1098, 2006.
JAKOB, E.; ELMADFA, I. Rapid and simple HPLC analysis
of Vitamin K in food, tissues and blood. Food Chem., v.68, n.2, p.219-221, 2000.
JAKOB, E.; ELMADFA, I. Application of a simpliied HPLC
assay for the determination of phylloquinoone (Vitamin K1) in animal and plant food items. Food Chem., v.56, n.1,
p.87-91,1996.
JANG, H.S.; MOON, J-K.; SHIBAMOTO, T. Analysis and
antioxidant activity of extracts from broccoli (Brassica oleracea L.) Sprouts. J. Agric. Food Chem., v.63, n.4, p.1169-1174,2015.
KAWASHIMA, L.M.; SOARES, L.M.V. Mineral proile of raw
and cooked leafy vegetables consumed in southern Brazil.
J. Food Compos. Anal., v.16, n.5, p.605-611, 2003.
KAMAO, M.; SUHARA, Y.; TSUGAWA, N.; OKANO, T. Determination of plasma Vitamin K by high-performance
liquid chromatography with luorescence detection using
Vitamin K analogs as internal standards. J. Chromatogr. B., v.816, n.1-2, p.41-48,2005.
KIRKWOOD, B.R.; STERNE, J.A.C. Essential medical statistics. 2.ed. Malden: Blackwell Science, 2006.
KLACK, K.; CARVALHO, J.F. Vitamina K: metalobismo, fontes e interação com o anticoagurante varfarina. Rev. Bras. Reumatol., v.46, n.6, p.398-406,2006.
KOIVU, T.J.; PIIRONEN, V.I.; HENTTONEN, S.K.; MATTILA, P.H. Determination of phylloquinone in
vegetables, fruits, and berries by High-Performance Liquid Chromatography with eletrochemical detection. J. Agric. Food Chem., v. 45, n.12, p.4644-4649,1997.
LANÇAS, F.M. Validação de métodos cromatográficos de análise. 6. ed. São Carlos: Rima, 2004. v.1, 62p.
MACCREHAN, W.A.; SCHÖNBERGER, E. Determination of Vitamin K1 in serum using catalytic-reduction liquid
MAZZEO, T.; N’DRI, D.; CHIVARO, E.; VISCONTI, A.; FOGLIANO, V.; PELLEGRINI, N. Efect of two cooking
procedures on phytochemical compounds, total antioxidant capacity and colour of selected frozen vegetables. Food Chem., v.128, n.3, p.627-233, 2011.
MIGLIO, C.; CHIAVARO, E.; VISCONTI, A.; FOGLIANO, V.; PELLEGRINI, N. Efects of diferent cooking methods on
nutritional and physicochemical characteristics of selected vegetables. J. Agric. Food Chem. v.56, n.1, p.139-147, 2008.
NETER, J.; KUTNER, M.H.; NACHTSHEIM, C.J.;
WASSERMAN, W. Applied linear statistical models. Boston: WCB, McGraw-Hill, 1996. 1408p. (Irwin Series
in Statistics).
OTLES, S.; CAGINDI, O. Determination of vitman K1 content
in olive oil, chard and human plasma by RP-HPLC method with UV-Vis detection. Food Chem., v.100, n.3, p.1220-1222,2007.
PELLEGRINI, N.; CHIAVARO, E.; GARDANA, C.; MAZZEO, T.; CONTINO, D.; GALLO, M.; RISO, P.; FOGLIANO, V.; PORRINI, M. Efect of diferent cooking methods on color,
phytochemical concentration, and antioxidant capacity of raw and frozen brassica vegetables. J. Agric. Food Chem., v.58, n.7, p.4310-4312,2010.
PENTEADO, M.D.V.C. Vitaminas: aspectos nutricionais, bioquímicos, clínicos a analíticos. Barueri: Manole, 2003. v.1, 612p.
PÉREZ-RUIZ, T.; MARTÍNEZ-LOZANO, C.; GARCÍA, M.D.; MATÍN, J. High-performance liquid
chromatography-photochemical reduction in aerobic conditions for
determination of K vitamins using luorescence detection. J. Chromatogr. A., v.1141, n.1, p.67-72,2007.
RIBANI, M.; BOTTOLI, C.B.G.; COLLINS, C.H.; JARDIM, I.C.S.F.; MELO, L.F.C. Validação de métodos cromatográicos e eletroforéticos. Quim. Nova, v.27, n.5, p.771-780, 2004.
SHEARER, M.J.; BACH, A.; KOHLMEIER, M. Chemistry,
nutritional sources, tissue distribution and metobolism of Vitamin K with special reference to bone health. J. Nutr., v.126, n.4, p.1181S-1186S, 1996.
SOUZA, W.N.; RODRIGUES, M.L.; PENTEADO, M.D.V.C. Ingestão habitual de vitamina K em adultos e idosos. Rev. Nutr., v.25, n.4, p.507-515, 2012.
TURKMEN, N.; SARI, F.; VELIOGLU, Y.S. The effect of cooking methods on total phenolics and antioxidant activity of selected green vegetables. Food Chem. v.93, n.4, p.713-718, 2005.
UNIVERSIDADE ESTADUAL DE CAMPINAS. UNICAMP. TACO – Tabela de composição de alimentos. Núcleo de Estudos e Pesquisas em Alimentação. Campinas: NEPA, 2011. Disponível em: <https://www.unicamp.br/nepa/taco/ contar/taco_4_edicao_ampliada_e_revisada>. Acesso em: 05 Fev. 2011.
VERMEER, C.; GLJSBERS, B.L.MLG.; CRACIUN, A.M.;
DOOREN, M.M.C.L.G.; KNAPEN, M.H.J. Effects of Vitamin K on bone mass and bone metabolism. J. Nutr., v.126, Suppl. 4, p.1187S-1191S, 1996.
VIEGAS, C.S.B., HERFS, M.; RAFAEL, M.S.; ENRIQUEZ, J.L.; TEIXEIRA, A.; LUÍS, I.M.; HOOFD, C.M.R.; JOÃO, A.; MARIA, V.L.; CAVACO, S.; FERREIRA, A.; SERRA. M., THEUWISSEN, E.; VERMEER, C.; SIMES, D.C.
Gla-rich protein is a potential new Vitamin K target in cancer: Evidences for a direct GRP-mineral interaction. Biomed Res. Int., v.14, ID340216, 14p., 2014.
YAMAGUCHI, M. Osteoporosis treatment with functional
food factor: Vitamain K2. J. Osteopor. Phys. Act., v.2, n.1,
p.1-3,2014.
YOUDEN, W. J.; STEINER, E. H. Statistical manual of
Association of Oicial Analytical Chemists: oicial metods
of analysis of AOAC. Washington: AOAC, 1975. v.1, p.88.
Received for publication on 06th October 2015