Combining Distance and Force Measurements to
Monitor the Usage of Walker Assistive Devices
Abstract—This paper presents a measurement system that can be used to monitor the usage of walker assistive devices. The forces applied on the legs of the walker device are measured using low cost force sensing resistors and a light detection and ranging device is used to evaluate several gait kinematic parameters, such as, walking speed and walking stride length. To evaluate the right usage of the walker device two walker indexes, one related with the applied forces and the other related with walker gait phases, are introduced. The measurement system includes wireless communication capabilities that enable a local and remote supervision of the measuring data.
Keywords—walker assistive device; force measurements; distance measurements; kinematic parameters; walker risk indexes
I. INTRODUCTION
Topics related with people mobility are already of major importance today and this importance will be even greater in the near future. Not only for patients, during recovery periods, but also, and above all, for elderly people, the usage of assistive walking devices can extend significantly their autonomy and quality of life. Regarding statistics and previsions, it is estimated that by 2025 in United States and Canada 25 % of the population will be aged over 65 years older [1-3]. Moreover, it is expected that in the European Union, for year 2060, the life expectance for women and men will be around 89 and 84.5 years, respectively [4]. In this context, it is important to refer that a proper usage of mobility aiding devices by elderly people can provide significant cost savings of health and long-term care systems [5-7]. However, it must be underlined that harmful injuries [8-9] can result from a bad usage of mobility aiding devices, being important to monitor its right usage. Thus, it is important to develop measurement solutions that can be used to monitor balance and stability conditions of users of mobility aiding devices. Several authors already studied measurement solutions for this purpose [10-14] but some solutions are complex, expensive and the added value of the additional information that can be accessed is questionable in terms of walker day-by-day applications. Moreover, several alternative systems include accelerometer sensors to extract kinematic parameters, like the ones related with human gait, and those sensors require the usage of complex algorithms to improve measurement data accuracy [15-16]. The main novelties that can be mentioned in the proposed measurement systems includes its low cost and easy adaptability to existing walker devices, the capability to extract kinematic parameters based on optical distance measurements, the capability to detect unbalance conditions
and to detect, in real time, potential falling conditions. To obtain the experimental data, a prototype, based on a conventional walker with a four legs ground contact configuration, was implemented and used for testing purposes. It is important to refer that the measurement methods and technical solutions that are presented can be easily be applied to others mobility aiding devices, particularly, walkers with different ground contact configurations, namely wheeled walkers and rollators.
The paper is organized as follows: section two presents the proposed measurement solution and novelties; section three includes the hardware and software description of the
measurement system; section four includes the
experimental results and the last section, section five, draws the conclusions.
II. PROPOSED MEASUREMENT SOLUTION AND NOVELTIES
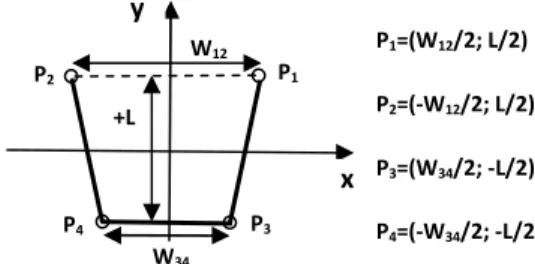
Considering the Cartesian plane associated with the coordinates of the pick-up walker legs, represented in Fig. 1, the center of pressure (COP) of the set of the four forces, each one associated with one leg of the walker device, is given by [17]:
=W12 FL1-FL2 +W34 FL3-FL4 2 FL1+FL2+FL3+FL4
=L FL1-FL3 + FL2-FL4 2 FL1+FL2+FL3+FL4
(1)
where FLk represents the force applied in each walker leg,
W12 and W34, represent the distances between the pair of
rear and front walker legs, respectively, that corresponds approximately to the walker width (W), and L represents the distance between the rear and front walker legs, that corresponds to the walker length.
Fig. 1. Cartesian plane associated with the coordinates of the pick-up walker legs (L- distance between front and rear legs, W12- distance
between rear legs, W34- distance between front legs).
The normalized deviation of the COP coordinates from the geometrical center of the polygon defined by the floor contacts of the walker legs can be used to define the following walker risk index:
x P1 P2
P3 P4
+L y
W34
W12 P1=(W12/2; L/2)
P2=(-W12/2; L/2)
P3=(W34/2; -L/2)
P4=(-W34/2; -L/2)
J.M. Dias Pereira
(1,2), Vítor Viegas
(1,2)(1) LabIM ESTSetúbal/IPS,
Escola Superior de Tecnologia de Setúbal do Instituto Politécnico de Setúbal, Setúbal, Portugal (2) Instituto de Telecomunicações, Lisbon, Portugal
Octavian Postolache
(2,3), Pedro Silva Girão
(2,4)(2) Instituto de Telecomunicações, Lisbon, Portugal (3) ISCTE-IUL, Lisbon, Portugal
where W and L represent the mean va width and the walker length, respectivel weighting factor, defined by:
where WUw represents the walker use
numerator of the fraction represents the t on the walker legs. The value of this fact 0 and 1 and its maximum value corresp situation that would occur if all the wei user was applied on the four walker legs.
A second parameter that can be use right usage of the walker device, and tha by another walker risk index (WRI2), c
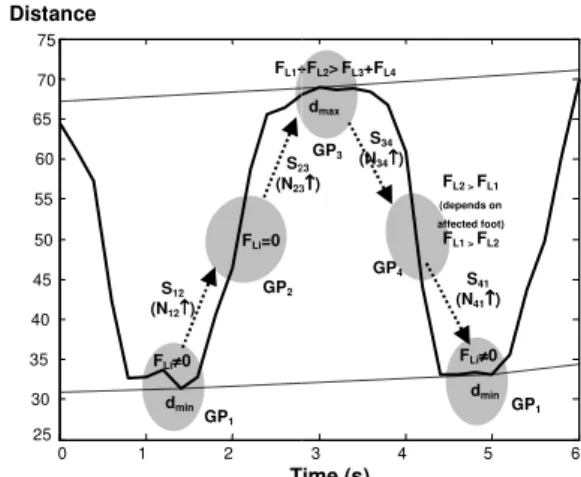
terms of the synchronization between w and user gait. Fig. 2(a) represents the w phases that occur in a correct usage of and Fig. 2(b) represents the state machin associated with the step to gait phases arrows are associated with normal gait st the dotted arrows are associated with ab transitions.
(a) Fig. 2. Gait phases: (a) walker step to gait pha affected foot; gray foot print- unaffected foot; da support limits; black circles- walker leg floor contac line of progression); (b) state machine diagram asso gait phases (continuous arrows- normal state tran abnormal state transitions).
Since, the transitions between the validated by the sensor outputs, that incl four force sensing resistors (FSR) and detection and ranging (LIDAR) distan possible to validate correct and incorrect during walker usage. If N12, N23, N34 and
number of normal state transitions associ S34 and S41, respectively, WRI2, can be de
where nsteps represents the number of st evaluated the WRI2, and Ntotal, represents
normal and abnormal, state transitions nsteps is configured by software and it equal 10. However, higher or lower va existing, obviously, a compromise betwe of the detection of risk events and their s The sum of the four temporization, t1 in the state diagram, corresponds to the ste
(2)
value of the walker ely, and (αFW) is a
(3)
ser weight and the e total force applied actor varies between esponds to the limit eight of the walker
sed to evaluate the hat can be measured can be defined in walker movements walker step-to gait f the walker device hine diagram that is es. The continuous state transitions and abnormal gait state
(b)
hases (black foot print- dashed polygon- base of tact; dotted line - walking ssociated with the step to ansitions; dotted arrows-
e stable states are clude the set of the nd the optical light tance sensor, it is ect phase transitions nd N41, represent the
ciated with S12, S23,
defined by:
(4)
steps that is used to nts the total number, ns. The coefficient its default value is values can be used, een the promptness r statistical meaning. 1 till t4, signalized
step duration.
The gray circles represente gait phases and the force and use to increment the counter correspondent state transition
Fig. 3. Increment of state transition c gait phases (gray circles).
III. MEASUREM
The main elements of the a set of four sensing resistor the associated signal conditi acquisition and transmission walker that was used for te following main characteristic (W12) equal to 52 cm, width b
to 51 cm, length between fron cm and a height adjustability increments of 2.5 cm. The wireless communication between the measurement sy walker device, and a remot Bluetooth-TTL transceiver m modules were designed and authors in previous applic integrated in the future in s platform.
A. Hardware
Fig. 4 depicts the position developed prototype. As it is restrictions that interfere with additional weight caused by in system is lower than 200 gf, weight associated with the bat
Fig. 4. Positioning of the sensing unit force sensing resistor; LIDAR- SCU+WTU+PU- signal conditionin units).
0 1 2
25 30 35 40 45 50 55 60 65 70 75
T Distance
dmin
FLi≠≠0≠≠
dmin
GP1
FL1+
FLi=0
GP2
S12
(N12↑↑↑↑)
S2
(N23
nted in Fig. 3 identifies the four nd distance conditions that are er (Nij) that is associated with
n (Sij).
counters (Nij↑) during the four walker
EMENT SYSTEM
e measurement system includes ors, an optical distance sensor, itioning circuits, and the data n units. The pick-up standard testing purposes [18] has the stics: width between rear legs between front legs (W34) equal
nt and rear legs (L) equal to 45 ty between 78 cm and 90 cm, in
n that supports the connection system that is installed on the ote Tablet PC, is based on a module [19]. These hardware nd successfully tested by the lications [20] and could be single Arduino or Raspberry
oning of the sensing units in the is clearly visible there are no ith the user movements and the integration of the measurement f, being almost half of the total
attery pack module.
nits in the four leg walker device (FSR- light detection and ranging unit; ng, wireless transmission and power
3 4 5 6
Time (s) dmax
dmin
FLi≠≠≠≠0
GP1
GP3
dmax
+FL2>FL3+FL4
GP4
FL2 > FL1 (depends on affected foot)
FL1 > FL2 23
23↑↑↑↑)
S34
(N34↑↑) ↑↑
S41
A.1 Force sensing resistors
A low-cost polymer thick film devi force sensing element [21]. The main cha FSR include a measuring force range o linearity error lower than 3% of FS, a r than 2.5% of full scale (FS), a hysteresis of FS and a response time lower than 5 diagram of the circuit that was used for s is represented in Fig. 5. A JFET [22] amplifier was used in order to take adv values of bias and offset currents that ar and 3 pA, respectively.
E=-5 V
-+
RF=100 k
+VCC
-VCC
RFSRi
Fig. 5. Basic current to voltage converter cir conditioning of the FSR sensors.
Assuming an ideal behavior of the OPA linear variation of the conductance of th amplitude, the output voltage V0i, asso
FSR, is given by:
!" # $
where G0i and mi are the coefficients of t
of the conductance of each FSR with fo issue that must be referred is that i characterize each FSR according to conditions. Thus, each FSR was calibrate mechanical fixture that was used for its co walker leg (see Fig. 6).
Fig. 6. Detail of the mechanical fixture that was us with the walker leg.
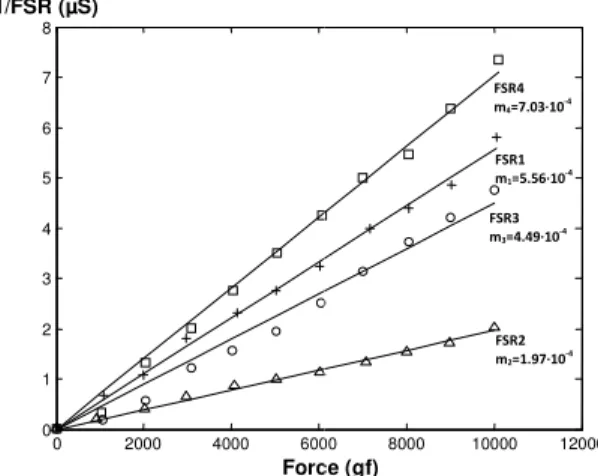
The calibration of each FSR was pe force amplitudes that vary between 0 precision balance, with an accuracy bette was used to measure the force amplitude the results that were obtained in the ca FSR. Since the resistance of every FSR that 50 M when no force is applied o linear interpolation of the conductance ( was performed, considered that the linea characteristic passes through the origin o can be easily verified, from the experim maximum ratio between the sensitivity c the different FSR, can be as high as 3.5 that it is essential to perform an individ each FSR.
vice was used as a characteristics of the of 100 lb (FS), a repeatability better sis lower than 4.5% 5 µs. The schematic r signal conditioning ] input operational dvantage of its low are equal to 30 pA
Voi
circuit used for signal
AMP circuit, and a the FSR with force ssociated with each
(5)
f the linear variation force. An important it is essential to o their real usage ated using the same connection with the
used to connect the FSR
performed applying 0 and 10000 gf. A tter than 20 gf [23], de. Fig. 7 represents calibration of each R is always higher on the sensor, the (GFSR) values, that
earized conductance n of the graph. As it rimental results, the coefficients (m), of 3.5, which confirms vidual calibration of
Fig. 7. FSR calibration results (m µS/gf).
A.2 LIDAR
A low-cost LIDAR device optical distance measureme associated with this device, us signals to improve the meas characteristic of the LIDAR wavelength of 905 nm, a ma 256 pulses, a pulse repetition better than 2.5 cm, a measur 40 m, much higher than application, an I2C communi output signal with a 10 µs relation between the pulse du is given by:
% & '
where D represents distance t represents the pulse duration o Fig. 8 represents the experim perform the characterization represented in Fig. 8, a plot 0.25% of effective recording the optical sensor. The positio better than 0.5 mm when usin range.
Fig. 8. Experimental setup that was us
Since the frequency of th lower than the LIDAR acqu perform a static characteriza represents the calibration resu measuring range between 10 a
0 2000 4000 600
0 1 2 3 4 5 6 7 8
Forc 1/FSR (µS)
m represent the straight line slope in
ice [24] was used to perform the ments. The LASER, that is uses pulsed light and modulated asurement accuracy. The main R device includes a working maximum pulse train length of on rate of 20 kHz, an accuracy urement range that can achieve the required value for our nication interface and a PWM µs resolution. The theoretical uration (Ton) and the distance
' (6)
e to be measured in cm and Ton n of the PWM signal in µs.
imental setup that was used to on of the LIDAR sensor. As lotter [25] with an accuracy of g span was used to characterize tioning accuracy of the plotter is sing its 50 mV/cm input voltage
used to characterize the optical sensor.
the measuring signal is much quisition rate, it is enough to ization of the device. Fig. 9 esults that were obtained, for a 0 and 100 cm.
00 8000 10000 12000
rce (gf)
FSR1 m1=5.56∙10
-4
FSR3 m3=4.49∙10-4
FSR2 m2=1.97∙10-4
Fig. 9. Static characterization results of the LIDAR device for distance varying between 10 and 100 cm.
Using a linear interpolation, the following relationship between distance and Ton is obtained:
D=0.1020 Ton-33.04 (7)
The offset error between theoretical and experimental results can easily be cancelled and results from the zero reference position of the LIDAR that is not equal to the one that was used for calibration purposes.
B. Software
Several MATLAB and LabVIEW software routines were developed for data acquisition and signal processing of measurement data. The software includes routines for measurement system calibration, storage of historical data and extraction of gait pattern parameters that are obtained from the force and distance sensors. Routines to detect unbalance conditions, walker risk indexes and gait phases identification, as well as the extraction of walking kinematic parameters, were also developed. The configuration of the measurement system include the following main parameters: age, height and weight of the walker user, number of measurement channels, data acquisition rate, criteria used to define walker risk indexes and warnings of potential unbalance conditions. A particular attention was dedicated to the software routine that was used to detect the maximum and minimum distance values in order to remove measurement data outliers and to evaluate correctly the walking kinematic parameters, such as, walking step length and walking speed. The peak detection function that was developed preserve the main features of the basic MATLAB findpeaks
function but the slope and amplitude thresholds parameters, as well as, smooth and fit width parameters, were constrained to the expectable limit values of the walking measurement data. Simple filtering signal processing routines were not used because some important gait patterns details could be lost and the temporal relation between distance and force signals must be preserved for a correct identification of the gait phase transitions.
IV. EXPERIMENTAL RESULTS
Several experimental results were performed with the walker prototype that was developed for testing purposes. The sensors were easily integrated in a commercial walker device without need of any modification in its mechanical structure. The FSR were installed in the terminal part of
each walker leg with an appropriate fixture that was inserted inside the walker leg rubber. The optical distance sensor was fixed in the frontal frame bar of the walker and the measuring beam was adjusted towards the walker user leg.
A. FSR tests
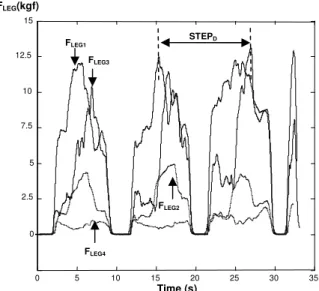
Using the calibration coefficients of the FSR, it is possible to obtain a real time measurement of the forces that are applied in each walker leg. As an example, Fig. 10 represents the intensity of the forces in each walker leg when the walker user simulates a gait pattern with a right affected foot. As it is clearly visible in the figure the intensity of the forces are higher on the left pair of legs of the walker (FLEG1 and FLEG3), being the force on the rear leg
(FLEG1) a little bit higher than the force on front leg (FLEG3).
These results were expected since the compression forces are greater in the opposite side of the affected foot [26].
Fig. 10. Intensity of the forces in each walker leg when the walker user simulates a gait pattern with a right affected foot.
Fig. 11 represents the variation of the walker risk index 1 (WRI1) for the set of forces previously represented. From
the distance measurements, it can be confirmed that the walker risk index (WRI1) is maximum when the walker
user advances its unaffected foot and applies maximum forces on the left side of the walker.
Fig. 11. Variation of the WRI1 for the set of forces represented in Fig. 10 (the walker user simulates a gait pattern with a right affected foot).
0 5 10 15 20 25 30 35
0 5 10 15 20 25 30 35
Time (s) WRI1 (%)
mean(WRI1)=16.5 %
std(WRI1)=4.8 %
max(WRI1)=33.3 %
min(WRI1)=0.12 %
0 5 10 15 20 25 30 35
0 2.5 5 7.5 10 12.5 15
FLEG(kgf)
FLEG4
FLEG1
FLEG3
FLEG2
STEPD
Time (s)
400 600 800 1000 1200 1400 1600 1800 2000
0 20 40 60 80 100 120 140 160
B. LIDAR tests
Regarding the optical distance measurements, Fig. 12 and Fig. 13 represent the distance measurement data, and the associated step lengths, for a walker gait that contains 18 steps. A correct evaluation of the maximum and minimum distance values, for each step, was successfully achieved for different walking patterns after a right adjustment of the parameters of the findpeaks MATLAB function.
Fig. 12. Distance measurement values for a walker gait that contains 18 steps ( - maximum distances; minimum distances).
Fig. 13. Step lengths of the walker gait represented in the previous figure.
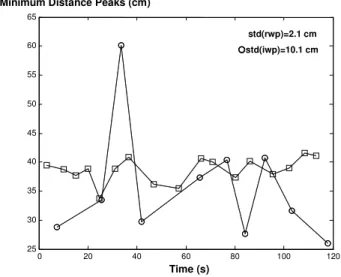
In order to compare the kinematic parameters that are obtained with different walking patterns, a second test was performed simulating a regular and an irregular walking pattern. The results, regarding the maximum and minimum distances values, obtained for each simulated walking pattern, are represented in Fig. 14 and Fig. 15. It is clearly visible from the results that the standard deviation of the step lengths are much higher in the simulated irregular walking pattern. In this example the ratio of the standard deviations of the maximum and minimum distances, associated with each walking pattern, are approximately equal to two and five, respectively.
Fig. 14. Maximum distance measurement values for walker gaits with two different patterns ( - irregular pattern; regular pattern).
Fig. 15. Minimum distance measurement values for walker gaits with two different patterns ( - irregular pattern; regular pattern).
Thus, the average value and the standard deviation of the maximum and minimum values of step lengths are, among others, two important parameter that can be used to classify the walker gait patterns. Other important parameter that can be easily accessed by the proposed measurement system, is based on the synchronization between walker and feet movements of the walker user that define proper evolution of the gait phases.
V. CONCLUSIONS
The experimental results that were obtained confirm that it is possible to monitor the right usage of walker assistive devices combining the measurement data from FSR and optical distance sensors. Using wireless transmission capabilities and the Internet, it is possible to use the proposed measurement system with patients that need to learn how to use correctly walker devices or to remotely supervise people that use regularly walker devices at home. Finally, it is important to refer that, although, the present paper assumes that a basic walker is used, the proposed measurement solution can be easily applied to other types of walker assistive devices, with appropriate adaptations. Future research work will be done in order to consider additional walker risk indexes related with physiologic demands, such as, the increase of user heart
0 20 40 60 80 100 120
25 30 35 40 45 50 55 60 65
Minimum Distance Peaks (cm)
Time (s)
std(rwp)=2.1 cm
std(iwp)=10.1 cm
0 20 40 60 80 100 120
60 65 70 75 80 85 90
Time (s) Maximum Distance Peaks (cm)
std(rwp)=4.1 cm
std(iwp)=9.1 cm
0 2 4 6 8 10 12 14 16 18
31 32 33 34 35 36 37 38 39
Step (index) Step Length
mean=35.5 cm
std=2.0 cm
0 10 20 30 40 50 60 70 80
25 30 35 40 45 50 55 60 65 70 75
rate or the increase of the oxygen consumption, that occur during the usage of every walker assistive device and additional field tests, with elderly people and patients with different diseases, are required to set a fine tuning between the walker risk indexes values and potential falling risks associated with loss of stability. It must also be underlined that besides centralized data processing of measurement data, self-warnings and alarms can also be signalized in the walker device if the walker indexes are out of their acceptance range, in terms of stability limits, or if their trend values are moving away from their average values, obtained from historical data.
ACKNOWLEDGEMENT
The work was supported by Fundação para a Ciência e
Tecnologia project: PTDC/DTP-DES/6776/2014, by
Instituto de Telecomunicacões and by ESTSetúbal/IPS. A special acknowledgement goes to the Erasmus student Achille Maingot that collaborated in the laboratory characterization of the LIDAR device.
REFERENCES
[1] Carrie A. Werner (2010). "The Older Population: 2010" (PDF). 2010 Census Briefs. U.S. Census Bureau. C2010BR-09.
[2] Taylor, Albert W.; Johnson, Michel J. (2008). Physiology of Exercise and Healthy Aging. Human Kinetics. ISBN 978-0-7360-5838-4.
[3] "Population". 2008 Older Americans : Key indicators of Well-Being. 2008.
[4] European Commission, "Summaries of EU Legislation", Available at:
http://europa.eu/legislation_summaries/employment_and_social_pol icy/situation_in_europe/c10160_en.htm [accessed Sept. 2014]. [5] S.R.Faruqui, T. Jaeblon," Ambulatory assistive devices in
orthopaedics: uses and modifications", J Am Acad Orthop Surg. Issue 18, No. 1, p.p. 41–50, 2010.
[6] H. Bateni, B.E. Maki, "Assistive devices for balance and mobility: benefits, demands, and adverse consequences", Arch Phys Med Rehabil, Issue 86, No. 1, pp. 134–145, 2005.
[7] NTT data, Global IT Innovator, "Trends in Telehealth", Available at:
http://americas.nttdata.com/Industries/Industries/Healthcare/~/medi a/Documents/White-Papers/Trends-in-Telehealth-White-Paper.pdf [accessed Sept. 2014].
[8] H. Bateni, B.E. Maki, "Assistive devices for balance and mobility: benefits, demands, and adverse consequences", Arch Phys Med Rehabil, Issue 86, No. 1, pp. 134–145, 2005.
[9] J.A. Stevens, K. Thomas, L. Teh, Greenspan et al, "Unintentional fall injuries associated with walkers and canes in older adults treated in U.S. emergency departments", J Am Geriatr Soc. Issue 57, No. 8, pp. 1464–1469, 2009.
[10] D.D. Ely, G.L. Smidt, “Effect of Cane on Variables of Gait for Patients with Hip”, Phys. Ther., No. 57, pp. 507-512, 1977. [11] Majd Alwan et al., “basic Walker-Assisted gait Characteristics
Derived from Forces and Moments Exerted on the Walker’s Handles: results on normal subjects”, Medical Engineering and Physics, No. 29, pp. 380-389, 2007.
[12] Alvaro Muro-de-la-Herran, Begonya Garcia-Zapirain and Amaia Mendez-Zorrilla, " Gait Analysis Methods: An Overview of Wearable and Non-Wearable Systems, Highlighting Clinical Applications", Sensors Review, 14, pp. 3362-3394, 2014. [13] Joel A. Delisa, Department of Veteran Affairs, "Rehabilitation
Reserach and Development Service", Chapter 2, pp. 11-32, 1981. [14] E.Sardini, M. Serpelloni, M. Lancini, Wireless Instrumented
Crutches for Force and Movement Measurements for Gait Monitoring", IEEE Transaction on Instrumentation and Measurement, Vol. 64, No. 12, pp. 3369-3379, Dec. 2015. [15] S.K. Keadle, E.J. Shirom, P.S. Freedson, I.M. Lee, "Impact of
accelerometer data processing decisions on the sample size, wear time and physical activity level of a large cohort study", BMC Public Health, 14:1210, 2014.
[16] I.M. Lee, E.J. Shiroma, " Using accelerometers to measure physical activity in large-scale epidemiological studies: issues and challenges", Br J Sports Med., 48(3), pp. 197-201., Feb. 2014.
[17] J.M. Dias Pereira, Octavian Postolache, Vítor Viegas, Pedro Silva Girão , ”A Low Cost Measurement System to Extract Kinematic Parameters from Walker Devices”, Instrumentation and Measurement Technology Conference (I2MTC), Vol. 1, pp. 1991-1996, 2015.
[18] Ayudas Dinâmicas, Model AD232. Available at: http://www.ayudasdinamicas.com/caminador-de-incorporacion/ [accessed Oct. 2016].
[19] MDFLY Electronics, Wireless Bluetooth TTL Transceiver Module. Available at: http:// www.mdfly.com [accessed Sept. 2014]. [20] J.M. Dias Pereira, Vítor Viegas, Octavian Postolache, Pedro Silva
Girão, “A Smart and Distributed Measurement System to Acquire and Analyze Mechanical Motion Parameters”, Metrology and Measurement Systems, Vol. 20, No. 3, pp. 465-478, 2013. [21] Interlink Electronics, "Force Sensing Resistors: integration guide
and evaluation parts catalog", Available at: http://www.interlinkelectronics.com [accessed Sept. 2014]. [22] Texas Instruments, LFx5x JFET Input Operational Amplifiers.
Available at: http://www.ti.com/lit/ds/symlink/lf357.pdf [accessed Oct. 2016].
[23] Mettler-Toledo Gmbh, "Mettler Toledo Spider 1S Scales", Switzerland, 1999.
[24] Pulsed Lite LLC, "LIDAR-Lite, Silver Label". Available: https://github.com/PulsedLight3D [accessed Oct. 2016].
[25] Yokogawa Hokushin Electric, YEW Model 3025 A4 X-Y Recorder. Available at: http://www.electro-meters.com/yokogawa/yokogawa-recorders/3025-2/ [accessed Oct. 2016].