Relative contribution of effects included in contemporary groups for adjusted
and actual 120-day and 210-day weights in Nelore cattle in Brazil
Lillian Pascoa
1, Arcadio de los Reyes
2, Mauricio A. Elzo
3, Jorge L. Ferreira
4, Luiz A.F. Bezerra
5and Raysildo B. Lôbo
51
Instituto Federal de Educação, Ciência e Tecnologia de Brasília, Campus Planaltina, Planaltina,
DF, Brazil.
2
Departamento de Produção Animal, Escola de Veterinária, Universidade Federal de Goiás, Goiânia,
GO, Brazil.
3
Department of Animal Sciences, University of Florida, Gainesville, FL, USA.
4
Universidade Federal do Tocantins, Araguaína, TO, Brazil.
5
Departamento de Genética, Faculdade de Medicina de Ribeirão Preto, Universidade de São Paulo,
Ribeirão Preto, SP, Brazil.
Abstract
The objective of this research was to estimate the relative magnitude of effects included in contemporary groups (CG) and their interactions with adjusted and actual 120 d and 210 d weights in 72,731 male and female Nelore calves born from 1985 to 2005 in 40 herds from PMGRN (Genetic Improvement Program of Nelore). Ten models with different CG structures were compared. The analyses were done using the general linear models (GLM) procedure run inSAS software. All of the effects included in the CG for each model were significant (p < 0.001) for the four traits analyzed. Inclusion of semester or trimester of birth as part of a CG was more appropriate than its use as an inde-pendent effect in the model because it accounted for interactions with the other effects in the CG. Calf sex (CS) and dam age at calving (DAC) had similar effects across the models, which suggested independence from other effects in these models. The corresponding age deviation effect had a larger impact on actual weight at 120 d than any other effect in all of the models tested. The use of actual weights in models with no CS effect in CG provides an alternative that would allow better genetic connectedness among CGs and greater accuracy in genetic evaluations.
Key words:beef cattle, models, preweaning growth.
Received: April 23, 2010; Accepted: June 15, 2011.
Introduction
Contemporary groups (CGs) are used in genetic eval-uations to eliminate bias caused by systematic environmen-tal effects such as differences in management, feeding and seasons (Van Vleck, 1987; Van Bebberet al., 1997; Cara-bañoet al., 2004; Cantetet al., 2005). However, a large number of CG can result in a small number of records per subclass, resulting in an increase in the variance of predic-tion errors and a reducpredic-tion in the accuracy of genetic evalu-ations (Van Vleck, 1987; Van Bebberet al., 1997).
The length of time to identify animals belonging to the same CG within a herd is controversial. A balance be-tween maximum accuracy and reduced bias must be achieved to optimize the definition of CG. The problem
with the usual definition of CG is its arbitrary definition of periods of time that do not correspond to criteria for maxi-mum accuracy and minimaxi-mum bias (Schmitz et al., 1991; Carabañoet al., 2004). In an attempt to resolve this problem several criteria to compare different definitions of CG that consider the estimated intra-CG variance, residual variance and accuracy of genetic evaluations have been proposed (Schmitzet al., 1991; Sivarajasingam, 1993; Van Bebberet al., 1997; Carabañoet al., 2004).
Brazil is known for its environmental diversity, with strong seasonal effects and fluctuations in pasture produc-tion that should be considered in the construcproduc-tion of CGs for genetic evaluation models (Fries and Ferraz, 2006). A significant influence in non-genetic effects and their inter-actions on growth in beef cattle has been widely proven in Brazil (Cardellino and Cardellino, 1984; Ponset al., 1989; Mascioliet al., 1996; Reyeset al., 1998, 2006; Pazet al., 1999; Cardosoet al., 2001; Bocchiet al., 2004).
Send correspondence to Lillian Pascoa. Instituto Federal de Edu-cação, Ciência e Tecnologia de Brasília, Campus Planaltina, Ro-dovia DF 128, km 21, Zona Rural, 73380-900 Planaltina, DF, Brazil. E-mail: [email protected].
Several studies have shown that a linear adjustment of weight to a constant age at weaning in beef cattle does not completely remove the effect of age (Rossiet al., 1992; Villalbaet al., 2000; Lobo and Martins Filho, 2002; Tei-xeira and Albuquerque, 2003; Reyeset al., 2004; Torres Júnior and Toral, 2006) because the age of the animal at weighing time influences its average daily gain and conse-quently its adjusted weight (Toralet al., 2007).
A model for genetic analysis should be preceded by careful study of systematic environmental effects and their interactions. The objective of this study was therefore to es-timate and compare the relative magnitudes of effects in-cluded in CGs and their interactions on adjusted and actual calf weights at 120 d and 210 d of age in Nelore cattle in Brazil.
Material and Methods
The dataset consisted of adjusted and actual (real) weights at 120 d (AW120, RW120) and 210 d (AW210, RW210) of age from 72,731 male and female Nelore calves born from 1985 to 2005 in 40 herds belonging to PMGRN (Genetic Improvement Program of Nelore). Actual weights were those within 120±60 d of age for RW120 and within
210±60 d of age for RW210, and the corresponding ages
were expressed as deviations (CAD – corresponding age deviations) for 120 d and 210 d, respectively. Standardized weights were obtained by interpolation using a weight be-fore and another after the standard age (120 d or 210 d), with a maximum interval of 195 d between them (±90 d
with a tolerance of 15 days because of possible changes in management). If there was no previous weight for AW120, then birth (either measured or the average of the breed: males = 33 kg and females = 31 kg) was used as the first weight for the interpolation. Computations were done in a manner similar to that used by PMGRN (Lôbo, 1996):
AW = W + [(W-Wp)/I] x (A – Aw)
where AW = adjusted weight at a standardized age (AW120 or AW210), W = nearest actual weight to a stan-dardized age, Wp = previous weight, I = days between W and Wp, A = standardized age (120 d or 210 d) and Aw = age at measurement of W.
The effect of dam age at calving (DAC) was classi-fied into six classes: 1 = 2 yr, 2 = 3 yr, 3 = 4 yr, 4 = 5 yr, 5 = 6-9 yr and 6 =³10 yr old. Five CG structures, with a
mini-mum of five records per subclass, were defined as follows: CG1: herd - year of birth - management group at each age. CG2: CG1- semester of birth.
CG3: CG1- trimester of birth. CG4: CG2- calf sex.
CG5: CG3- calf sex.
The GLM procedure of SAS was used to estimate the relative importance of effects included in CGs and their
in-teractions in 10 linear models. The structure of these models (M) was as follows:
M1: Weight =a+ CG1+ SB + CS + DAC +e M1A: Weight =a+ CG1+ TB + CS + DAC +e M1B: Weight =a+ CG1+ CS + DAC + JDB +e M1C: Weight =a+ CG1+ CS + DAC + JDB(CS) +e M2: Weight =a+ CG2+ CS + DAC +e
M3: Weight =a+ CG3+ CS + DAC +e M3A: Weight =a+ CG3+ CS + DAC(CS) +e M3B: Weight =a+ CG3+ CS + DAC + CAD(CS) +e M4: Weight =a+ CG4+ DAC +e
M5: Weight =a+ CG5+ DAC +e
where Weight = adjusted or actual weight at 120 d or 210 d of age,a= a constant, CG = contemporary group, SB =
se-mester of calf birth, TB = trise-mester of calf birth, CS = calf sex, DAC = class of dam age at calving (one of the six classes defined above), JDB = Julian date of calf birth, CAD = calf age deviation (deviation from 120 d or 210 d) ande= a residual. The CAD effect was modeled as a cubic
polynomial in all analyses using actual weights (RW120 and RW210).
The adjustability of the models was evaluated using an adjusted coefficient of determination (R2A= 1 - [residual mean square / total mean square]) and an estimate of the re-sidual variance. The contribution of each effect to the R2 coefficient for each model was computed as the ratio of the sum of squares due to each effect (Type I) and the total sum of squares.
Models for adjusted weights (AW120 and AW210) were defined as follows. Models M1to M1Cincluded the ef-fects of CG1, calf sex (CS), dam age at calving (DAC), and season of birth defined as semester of birth (SB, M1), tri-mester of birth (TB, M1A) and Julian date of calf birth (cu-bic polynomial; JDB, M1B), and Julian date of calf birth date nested within calf sex (cubic polynomial; JDB(CS), M1C). Model M2included CG2= CG1- SB, whereas models M3and M3Acontained CG3= CG1- TB, and these three models included the effects of CS and DAC; DAC was nested within CS in M3A. Model M4tested CG4= CG2- CS, model M5had CG5= CG3- CS, and both models included DAC. Models for actual weights (RW120 and RW210) contained the same effects as models for adjusted weights plus the effect of calf age at weight expressed as a deviation from 120 d or 210 d of age (CAD) as a cubic polynomial. This model was tested using M3B, where a cubic polyno-mial CAD effect was nested within CS.
Results and Discussion
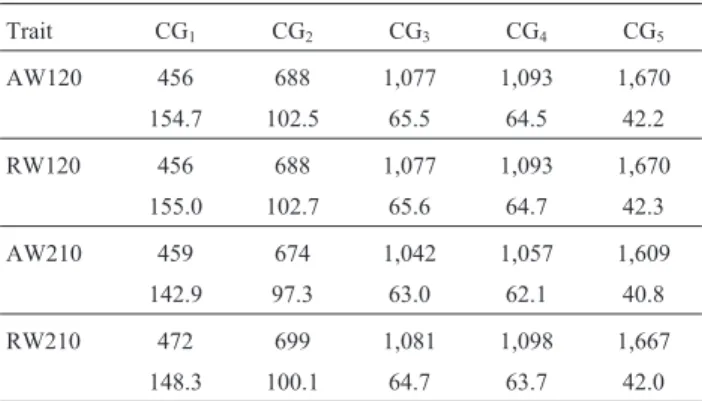
Table 2 shows the number of CGs and the mean num-ber of records per CG for the five CG structures defined here. For weight at 120 d the number of subclasses re-mained constant between the actual and standardized weights and the average size of the five CG structures was similar. On the other hand, for weight at 210 d, CG number and size were slightly larger for actual weights than for standardized weights in all five CG structures, possibly be-cause of management conditions in the herds where the ani-mals were located. A large proportion of aniani-mals was weighed before the standard age of 210 d and subsequently at ages beyond the maximum interval of 195 d (maximum interval allowed for standardization), thus explaining the difference between the actual weights and weights stan-dardized to 210 d.
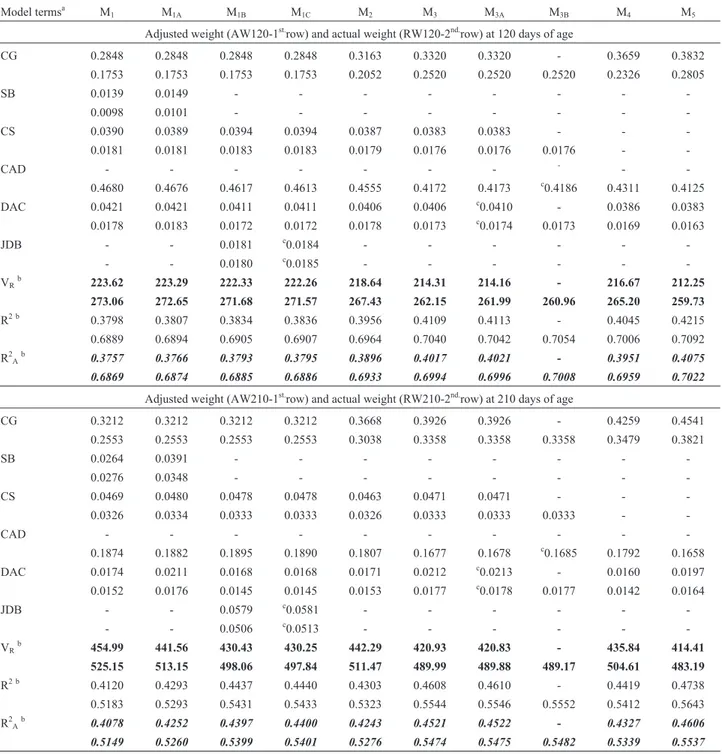
The relative contributions of each effect to the coeffi-cient of determination (R2) in each model are summarized in Table 3. All effects were significant (p < 0.001) for the four traits analyzed (AW120, AW210, RW120 and RW210).
The smallest contribution of seasonal effects was for SB (M1), the largest was for JDB (M1B), and the effect of TB (M1A) was intermediate between SB (M1) and JDB (M1B). Maximum R2A(%) differences for AW120, AW210, RW120 and RW210 were between those for M1Band M1 (0.4, 3.2, 0.2 and 2.5, respectively), and the corresponding maximum reductions in VR(%) were 0.6, 5.4, 0.5 and 5.2. These results clearly indicate that seasonal effects were more important for weight at 210 d of age than at 120 d of age, in agreement with the findings of Reyeset al.(1998) for adjusted weights at 120 d and 240 d of age in Nelore cat-tle.
The differences in R2A(%) between models M5and M1showed increases of 3.2, 5.03, 1.5 and 3.9, accompanied by reductions in VR(%) of 5.0, 8.9, 4.9 and 8.0 for AW120, AW210, RW120 and RW210, respectively. The differ-ences in R2A(%) between models M2and M1(1.4, 1.7, 0.6 and 1.3 for AW120, AW210, RW120 and RW210, respec-tively) reflected the contribution of interactions between SB and the other effects in CG.The contribution of interac-tions between TB and the rest of the effects contained in CG3were 2.5, 2.7, 1.2, and 2.1 for the same four traits (M3 -M1A). These values showed that interactions involving SB
(M1) and TB (M1A) were of similar importance and that in-clusion of some seasonal class effects within a CG would be more effective than their inclusion as an independent main effect (including as JDB) or the application of a cor-rection factor for these effects. Similar results were found by Reyeset al.(1998) for adjusted weights at 120 d and 240 d of age in Nelore cattle, and by Reyeset al.(2006) for preweaning growth in a multibreed Nelore x Hereford pop-ulation.
As shown in Table 2, CG2had only 62.9% of CG, but a mean CG size 58.9% larger than CG4for AW120; the cor-responding values for AW210, RW120 and RW210 were 63.8% and 56.7%, 62.9% and 58.7%, and 63.7% and 57.1%, respectively. Table 2 also shows that GC3 had 64.5% of CG and a mean CG size 55.2% larger than GC5 for AW120; the corresponding values for AW210, RW120 and RW210 were 64.8% and 54.4%, 64.5% and 55.1%, and 64.8% and 54.0%, respectively. Significant differences among the CG structures were accompanied by increases in R2A(%) between 0.26 (RW120) and 0.84 (AW210), and re-ductions in VR (%) between 0.83 (RW120) and 1.46 (AW210). These results identified models M2 (GC2 with SB) and M3(GC3with TB), both without CS in their CG but with R2A(%) differences between 0.61 (RW120) and 1.98 (RW210), as viable alternatives for use in genetic evalua-tions of preweaning growth traits.
Estimates of the effects of CS and DAC and their con-tributions to R2were similar for all traits in all models. The estimates for CS(%) were 3.9, 4.7, 1.8 and 3.3 for AW120, AW210, RW120 and RW210, respectively, and for DAC (%) they were 4.1, 1.9, 1.7 and 1.6, respectively. Sim-ilar estimates for CS and DAC were obtained for prewea-ning growth in Nelore x Hereford crosses (Reyes et al., 2006). These results indicated that CS and DAC were inde-pendent of the other effects in the models considered here for all four traits, and that, for both adjusted and actual weights, CS was more important than DAC at 210 d of age, Table 1- Number of observations and mean, minimum, maximum and
standard deviations of adjusted weights (AW) and actual weights (RW) in Nelore cattle at 120 d and 210 d of age.
Trait N Mean (kg) Min (kg) Max (kg) Std (kg)
AW120 70,543 124.8 54 218 18.9
RW120 70,677 128.3 34 276 29.5
AW210 65,607 181.2 73 307 27.7
RW210 69,978 182.7 57 327 32.9
Max = maximum, Min = minimum, N = number of observations, Std = standard deviation.
Table 2- Number of contemporary groups (1stline) and mean number of animals per contemporary group (2ndline) for adjusted weights (AW) and actual weights (RW) in Nelore cattle at 120 d and 210 d of age.
Trait CG1 CG2 CG3 CG4 CG5
AW120 456 688 1,077 1,093 1,670
154.7 102.5 65.5 64.5 42.2
RW120 456 688 1,077 1,093 1,670
155.0 102.7 65.6 64.7 42.3
AW210 459 674 1,042 1,057 1,609
142.9 97.3 63.0 62.1 40.8
RW210 472 699 1,081 1,098 1,667
148.3 100.1 64.7 63.7 42.0
whereas the opposite was true at 120 d of age. These results agreed with the expectation of an increase in the impor-tance of the sex effect and a decrease in maternal influence
as the animals grow older; they also support the current practice of including maternal effects when evaluating growth in young calves.
Table 3- Relative contribution of each effect to fitting of the models, expressed as a fraction of the coefficient of determination (R2) for adjusted weights (AW120 and AW210) and actual weights (RW120 and RW210) in Nelore cattle at 120 d and 210 d of age.
Model termsa M
1 M1A M1B M1C M2 M3 M3A M3B M4 M5
Adjusted weight (AW120-1st.row) and actual weight (RW120-2nd.row) at 120 days of age
CG 0.2848 0.2848 0.2848 0.2848 0.3163 0.3320 0.3320 - 0.3659 0.3832
0.1753 0.1753 0.1753 0.1753 0.2052 0.2520 0.2520 0.2520 0.2326 0.2805
SB 0.0139 0.0149 - - -
-0.0098 0.0101 - - -
-CS 0.0390 0.0389 0.0394 0.0394 0.0387 0.0383 0.0383 - -
-0.0181 0.0181 0.0183 0.0183 0.0179 0.0176 0.0176 0.0176 -
-CAD - - -
-0.4680 0.4676 0.4617 0.4613 0.4555 0.4172 0.4173 c0.4186 0.4311 0.4125
DAC 0.0421 0.0421 0.0411 0.0411 0.0406 0.0406 c0.0410 - 0.0386 0.0383
0.0178 0.0183 0.0172 0.0172 0.0178 0.0173 c0.0174 0.0173 0.0169 0.0163
JDB - - 0.0181 c0.0184 - - - - -
-- - 0.0180 c0.0185 - - - - -
-VR b
223.62 223.29 222.33 222.26 218.64 214.31 214.16 - 216.67 212.25
273.06 272.65 271.68 271.57 267.43 262.15 261.99 260.96 265.20 259.73
R2 b 0.3798 0.3807 0.3834 0.3836 0.3956 0.4109 0.4113 - 0.4045 0.4215
0.6889 0.6894 0.6905 0.6907 0.6964 0.7040 0.7042 0.7054 0.7006 0.7092
R2Ab 0.3757 0.3766 0.3793 0.3795 0.3896 0.4017 0.4021 - 0.3951 0.4075
0.6869 0.6874 0.6885 0.6886 0.6933 0.6994 0.6996 0.7008 0.6959 0.7022
Adjusted weight (AW210-1st.row) and actual weight (RW210-2nd.row) at 210 days of age
CG 0.3212 0.3212 0.3212 0.3212 0.3668 0.3926 0.3926 - 0.4259 0.4541
0.2553 0.2553 0.2553 0.2553 0.3038 0.3358 0.3358 0.3358 0.3479 0.3821
SB 0.0264 0.0391 - - -
-0.0276 0.0348 - - -
-CS 0.0469 0.0480 0.0478 0.0478 0.0463 0.0471 0.0471 - -
-0.0326 0.0334 0.0333 0.0333 0.0326 0.0333 0.0333 0.0333 -
-CAD - - -
-0.1874 0.1882 0.1895 0.1890 0.1807 0.1677 0.1678 c0.1685 0.1792 0.1658
DAC 0.0174 0.0211 0.0168 0.0168 0.0171 0.0212 c0.0213 - 0.0160 0.0197
0.0152 0.0176 0.0145 0.0145 0.0153 0.0177 c0.0178 0.0177 0.0142 0.0164
JDB - - 0.0579 c0.0581 - - - - -
-- - 0.0506 c0.0513 - - - - -
-VRb 454.99 441.56 430.43 430.25 442.29 420.93 420.83 - 435.84 414.41
525.15 513.15 498.06 497.84 511.47 489.99 489.88 489.17 504.61 483.19
R2 b 0.4120 0.4293 0.4437 0.4440 0.4303 0.4608 0.4610 - 0.4419 0.4738
0.5183 0.5293 0.5431 0.5433 0.5323 0.5544 0.5546 0.5552 0.5412 0.5643
R2Ab 0.4078 0.4252 0.4397 0.4400 0.4243 0.4521 0.4522 - 0.4327 0.4606
0.5149 0.5260 0.5399 0.5401 0.5276 0.5474 0.5475 0.5482 0.5339 0.5537
aFor each term: Adjusted weights (1st.row) and actual weights (2nd.row). CG = Contemporary group; (CG
1M1to M1C) = concatenation of herd – year of birth – management groups at 120 and 210 days of age; (CG2M2) = concatenation of CG1- semester of birth; (CG3M3to M3B) = concatenation of CG1 -trimester of birth. CS = calf sex. (CG4M4) = concatenation of CG2- CS; (CG5M5) = concatenation of CG3- CS. SB = season of birth, semester (M1), tri-mester (M1A), JDB = Julian date of calf birth (1 to 366 days, M1B); JDB(CS) M1C; CAD = calf age at weighing as deviation from 120 or 210 days; DAC = dam age at calving class (one of six classes as defined in the text); DAC(CS) M3A; CAD(CS) M3B.
bV
R= residual variance. R2= coefficient of determination of the model. R2A= adjusted R2= 1- (residual mean square / total mean square). c
Differences of 0.6, 0.8, 0.3, and 0.6 in R2A (%) be-tween models M4and M2and reductions in VR(%) of 0.9, 1.5, 0.8 and 1.4, for AW120, AW210, RW120 and RW210, respectively, represented the contribution of interactions between CS and the remaining effects inCG2. Similarly,
R2A(%) differences between models M5and M3and reduc-tions in VR(%) were attributable to the combined effect of interactions between CS and the other components of CG3. The corresponding values were 0.6, 0.9, 0.3 and 0.6 for dif-ferences in R2A(%) and 1.0, 1.6, 0.9 and 1.4 for reductions in VR(%) for AW120, AW210, RW120 and RW210, re-spectively. The low interaction between CS and other CG components in CG2and CG3relative to the main CS effect suggested that CS can be included as a class effect sepa-rately from CG, and that this will have a very small impact on the adjustment of records. In addition, an independent CS effect will decrease the number of CGs and increase their size, thereby increasing connectedness and the accu-racy of genetic evaluations. These results showed that esti-mates of CS were similar across models and reconfirmed the results for Nelore x Hereford cattle (Reyeset al., 2006).
Although significant, within sex estimates of DAC (M3A) and JDB (M1C) for all four traits, and of CAD (M3B) for actual weights did not show appreciable contributions
to the increase in R2A(< 0.1%) or to the reduction in VR (< 1 unit), suggesting that these effects would not need to be included in the usual models for genetic evaluation of preweaning growth traits where simple models are re-quired. Reyeset al.(2006) reached a similar conclusion for Nelore x Hereford cattle.
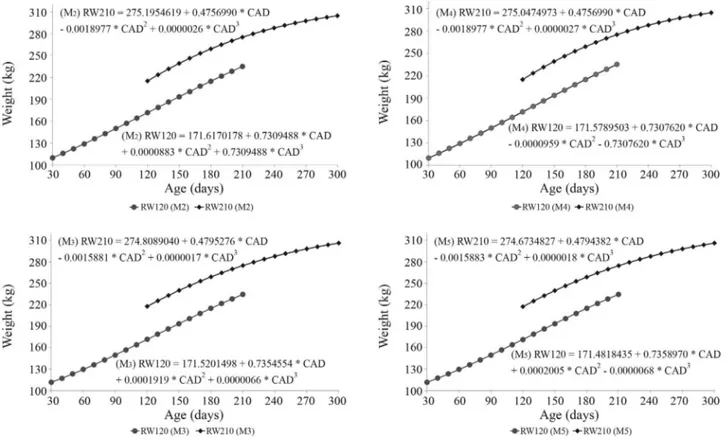
The contribution of the CAD effect was large relative to other effects in the CGs tested here. The CAD contrib-uted most to the increase in R2Aand the reduction in VR, and was one of the most important effects for weight at 210 d. Figure 1 shows the cubic polynomial regressions of calf ac-tual weights on days of age expressed as deviations from 120 d and 210 d, estimated using models M2, M3, M4and M5. The quadratic and cubic terms were significant (p < 0.05) for both traits in all models, reconfirming that the relationship between weight and age is not linear, in agree-ment with previous findings (Rossiet al., 1992; Lobo and Martins Filho, 2002; Reyeset al., 2004; Torres Júnior and Toral, 2006). Hence, the use of actual weights measured within an interval centered on a pre-established standard age, and inclusion of the effect of calf age in the analysis model provides an advantageous alternative for genetic evaluations.
In conclusion, the independence of calf sex effects from other effects in the CGs tested here suggests that this effect could be modeled separately from CG effects. This independence creates a promising alternative for modeling genetic analyses of preweaning growth traits that would in-crease the size of CGs and the accuracy of genetic predic-tions. The inclusion of semester or trimester of birth as part of a CG was more appropriate than independent estimates of these effects because it accounted for interactions with all other components of a CG. Estimates of Julian date of calf birth, dam age at calving, and calf age at weighing within calf sex suggested that genetic evaluation models for preweaning growth traits need not include these effects, which means that simpler models for these traits can be used. The use of actual weights in models that include a season of birth effect within CGs and model calf sex sepa-rately constitute alternatives that could improve genetic connectedness among CGs and help increase the accuracy of genetic evaluations.
References
Bocchi AL, Teixeira RA and Albuquerque LG (2004) Age of dam effect and month of birth effect onnelore‘s weaning weight in different brazilian regions. Acta Scient Anim Sci 26:475-482.
Cantet RJC, Birchmeier AN, Canaza Cayo AW and Fioretti C (2005) Semiparametric animal models via penalized splines as alternatives to models with contemporary groups. J Anim Sci 83:2482-2494.
Carabaño MJ, Moreno A, López-Romero P and Díaz C (2004) Comparing alternative definitions of the contemporary group effect in Avileña Negra Ibérica beef cattle using clas-sical and Bayesian criteria. J Anim Sci 82:3447-3457. Cardellino MV and Cardellino RA (1984) Environmental factors
on weight, weight gains and conformation at weaning of Hereford calves in Rio Grande do Sul – Brazil. Rev Bras Zootec 13:547-556.
Cardoso FF, Cardellino RA and Campos LT (2001) Environmen-tal factors that affect the performance from birth to weaning of Angus calves raised in the state of Rio Grande do Sul – Brazil. Rev Bras Zootec 30:1683-1688.
Fries LA and Ferraz JBS (2006) Beef cattle genetic programmes in Brazil. In: 8thWorld Congress on Genetics Applied to Livestock Production, Belo Horizonte.
Lôbo RB (1996) Programa de Melhoramento Genético da Raça Nelore. 2nd edition. ANCP, Ribeirão Preto, 104 pp. Lôbo RNB and Martins-Filho R (2002) Evaluation of body weight
standardization methods for 205, 365 and 550 days of age. Rev Bras Zootec 31:1695-1706.
Mascioli AS, Alencar MM and Barbosa PF (1996) Influence of environmental factors on weights of Canchim cattle. Rev Bras Zootec 25:853-865.
Paz CCP, Albuquerque LG and Fries LA (1999) Environmental effects on weight Gain from the birth to weaning period in Nellore breed cattle. Rev Bras Zootec 28:55-64.
Pons SB, Milagres JC and Teixeira NM (1989) Effects of genetic and environmental factors on growth and conformation
score in Hereford cattle in Rio Grande do Sul I. Weight and conformation score at weaning. Rev Bras Zootec 18:391-401.
Reyes A, Faria CU, Dias DSO, Brito RAM and Barbosa V (2004) Viés na padronização linear de pesos a idades constantes em bovinos de corte. In: V Simpósio da Sociedade Brasileira de Melhoramento Animal, Pirassununga.
Reyes A, Lobo RB, Bezerra LAF and Martins EN (1998) Critérios de época na conformação de grupos contemporâneos para características de crescimento em Nelore. In: Anais 35ª Reunião Anual de Sociedade Brasileira de Zootecnia, Botu-catu, v. 3, pp 437-439.
Rossi DJ, Kress DD, Tess MWB and Burfening PJ (1992) Cor-recting bias from the standard linear adjustment of weaning weight to an age-constant basis for beef calves. J Anim Sci 70:1333-1341.
Schmitz F, Everett RW and Quaas RL (1991) Herd-year-season clustering. J Anim Sci 74:629-636.
Sivarajasingam S (1993) Comparison of alternative methods of handling contemporary group effects in animal model pre-diction. J Anim Breed Genet 110:401-411.
Teixeira RA and Albuquerque LG (2003) Enviromental effects on preweaning daily gain in Angus, Hereford, Nellore and An-gus x Nellore and Hereford x Nellore crosses. Rev Bras Zootec 32:887-890.
Toral FLB, Alencar MM and Freitas AR (2007) Frequentist and bayesian approachs for genetic evaluation of Canchim beef cattle for growth traits. Rev Bras Zootec 36:43-53. Torres-Júnior RAA and Toral FLB (2006) Alternative methods
for the adjustment of weaning weights of beef cattle. In: 8th
World Congress on Genetics Applied to Livestock Produc-tion, Belo Horizonte.
Van Bebber J, Reinsch N, Junge W and Kalm E (1997) Account-ing for herd, year and season effects in genetic evaluation of dairy cattle: A review. Livestock Prod Sci 51:191-203. Van Vleck LD (1987) Contemporary groups for genetic
evalua-tions. J Dairy Sci 70:2456-2464.
Villalba D, Casasús I, Sanz A, Estany J and Revilla R (2000) Preweaning growth curves in Brown Swiss and Pirenaica calves with emphasis on individual variability. J Anim Sci 78:1132-1140.
Internet Resources
Reyes A, Elzo MA, Roso VM, Fries LA and Carvalheiro R (2006) Efeitos não genéticos na composição dos grupos contem-porâneos para o ganho de peso do nascimento a desmama de uma população multirracial Nelore x Hereford. 43ª Reunião Anual da Sociedade Brasileira de Zootecnia, João Pessoa, PB, Brazil. Available at http://www.animal.ufl.edu/ elzo/Publications/Proceedings/2006/Sociedad%20
Brazileira%20de%20Zootecnia/Reyes%20et%20al._SBZ4 3_July-24-27-2006_Trabalho_HOMEPAGE.pdf.
Associate Editor: Alexandre Rodrigues Caetano
License information: This is an open-access article distributed under the terms of the Creative Commons Attribution License, which permits unrestricted use, distribution, and reproduction in any medium, provided the original work is properly cited.