Clustering and artificial neural networks: Classification of variable lengths of
Helminth antigens in set of domains
Thiago de Souza Rodrigues
1, Lucila Grossi Gonçalves Pacífico
2, Santuza Maria Ribeiro Teixeira
2,
Sérgio Costa Oliveira
2and Antônio de Pádua Braga
11
Universidade Federal de Minas Gerais, Departamento de Engenharia Eletrônica,
Minas Gerais, MG, Brazil.
2
Universidade Federal de Minas Gerais, Departamento de Bioquímica e Imunologia,
Minas Gerais, MG, Brazil.
Abstract
A new scheme for representing proteins of different lengths in number of amino acids that can be presented to a fixed number of inputs Artificial Neural Networks (ANNs) speel-out classification is described.K-Means’s clustering of the new vectors with subsequent classification was then possible with the dimension reduction techniquePrincipal Component Analysis applied previously. The new representation scheme was applied to a set of 112 antigens sequences from several parasitic helminths, selected in the National Center for Biotechnology Information and classified into fourth different groups. This bioinformatic tool permitted the establishment of a good correlation with domains that are already well characterized, regardless of the differences between the sequences that were confirmed by thePFAM database. Additionally, sequences were grouped according to their similarity, confirmed by hierarchical clustering using ClustalW.
Key words:bioinformatics, artificial neural networks, clustering, helminth antigen, domain. Received: August 15, 2003; Accepted: August 20, 2004.
Introduction
Artificial Neural Networks (ANNs) and clustering techniques have been applied to genomic and proteomic studies in the last few years. One of the main difficulties in applying these techniques to protein sequence analysis is the variable length of the sequences and the high dimensionality. Since ANNs have a fixed number of inputs, classification of variable length sequences demands an ap-propriate representation in order to be processed.
Herein, we propose a new representation scheme for variable length high dimensional protein sequences to be applied to a set of pre-selected antigens. The principle of this new method is to create a fixed sizeimage matrix Mfor each protein sequence that represents the frequency of oc-currence of all pairs of amino acids. Regardless of the origi-nal sequence size, the new representation scheme consists of generating a vector with 400 elements for each antigen. In the present study, only pairs of amino acids were
consid-ered, but the method can be applied to higher dimension partitions of the input data.
After obtaining an image vector for each antigen, they were all mapped onto a lower dimensional space using
Principal Component Analysis(PCA) (Bragaet al., 2000), (Haykin, 1999). The reduced dimension data resulted in lower computational costs and visualization in two and three dimensions, without relevant loss in the original dis-tributions. In the experiment, the input dimension was re-duced to5(1.25% of the original dimension of matrixM). Clustering techniques such as K-Means (Linkas et al., 2003), (Bragaet al., 2000), and hierarchical clustering (Jain and Murty, 1999) were then applied to the reduced dimen-sion vectors. The clusters obtained with the reduced data were consistent with those generated by hierarchical clus-tering of the original sequences and also with that generated by ClustalW (EBI). A qualitative analysis of the domains present in the elements of each cluster generated by
K-Meanswas carried out taking into account the informa-tion available in thePFAMdatabase (PFAM). Most of the sequences grouped into the same cluster have the same do-main according toPFAM.
Send correspondence to Antônio de Pádua Braga. Universidade Federal de Minas Gerais, Departamento de Engenharia Eletrô-nica, Caixa Postal 209, 30161-970 Pampulha, Belo Horizonte, MG, Brazil. E-mail: [email protected].
Material and Methods
Data analysis
The data analysis and the new representation scheme were applied to a set of pre-selected sequences of19 differ-ent antigens from various helminth parasites, obtained from National Center for Biotechnology Information (NCBI). Table 1 presents19helminths and the corresponding num-ber of selected antigens of each one, resulting in 112 se-quences. The antigens chosen here were selected from the
NCBIdatabase. These antigens are molecules targeted for new vaccine diagnostic reagents and drug discovery. The majority of these proteins have known functions which al-low us to compare their classification usingK-Meanswith
PFAM.
The wide range of sequence sizes of the input data can be observed in Figure 1 that shows the number of amino ac-ids that compose the polypeptide for each antigen. There are small sequences with sizes as short as60as well as oth-ers ranging from400to800amino acids. In order to treat the current classification and clustering problems with
ANNs, it is necessary to define an appropriate coding scheme, which would make it possible to map the variable length of the data into the fixed size ANN inputs. The repre-sentation scheme presented here, was designed to over-come this difficulty.
Since the search for regularities in the input data could help in the new coding scheme, the data present in Figures 2 and 3 were generated. In Figure 2, the number of occurrences of each amino acid in all sequences is pre-sented and in Figure 3, the amino acid concentration along the sequences are presented. It was observed that there is no prominent amino acid among all antigens sequences. It was observed thatmethionineis concentrated at the beginning of the sequences, as expected, and alanine, lysine and
leucineappear in high concentrations, but well distributed along all antigens sequences. There were no new findings in the analysis of the input data that could help in the cre-ation of a coding scheme to represent sequences in a proper manner to deal withANNs. Thus, a general coding
proce-Figure 1- Length of the analyzed antigens.
Figure 2- Number of amino acids in the analyzed antigens.
Table 1- Helmiths and the number of sequences available for each one.
Helminth n Helminth n
Taenia solium 18 Trichinella spiralis 2
Taenia ovis 7 Taenia crassiceps 1
Schistosoma japonicum 13 Fasciola hepatica 4
Schistosoma haematobium 1 Nippostrongylus brasiliensis 4
Echinococcus multilocularis 13 Clonorchis sinensis 3
Echinococcus granulosus 22 Ascaris suum 2
Trichostrongylus colubriformis 2 Toxocara canis 1
Paragonimus westermani 1 Onchocerca volvulus 11
Trichuris trichiura 1 Nippostrongylus brasiliensis 5
dure was proposed, that can be applied to any sequence of amino acids, regardless of its origin, as shown in Material and Methods. As an extension of this new approach, Re-sults and Discussion shows the application of PCA and clustering byK-Meansto the coded input data.
Sequence coding by sliding window - SCSW
In order to maintain the same length for all antigens, regardless of the number of amino acids, the coding scheme proposed consists on building an Image MatrixMwith20
rows and20columns where eachrowandcolumnare asso-ciated with a different amino acid. Each matrix element Mij
contains the number of times the pair of amino acidsiandj
appear in the antigen being coded. In order to generate Im-age MatrixM, a sliding window that covers2amino acids at a time scans the sequence from the beginning to the end. For each pair of amino acids found, the corresponding ma-trix element is increased. The sliding window then shifts right one amino acid and counts the next pair, and so on.
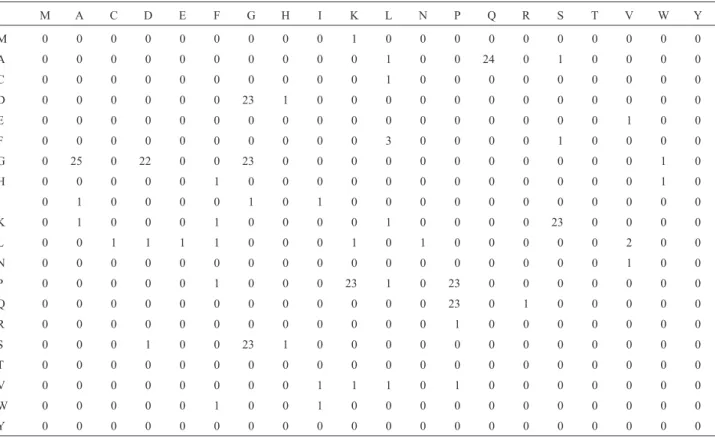
Figure 4 and Table 2 show one of the antigens from the helminthClonorchis sinensis (Yanget al., 2000) and the corresponding image matrix, respectively. It can be ob-served in Figure 4 that there are24occurrences of a pair of amino acidsAQ. The correspondent position in matrixMis represented by row2(amino acidA) and column 14 (amino acidoQ), which contains the value 24.
After all 112 antigens are coded, the 20 rows of each 20 by 20 matrix are transformed into a single vector with
400-elements. Finally, all 400-elements vectors are aligned, generating a matrix with 112 rows, each one repre-senting an antigen. Since all matrices are sparse, there is room for dimensionality reduction. As shown in the next section, the 112 by 400 matrix is reduced to a lower dimen-sional space by using Principal Component Analysis.
Dimensionality reduction and clustering
Due to the high dimensionality of input data, many problems may arise regarding computation time. There-fore, it is desirable to reduce the dimension to a manageable size, maintaining as much of the original information as possible. The sparseness of the image matrices indicates that dimensionality reduction would be possible without much loss of information. We have chosen Principal Componente Analysis (PCA) (Haykin, 1999), (Matthew and Calvo, 1998) to be applied in this study. Compared to other techniques for dimensionality reduction available in the literature, such asFactor Analysis(Fodor, 2002), Pro-jection Pursuit (Fodor, 2002) and Vector Quantization
(Gray, 1984), PCA has the advantage of conceptual sim-plicity, since it involves finding the best linear
transforma-Table 2- Image matrix.
M A C D E F G H I K L N P Q R S T V W Y
M 0 0 0 0 0 0 0 0 0 1 0 0 0 0 0 0 0 0 0 0
A 0 0 0 0 0 0 0 0 0 0 1 0 0 24 0 1 0 0 0 0
C 0 0 0 0 0 0 0 0 0 0 1 0 0 0 0 0 0 0 0 0
D 0 0 0 0 0 0 23 1 0 0 0 0 0 0 0 0 0 0 0 0
E 0 0 0 0 0 0 0 0 0 0 0 0 0 0 0 0 0 1 0 0
F 0 0 0 0 0 0 0 0 0 0 3 0 0 0 0 1 0 0 0 0
G 0 25 0 22 0 0 23 0 0 0 0 0 0 0 0 0 0 0 1 0
H 0 0 0 0 0 1 0 0 0 0 0 0 0 0 0 0 0 0 1 0
I 0 1 0 0 0 0 1 0 1 0 0 0 0 0 0 0 0 0 0 0
K 0 1 0 0 0 1 0 0 0 0 1 0 0 0 0 23 0 0 0 0
L 0 0 1 1 1 1 0 0 0 1 0 1 0 0 0 0 0 2 0 0
N 0 0 0 0 0 0 0 0 0 0 0 0 0 0 0 0 0 1 0 0
P 0 0 0 0 0 1 0 0 0 23 1 0 23 0 0 0 0 0 0 0
Q 0 0 0 0 0 0 0 0 0 0 0 0 23 0 1 0 0 0 0 0
R 0 0 0 0 0 0 0 0 0 0 0 0 1 0 0 0 0 0 0 0
S 0 0 0 1 0 0 23 1 0 0 0 0 0 0 0 0 0 0 0 0
T 0 0 0 0 0 0 0 0 0 0 0 0 0 0 0 0 0 0 0 0
V 0 0 0 0 0 0 0 0 1 1 1 0 1 0 0 0 0 0 0 0
W 0 0 0 0 0 1 0 0 1 0 0 0 0 0 0 0 0 0 0 0
Y 0 0 0 0 0 0 0 0 0 0 0 0 0 0 0 0 0 0 0 0
tion in the mean-square error sense (Fodor, 2002). In order to obtain this transformation and axes elimination, the method calculates first the cross-correlation matrix of the input data, which is then decomposed into a product of ma-trices that contains the singular values (Press, 1988), which are sorted according to their relevance. The most relevant axes associated with the larger singular values are main-tained, and the least relevant ones associated with the smaller singular values are discarded. The new coordinates system is formed only by the most relevant axes that result in dimension reduction.
Since the singular values have a smooth variation, as observed in Figure 5, there is a trade-off between the num-ber of dimensions included and the resulting loss of infor-mation. The larger the variance (singular value) of the projection into a given axis, the more information that axis contains. Axes with null values of variance contain no rele-vant information about the input distribution of data. As in-dicated by the data of Figure 5, there are non-null variances until dimension 73, which indicate that the 400-elements vector can be transformed into 73-elements vectors without loss of information. In order to obtain reduction to a smaller dimension there will be some loss of information, but the cut-off point is a user-defined parameter. In the tests carried out for the antigens, for dimensions larger or equal to 5, there was no change in the membership of clustered data. So, with the application ofPCA, it was possible to re-duce the dimension of the input data from 400 to 5 (1.25% of the original dimension of the image matrixM).
After transforming the 112 by 400 into new 112 by 5 matrices the data was then clustered into 40 different groups of antigens. The method used for grouping the anti-gens wasK-Meansalgorithm, (Linkaset al., 2003), (Braga
et al., 2000) which consists of findingKsets of data with minimum variance. The parameterKcan be set a priori by the user, although there are variations of the original algo-rithm that find the value ofKadaptively (Jain, Murty and
Flynn 1999). For clustering, the value ofKwas set closer to the number of domains within the 112 antigens.
Both methods, Principal Component Analysis and
K-Means, were implemented inMATLAB(Mathworks) due to its simplicity for prototyping and the availability of many libraries of mathematical functions necessary to implement the algorithms.
Results and Discussion
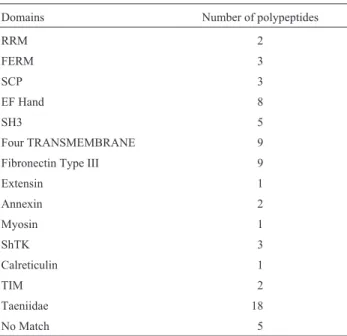
Data analysis was performed and each gene was clus-tered according to its domain. This result was compared and confirmed using thePFAMdatabase. The fifteen clus-ters found are summarized in Table 3.
TheRRM domain(found in two antigens) is charac-teristic of a variety of RNA binding proteins, including het-erogeneous nuclear ribonucleoproteins, proteins implicated in regulation of alternative splicing, and compo-nents of small nuclear ribonucleoproteins (Brandziuliset al., 1989) (accession number in PFAM: PF00076). The
FERM domain (present in three antigens) is found in a number of cytoskeletal-associated proteins that associate with various polypeptides at the interface between the plasma membrane and the cytoskeleton. It is a conserved N-terminal domain of about 150 residues, involved in the linkage of cytoplasmic proteins to the membrane (Reeset al., 1990), (Funayamaet al., 1991) (accession number in PFAM: PF00373). TheSCP domain(found in three anti-gens) belongs to proteins involved in sperm maturation and glioma pathogenesis-related processes (Mizuki and Kasahara, 1992) (accession number in: PF00188).
The fourth domain analyzed is theEF hand domain
(found in eight antigen) consisting of a twelve residue loop flanked on both sides by a twelve residue-helical domain. It is known to be a calcium binding domain and may
consti-Figure 5 - Singular values (variances) of the decomposed cross-correlation matrix.
Table 3- Domains and corresponding antigens.
Domains Number of polypeptides
RRM 2
FERM 3
SCP 3
EF Hand 8
SH3 5
Four TRANSMEMBRANE 9
Fibronectin Type III 9
Extensin 1
Annexin 2
Myosin 1
ShTK 3
Calreticulin 1
TIM 2
Taeniidae 18
tute a cross-reaction with IgE (Dunneet al., 1998) ( acces-sion number in PFAM: PF00036). The Src-homology 3
domain (SH3) (found in five antigens) is a small protein do-main of about 60 amino acid residues, probably folded into
b - sheets. SH3 domain is present in a large number of eukaryotic proteins that are involved in signal transduction, cell polarization, protein-protein and membrane-cytoskeleton interactions (Musacchioet al., 1992) ( acces-sion number in PFAM: PF00018).
A domain found in nine antigens is the Four TRANSMEMBRANE domain, which contains an N-terminal transmembrane domain and three additional transmembrane regions. These sequences contain a number of conservedcysteineresidues (Levyet al., 1991) ( acces-sion number in PFAM: PF00335). TheFibronectin type III domain (found in nine antigens) are also present in multi-domain glycoproteins found in a soluble form in plasma, and in an insoluble form in loose connective tissue and basement membranes. The fibronectins are involved in a number of important functions:e.g., wound healing; cell adhesion; blood coagulation; cell differentiation and migra-tion; maintenance of the cellular cytoskeleton; and tumor metastasis (Skorstengaaret al., 1986) (accession number in PFAM: PF00041).
The Extensin domain (found in one antigen) also present in hydroxyproline-rich glycoproteins found in the plant extracellular matrix (accession number in PFAM: PF04554). The Annexin domain(found in two antigens) seems to be involved in cytoskeletal interactions,
phospholipase inhibition, intracellular signaling, anticoagulation, and membrane fusion (Bartonet al., 1991) (accession number in PFAM: PF00191). TheMyosin do-main(found in one antigen) consists of the coiled-coil myo-sin heavy chain tail region. The coiled-coil is composed of the tail from two molecules of myosin, providing the struc-tural backbone of the thick filament (Strehleret al., 1968) (accession number in PFAM: PF01576). TheShTK domain
(found in three antigens) is also present in several C. elegansproteins, rich in cysteine residues, which probably form three disulphine bridges (accession number in PFAM: PF01549). TheCalreticulin domain(found in one protein), characterizes this high-capacity calcium-binding protein, present in most tissues and located at the periphery of the endoplasmic and the sarcoplamic reticulum membranes (Michalak et al., 1992) (accession number in PFAM: PF00262). TheTriosephosphate isomerase domain(TIM) (found in two antigens) is present in enzymes that play an important role in several metabolic pathways and is essen-tial for efficient energy production (Knowles, 1991) ( ac-cession number in PFAM: PF00121).
The last two clusters are especially interesting. One contains twenty one antigens, eighteen of them belonging to theTaeniidae domain familyand three withno matching
result, these three polypeptides are likely to be part of the same theTaeniidae domain family. Another cluster con-taining five antigens, withno matchingresults, may pro-vide an indication that these five polypeptides belong to the same family and are, thus, functionally related.
The 37 antigens that are not referenced in Table 3 were not considered because the antigens were character-ized byPFAMas putative domain.
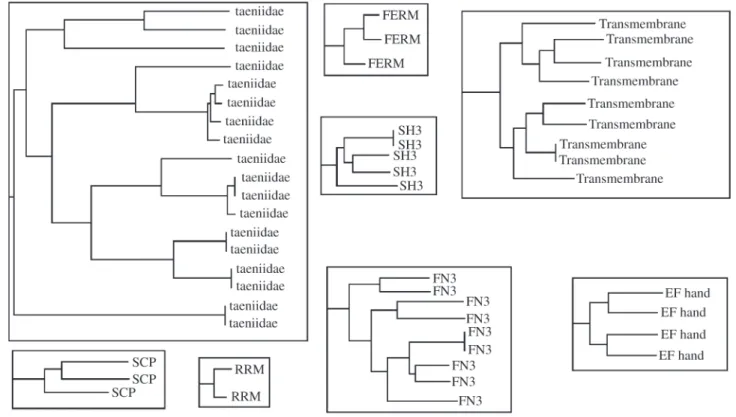
Using ClustalW for multiple alignment we verified that the antigens were grouped in the same clusters. Figure 6 shows parts of the hierarchical cluster displayed by ClustalW. Note that the clustering carried out by K-Means onto the SCSW scheme coincide with the clustering of ClustalW onto the original amino acids sequence, even with differences between the sequences. This shows that the codification scheme proposed in this study (SCSW), even though it is based in pairs of amino acids, retains enough information to enable us to correctly classify all the sequences.
This bioinformatics tool permitted us to establish a good correlation with domains that are already well charac-terized, regardless of the differences between the se-quences. Additionally, our method is able to group the polypeptides in accordance with their similarity, using the new codification scheme SCSW. Our results show that the codification proposed can be useful in several applications involving Artificial Neural Networks, where the same data dimensionality is essential.
References
Bandziulis RJ, Swanson MS and Dreyfuss G (1989) RNA-binding proteins as developmental regulators. Genes & Develop-ment 3:431-437.
Barton GJ, Newman RH, Freemont PS and Crumpton MJ (1991) Amino acid sequence analysis of the annexin super-gene family of proteins. Eur J Biochem 198:749-760.
Braga AP, Carvalho AF and Ludermir TB (2000) Redes Neurais Artificiais: Teoria e Aplicações. Livros Técnicos e Científicos, São Paulo, 262 pp.
Dunne DW and Hafalla JCR (1998) Identification of the Schistossoma japonicum22.6-kDa antigen as a major target of the human IgE response: Similarity of IgE-binding epitopes to allergen peptides. Int Arch Allergy Immunol 117:94-104.
European Bioinformatics Institute (EBI), http://www.ebi.ac.uk/ clustalw.
Fodor IK (2002) A survey of dimensional reduction techniques. LLNL technical report 27 pp.
Funayama N, Nagafuchi A, Sato N and Tsukita S (1991) Radixin is a novel member of the band 4.1 family. The Journal of Cell Biology 115:1039-1048.
Gray RM (1984) Vector Quantization. IEEE ASSP MAGAZINE, Stanford, pp 4-29.
Haykin S (1999) Neural Networks: A comprehensive foundation. Prentice Hall, 900 pp.
Jain AK, Murty MN and Flynn PJ (1999) Data clustering: A re-view. ACM Computing Surveys 31:264-323.
Knowles JR (1991) Enzyme catalysis: Not different, just better. Nature 350:121-124.
Levy S, Nguyen VQ, Andria ML and Takahashi S (1991) Struc-ture and membrane topology of TAPA-1. The Journal of Bi-ological Chemistry 266:14597-14602.
Likas A, Vlassis N and Verbeek JJ (2003) The globalk-means clustering algorithm. Pattern Recognition 36:451-461. Mathworks, http://www.mathworks.com.
Matthe WR and Calvo RA (1988) Fast dimensionality reduction and simple PCA. Intelligent Data Analysis 2:203-214. Michalak M, Milner RE, Burns K and Opas M (1992)
Calreticulin. Biochemistry J 285:681-692.
Mizuki N and Kasahara M (1992) Mouse submandibular glands express an androgen-regulated transcript encoding an acidic epididymal glycoprotein-like molecule. Molecular and cel-lular endocrinology 98:25-32.
Musacchio A, Gibson T, Lehto VP and Saraste M (1992) SH3 -An abundant protein domain in search of a function. FEBS Letters 307:55-61.
National Center for Biotechnology Information (NCBI),http://www.ncbi.nlm.nih.gov/pubmed.
Press W (1988) Numerical Recipes in C: The Art of Scientific Computing. Cambridge University Press 994 pp.
Protein Family database of alignments and HMMs (PFAM), http://www.sanger.ac.uk/Software/Pfam/.
Rees DJ, Ades SE, Singer SJ and Hynes RO (1990) Sequence and domain structure of talin. Nature 347:685-689.
Skorstengaard K, Jensen MS, Sahl P, Petersen TE and Magnusson S (1986) Complete primary structure of bovine plasma fibronectin. European Journal of Biochemistry 161:441-453.
Strehler EE, Strehler-Page MA, Perriard JC, Periasamy M and Nadal-Ginard B (1986) Complete nucleotide and encoded amino acid sequence of a mammalian myosin heavy chain gene. Evidence against intron-dependent evolution of the rod. Journal of Molecular Biology 190:291-317.