The double slit experience with light from the point of view of
Feynman’s sum of multiple paths
(O experimento da dupla fenda com luz do ponto de vista da soma de m´ultiplos caminhos de Feynman)
Mar´ıa de los ´
Angeles Fanaro
1, Marcelo Arlego
2, Mar´ıa Rita Otero
31
N´ucleo de Investigaci´on en Educaci´on en Ciencia y Tecnolog´ıa, Facultad de Ciencias Exactas, Universidad Nacional del Centro de la Provincia de Buenos Aires, Tandil, Buenos Aires, Argentina
2
Consejo Nacional de Investigaciones Cient´ıficas y T´ecnicas, Argentina
3
Instituto de F´ısica, Universidad Nacional de La Plata, Buenos Aires, Argentina Recebido em 9/9/2013; Aceito em 23/11/2013; Publicado em 11/5/2014
This paper presents an analysis of the double slit experience with light, by using concepts of the Feynman method of “sum of multiple paths” in quantum mechanics. The advantages of this formulation for the teaching of basic aspects of quantum mechanics in the high-school level are analyzed.
Keywords: double slit experience, light, sum of multiple paths, quantum mechanics.
Este trabalho apresenta uma an´alise da experiˆencia de fenda dupla com luz, utilizando conceitos do m´etodo de ”Soma de v´arios caminhos” da formula¸c˜ao de Feynman da mecˆanica quˆantica. S˜ao analisadas as vantagens desta formula¸c˜ao para o ensino no n´ıvel m´edio de aspectos b´asicos da mecˆanica quˆantica.
Palavras-chave: experiˆencia da dupla fenda, luz, soma de v´arios caminhos, mecˆanica quˆantica.
1. Introduction
The behaviour of matter and light cannot be well described exclusively by classical notions of particle and wave, but from the model that provides quantum physics.
For the case of electrons and subatomic particles, the Feynman approach of Multiple Paths offers an alter-native that allows a meaningful study of the concepts of probability, superposition principle and correspondence principle, showing the fundamental and universal char-acter of quantum mechanics laws [1, 2]. In previous re-search a sequence of situations adapting Feynman’s ap-proach was constructed and implemented in secondary school [2-4]. In the case of the light, an alternative ap-proach to the usual presentation of light quantization in textbooks for teaching was proposed applying the Feynman approach [5-8].
Usually the double slit experience is employed to explain and demonstrate the wave behaviour of light, using the concepts of wavelength, optical path differ-ence, interference and diffraction. This way of present-ing and analyzpresent-ing the experience aims to establish the wave nature of electromagnetic radiation. Identifying light with a wave or with a particle is physically
inap-propriate because neither the corpuscular nor the wave model, or a combination of both, offer a complete de-scription of the behaviour of light at all energy and size scales. This does not mean that the classical concepts of wave and particle completely lose its usefulness in the description of quantum phenomena. The behavior of a quantum object, such as the electron or the photon, depends on the experimental setup with which it inter-acts. For instance, in the double-slit experiment, light exhibits wave behavior when interacts with the dou-ble slit, but it is detected as a particle (localized) on the screen. This duality is a manifestation of the prin-ciple of complementarity introduced by Bohr, in the framework of standard (Copenhagen) interpretation of quantum mechanics, and has its root in the principle of uncertainty. In quantum theory, corpuscular and un-dulatory points of view are complementary rather than contradictory.
In this work, the propose is to study the behaviour of light from a perspective that shows the general char-acter of quantum mechanics, describing the results of the double slit experience, in terms of the Feynman approach “sum of multiple paths”. This method is adapted to the mathematical level of students, by us-ing concepts as sum of vectors and trigonometric
func-1
E-mail: [email protected].
its epistemological aspects.
2.
The Feynman method adapted to
secondary school
This section presents the Feynman “sum of multiple paths” formulation of quantum mechanics, which is an adaptation of his path integrals method of 1948 [13]. This method is based on the concept of action of classi-cal mechanics. It replaces the notion of a unique least action trajectory of classical physics with a sum over an infinity of possible trajectories to compute the prob-ability of a given event. Although this formulation is completely equivalent to the canonical formalism of op-erators on Hilbert spaces of quantum mechanics, it has played a dominant role in the development of quantum field theories to the present. This method requires ad-vanced functional analysis tools, which of course are not accessible to secondary school students. However it is possible to simplify the mathematics keeping the main conceptual aspects. To this end complex numbers are replaced by vectors in the plane, and integrals by sums. For simplicity, the study is restricted to propagation of light in the vacuum, since the results are easily general-izable to other situations. The technique to determine the probability of detecting light at F that was emitted at I consists in the following procedure:
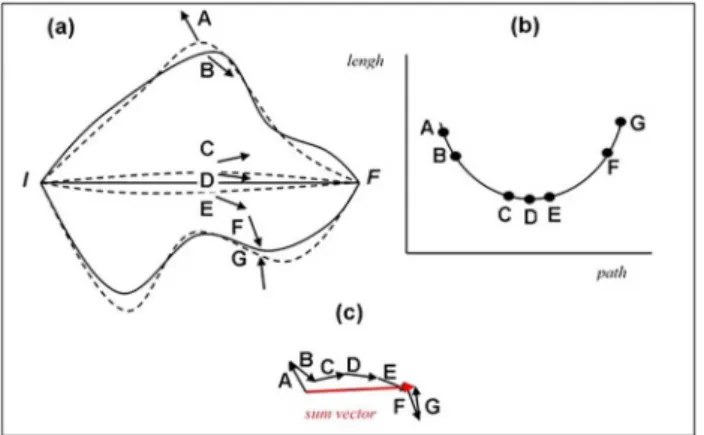
1) Consider different paths connecting I with F. Fig-ure 1(a) shows some of them (A, B, C, D, E, F and G):
Figure 1 - Some paths connecting I with F, and their associ-ated vectors (a). Representation of the path length for different “paths” (b). Sum of the associated vectors (c).
connecting I with F must be considered to get the re-sultant vector and obtain the probability. This leads to the problem of having to add infinite vectors, which can be carried out analytically in few cases. Usually the sum is performed approximately, using a variety of techniques, which are beyond the scope of this paper. However, in many cases, some important conclusions can be obtained without adding all the paths. In par-ticular, certain groups of paths turn out to be more important than others, as it will be discussed below.
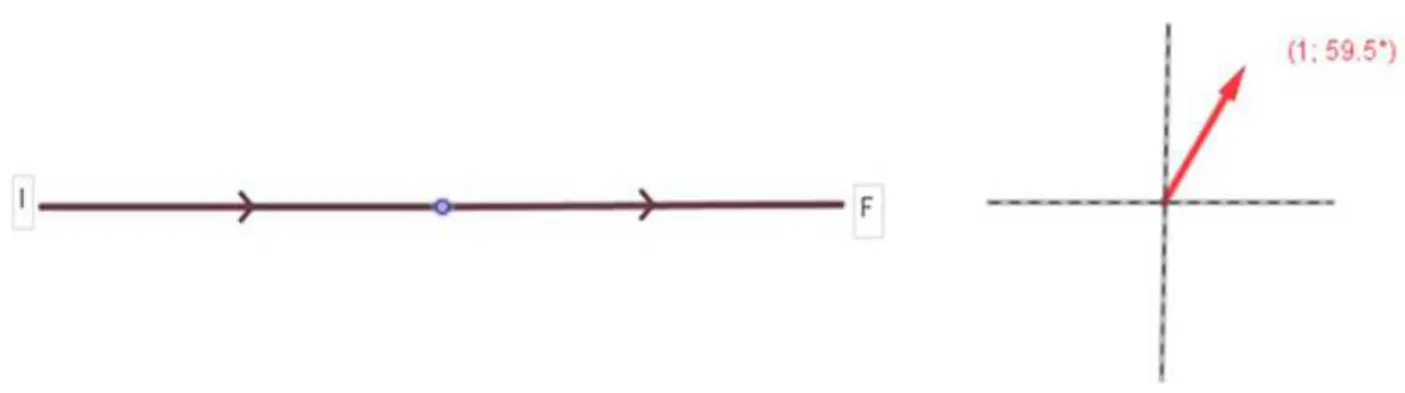
To visualize the general procedure and the contribu-tions of different paths, a simulation performed with the Geogebra⃝R software is presented, as shown in Fig. 2.
The simulation allows selecting any path connecting the points I and F. To simplify calculations, only straight paths, broken at the midpoint connecting I with F, are considered. The simulation draws simultaneously the selected path and the associated vector. Thus, it is possible to select different paths and analyze direction variations of corresponding vectors.
By focusing on paths “around” the direct or short-est path (straight line linking I to F), one can observe that they have approximately the same length as the shortest path. Since the direction of the vectors as-sociated with each path is proportional to its length, then the vectors corresponding to the direct path and those around it will have approximately the same di-rection, and contribute constructively to the sum (they do not cancel each other). Instead, the paths that are far from the shortest path, have very different direc-tions and tend to cancel each other in the sum. This is a general property of minima (or maxima) and it can be formally justified using tools of functional analysis. The relative variations in the direction of vectors associ-ated to the near environment of the shortest path, are smaller than the relative variations around any other path. Therefore the path of minimum length and those that are around it contribute in “phase” to the sum, while the other paths tend to cancel each other, because its directions are very different. While the definition of environment depends on each problem, the scheme of approximation based on keeping only the shortest path and its near environment in the sum, is the basis of the
Figure 2 - Screen shot of a simulation performed with Geogebra⃝R, showing simultaneously a path and its associated vector (lengh 1 ;
angleωd
c). The midle point (blue dot) between I and F can be moved vertically to generate different “paths”.
To test previous aspects, consider, for instance, that the distance between I and F is d = 100 m and the source is red light. The angle associated with each path is given by
α=ω.d c
being ω is a constant (called angular frequency) that depends on the type of light. For red lightω ≈
8649851.77 rad / s and c is the speed of the light in the vacuum. In this case for the straight path the angle is
α=ω
c.d≈8649851.77rad≈240 ◦
The absolute magnitude of this angle is unimpor-tant by itself, while what matters is the relative change respect to contributions from its environment. Con-sider small variations respect to straight line, as
con-sidered before, given by broken paths connecting I with F, forming an isosceles triangle with height a. Fig-ure 3 shows schematically one representative path with
a= 10−3 m.
Table 1 depicts the results obtained by selecting sev-eral paths (of type shown in Fig. 3). The first column shows the heights of the triangles formed (a), the sec-ond column the path length, third and fourth ones the corresponding angle, in radians and degrees (reduced to the range [0, 360◦]), respectively. Finally, the last
col-umn shows the difference in degrees respect to shortest path, rounded to degrees. Note that relative variations are not so large.
By repeating the previous procedure, but respect to a path faraway of the shortest one, for instance with heighta = 1 m, variations in relative angles are much more marked. The Table 2 shows the results in this case.
Table 1 - Results obtained by selecting neighboring path around shortest path connecting I with F.
a [m] Path lenght [m] angle [rad] angle [◦] Variation of the angle
0 100.0000000000 864985177.2884 240.0
0,001 100.0000000200 864985177.4614 249.9 10 0,0011 100.0000000242 864985177.4977 252.0 12 0,0012 100.0000000288 864985177.5375 254.3 14 0,0013 100.0000000338 864985177.5808 256.8 17 0,0014 100.0000000392 864985177.6275 259.4 19 0,0015 100.0000000450 864985177.6776 262.3 22 0,0016 100.0000000512 864985177.7313 265.4 25
The two cases analyzed illustrate the role of “clas-sical path”. In the first case, small variations around shortest path give rise to small variations in the respec-tive angles, and therefore vectors contribute to the sum in phase. Whereas in the second case, small deviations around a path which is not the shortest one produce large differences and in the sum these vectors tend to cancel each other, that is to say, they do not contribute (statistically) to the sum.
It is very instructive to discuss these aspects with students, in terms of relative values and the orders of magnitude involved. In the case of paths near the direct one, small variations in the path length (changes in the eighth decimal) when are multiplied by the large value of ω/c, do not change the angles too much (see Table 1 last column). In contrast, when a small change on a remote path is performed (of the same order as in the previous case,a= 10−3m) large variations in the path
length are produced. In this case, there are changes in the third decimal place that, when multiplied by ω/c, modify substantially the corresponding angles.
If “all” possible paths could be summed up, putting one after the other, one would obtain a Cornu-like spi-ral. Each of the “curls” of the spiral is formed by the vectors corresponding to the paths faraway from direct path that cancel to each other. On the hand, the central part represents the contributions (in phase) of shortest path and its environment. Figure 4 represents the sit-uation for some representative paths.
Figure 4 - Selection of some paths connecting I with F (a). Lenght
vs. path (b). Sum of the vectors associated to each path (c).
This illustrated the main approximation used in this work. Only the contribution of the shortest path and
those of their immediate environment contribute signif-icantly to the final sum and therefore to the probability. In the next Section, this approximation is employed to describe the results of the double slit experiment.
3.
The double slit experience with light:
from the experience to the theory
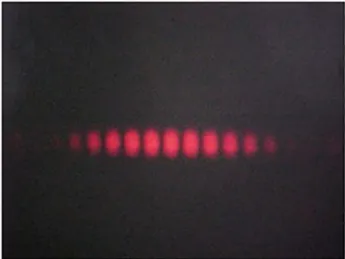
It is possible to perform the double slit experience in classroom with students in a simple way, using a metal-ized sheet with two thin slits spaced at an approximate distance ofd= 10−3 m.
The light source is a red laser pointer (whose fre-quency is 4.3 x 10¹⁴ Hz). At the detection screen, a
wall located at D = 10 m from the source, a charac-teristic pattern of alternated light and dark fringes is formed, as shown in Fig. 5.
Figure 5 - Picture of the resulting pattern obtained in a typical double slit experiment with a red laser.
Even though the resulting pattern is interesting by itself, its formation, that is to say, how the distribu-tion evolves with the time until the stadistribu-tionary pattern (as in Fig. 5) is obtained is intriguing. A possibility to analyze this evolution could be by placing a detec-tion screen formed by a large number of light sensitive detectors, which are able to record in real time the de-tections. Since that time scale involved is very short it is technologically impossible to do such an experiment in classroom. However results of this type of
experi-2
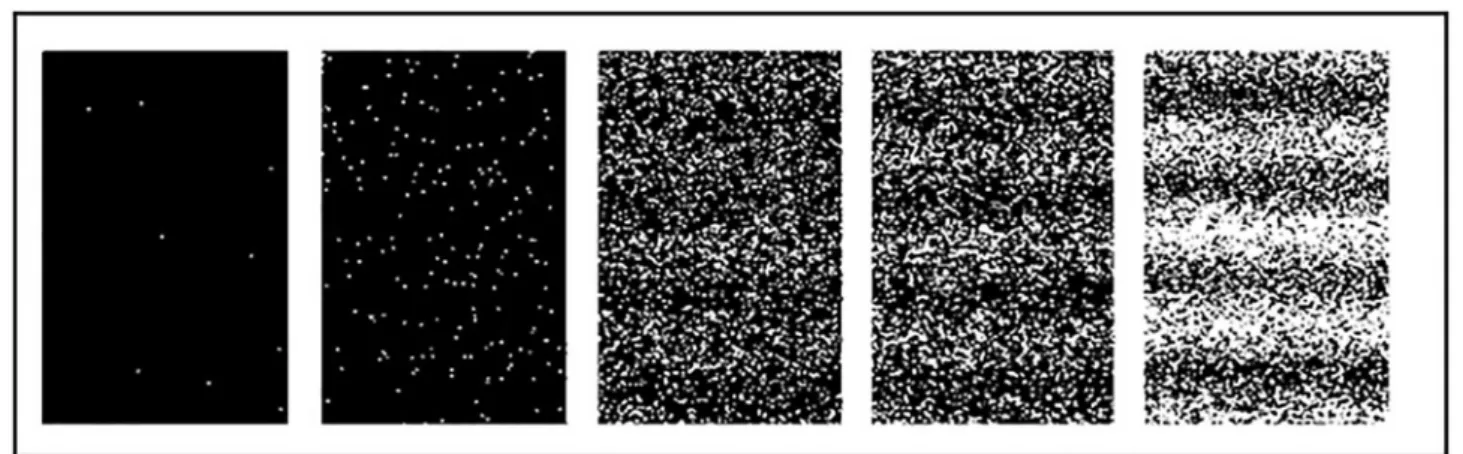
ments are available on internet and offer to students an easy to access alternative to visualize the formation of the interference pattern. In Fig. 62 the temporal
evo-lution of the pattern in the detection screen is showed by means of five snapshots at increasing times from left
to right. ⌋
Figure 6 - Snapshots at increasing times (left to right) of detection screen in a double slit experiment with very low intensity of light.
⌈
As it can be observed, the detections are localized (white) dots. At first, these points seem to be dis-tributed randomly. But over time, they appear in a way that resembles the pattern observed in the experi-ment carried out in the classroom: there is an alterna-tion between places with a large and a small number of detections, respectively.
The aim now is to analyze how quantum mechanics predicts the alternated pattern observed in the double slit experiment. From a quantum point of view, the question is:
How is the probability of detecting light (that has been emitted by the source) at a given point of the detection screen?
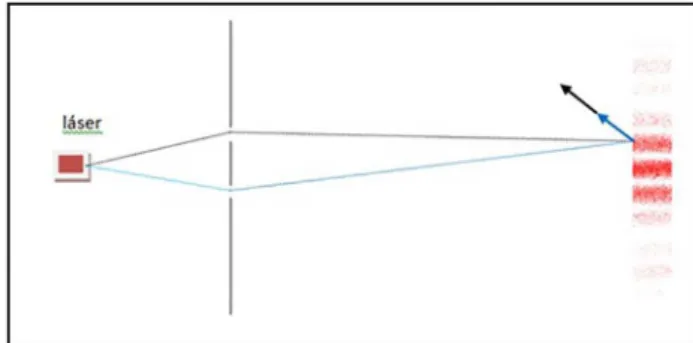
This question can be responded by means of the pro-cedure established in Section 2. To this end consider the scheme of Fig. 7, where the source (not shown) is supposed to be far left from the double slit screen, and the detection point is at a distance x on the right screen (measured from its center).
As it can be observed in Fig. 7 there are two di-rect paths connecting the source with a given point x on the screen. One of the paths passes through the lower slit, while the other one goes across the upper one. But there are many alternatives (in principle infi-nite) of connecting the source with the detection point. One option could be, for instance, a completely arbi-trary path connecting the source to one of the slits, and from there to the detection screen. However, ac-cording to previous discussion, the shortest path and its environment are the most important, and then only these paths will be considered. Hence, the vectors that contribute to the probability are those identified with
the direct paths, that is to say, one for each slit, and a finite set (n) of vectors associated with neighbouring paths, which contribute essentially with same angle (in phase). Therefore, for the first slit
Figure 7 - Scheme of the double slit experience.
−−−−−−→
V1(r1 x) =n (
1;ω.d c
)
,
whereωis proportionality constant3 andR
1is the
dis-tance from the slit 1 to x (see Fig. 7). In Cartesian coordinates, which are more familiar to students the expression is
−−−−−−→
v1(r1 x) =n [
cos(ω
cR1
)
; sin(ω
cR1
)]
.
Analogously for the other slit
−−−−−−→
v2(r2 x) =n [
cos(ω
cR2
)
; sin(ω
cR2
)]
.
3
Indeedωis the angular frequency of the corresponding classical electromagnetic wave. But the use of this terminology is avoided
P(x)∼cos2 (ω d
cD. x
)
. (2)
This expression gives the probability of detecting light (emitted from the source) at a distancexfrom the center of the screen. It is a result derived purely from quantum mechanics, and indicate that the probability function have maxima and minima, in agreement with the alternation pattern observed in the experiment. In this way, students can compare the theory prediction with the results of the double slit experience carried out in classroom. The expression (2) allows analyzing the dependence of the probability with the colour of the light, which was initially set to red. For instance, using blue light in the experience, students may notice that the maxima are closer to each other, and this is indeed what the probability function predicts, where now the value of kis larger, and therefore the argument of the function is also larger. Another possibility would be to fix the colour and analyze the probability dependence with slits separation. It is clear that, working with the parameters of the expression can be a very enriching experience for the conceptualization of students.
There is an alternative way to explain the expe-rience, without using the mathematical expression of
P(x) (2). Considering only the two main paths, the idea is to analyze at which points on the screen, the vectors associated with both slits have the same (oppo-site) direction, giving rise to maxima (minima) of prob-ability. Regarding maxima, the center of the screen is the simplest case to analyze. There the distances from the slits are the same, and hence its associated vectors have the same angle (direction) so that the sum and therefore the probability is maximum, as it is observed experimentally. Figure 8 shows a diagram of this situa-tion, representing the two paths, the associated vectors (with the same direction) and the light distribution ob-served experimentally, simulated withModellus
How to explain the presence of other maxima with the same procedure? From experiment it is clear that the probability of finding other maxima is not zero. How to find places where the vectors have the same direction although the distances of each path are dif-ferent? To answer this, consider Fig. 9. As it can be observed the lengths of the two paths are different, but even so, the vectors associated with each path have the same direction, since their difference is 2π.
Figure 8 - The double slit experience from the viewpoint of sum of paths of quantum mechanics. In the center of the detection screen, where the distances to both slits are equal, the vectors as-sociated with each path have the same direction and when added a maximum is obtained, which explains the central maximum observed in experience.
Figure 9 - Vectors associated with both paths arrive with equal direction to the screen, giving a maximum light intensity.
Generalizing this idea, it is simple to conclude that all points on the screen such that their associated vec-tors have a relative difference of an integer number of turns are those places where it is most probable to de-tect light, and coincide with points of maximum inten-sity of light in the experiment. The minimum probabil-ity condition on the screen is obtained by an equivalent reasoning. Figure 10 illustrates this case. As can be observed the lengths of the two paths are such that the associated vectors have opposite directions since the dif-ference of the angles isπ(or in general an odd multiple of it).
Figure 10 - The vectors associated with the contributions of both slits have opposite directions, giving a minimum intensity of light.
or partial cancellation of the vectors associated with straight paths form slits, due to the difference in lengths of these paths.
4.
Conclusions
The purpose of this work has been to analyze phenom-ena related to light from the point of view of quantum mechanics, taking as paradigmatic case the double slit experience. The particularity here is that the reference to this experience differs of the usual approach, where it is used to show the wave character of light by means of concepts of interference and diffraction of classical electromagnetic waves.
The advantage of the treatment presented here is that it not only describes interference phenomenon, by-passing classical Maxwell electromagnetism that can be problematic to conceptualize for students. More impor-tant, it allows introducing intrinsic quantum aspects, as probability of an event and the discrete nature of light emission and detection, in a unified framework. In this sense, this work presents a possible strategy to teach concepts of quantum mechanics to secondary school students.
The present proposal has been contextualized by the authors in a didactic sequence that includes a descrip-tion of reflecdescrip-tion and refracdescrip-tion of light from point of the view of the quantum mechanics, and has already been implemented in four physics courses in two secondary schools in Argentina. Current research is focused on the analysis of the results of these implementations.
Finally we would like to comment on the difficulties of addressing the concept of photon in secondary school, and the possibility of consider them in the context of our proposal. There is a prevailing idea that the photon is akind of particle, and so a localized object. However, photons emerge as the quantization of electromagnetic field modes, and as such are completely delocalized ob-jects. When talking about particle is rather in the sense that the energy exchange between radiation and mat-ter is in discrete units, i.e. in a finite number of pho-tons, each one carrying a fixed amount of energy (and momentum). For example, in the double-slit experi-ment with light of very low intensity, detection events on screen are discrete in energy. Lowering light inten-sity only decreases the frequency detection of photons, but not the energy transferred in each event, which only depends on the frequency of the light.
Since this type of issues can naturally emerge in stu-dents questions, a possible strategy would be to focus the discussion on the latter sense. That is to say, on the
representation of the photon as a basic unit of energy exchange, and not on aspects related to spatial loca-tion. Although conceptual and epistemological aspects of the nature of photon are not in the general line of dis-cussion of this work, it clearly deserves future research which goes beyond the goals of present investigation.
References
[1] M. Arlego, Revista Electr´onica de Investigaci´on en Ed-ucaci´on en Ciencias3, 59 (2008).
[2] M. Fanaro, M.R Otero e M. Arlego, Investiga¸c˜oes em Ensino de Ciˆencias14, 37 (2009).
[3] M. Fanaro y M.R. Otero, Lat. Am. J. Phys. Educ2, 103 (2008).
[4] M. Fanaro, M.R Otero and M. Arlego, The Physics Teacher50, 156 (2012).
[5] M. Arlego, M. Fanaro and M.R. Otero, Poceedings of World Conference on Physics Education, Istambul, 2012, edited by Mehmet Fath Taar (Pegem Academi, Istambul, 2013), p. 795.
[6] M. Elgue, M. Fanaro, M. Arlego y M.R. Otero, Ac-tas del I Congreso Internacional en Ense˜nanza de las Ciencias y la Matem´atica - II Encuentro Nacional en Ense˜nanza de la Matem´atica, Tandil, 2011, edited by M.R. Otero, I.E. Elichiribehety and M. Fanaro (N´ucleo de Investigaci´on en Educaci´on en Ciencia y Tecnolog´ıa, Facultad de Ciencias Exactas UNICEN, Tandil, 2011), p. 643.
[7] M. Fanaro, M.R. Otero y M. Arlego, Problems of Ed-ucation in the 21st
Century472, 27 (2012).
[8] M. Arlego, M. Fanaro, M.R. Otero y M. Elgue,Actas I Congreso Internacional en Ense˜nanza de las Ciencias y la Matem´atica - II Encuentro Nacional en Ense˜nanza de la Matem´atica, Tandil, 2011, edited by M.R. Otero, I.E. Elichiribehety and M. Fanaro (N´ucleo de Investi-gaci´on en Educaci´on en Ciencia y Tecnolog´ıa, Facultad de Ciencias Exactas UNICEN, Tandil, 2011), p. 657.
[9] Geogebra⃝R. Disponible enwww.GeoGebra.org.
[10] J. Ogborn, J. Hanc and E. Taylor, Proceedings The Girep conference 2006, Modeling in Physics and Physics Education (AMSTEL Institute, Amsterdam, 2006), p. 213.
[11] J. Hanc and S. Tuleja, Proceedings 10th
Workshop on Multimedia in Physics(Freie Universit¨at Berlin, 2005), p. 10.
[12] E.F. Taylor, S. Vokos, J.M. O’Meara and N.S. Thorn-ber, Computers in Physics12, 190 (1998).