Mechanisms underlying gas exchange
alterations in an experimental model
of pulmonary embolism
Departamento de Cirurgia, Faculdade de Ciências Médicas, Universidade Estadual de Campinas, Campinas, SP, Brasil J.H.T. Ferreira, R.G.G. Terzi,
I.A. Paschoal, W.A. Silva, A.C. Moraes and M.M. Moreira
Abstract
The aim of the present study was to determine the ventilation/perfusion ratio that contributes to hypoxemia in pulmonary embolism by analyz-ing blood gases and volumetric capnography in a model of experimental acute pulmonary embolism. Pulmonary embolization with autologous blood clots was induced in seven pigs weighing 24.00 ± 0.6 kg, anesthetized and mechanically ventilated. Significant changes occurred from baseline to 20 min after embolization, such as reduction in oxygen partial pressures in arterial blood (from 87.71 ± 8.64 to 39.14 ± 6.77 mmHg) and alveolar air (from 92.97 ± 2.14 to 63.91 ± 8.27 mmHg). The effective alveolar ventilation exhibited a significant reduction (from 199.62 ± 42.01 to 84.34 ± 44.13 mL) consistent with the fall in alveolar gas volume that effectively participated in gas exchange. The relation between the alveolar ventilation that effectively participated in gas exchange and cardiac output (VAeff/Q ratio) also presented a significant reduction after embolization (from 0.96 ± 0.34 to 0.33 ± 0.17 fraction). The carbon dioxide partial pressure increased significantly in arterial blood (from 37.51 ± 1.71 to 60.76 ± 6.62 mmHg), but decreased significantly in exhaled air at the end of the respiratory cycle (from 35.57 ± 1.22 to 23.15 ± 8.24 mmHg). Exhaled air at the end of the respiratory cycle returned to baseline values 40 min after embolism. The arterial to alveolar carbon dioxide gradient increased significantly (from 1.94 ± 1.36 to 37.61 ± 12.79 mmHg), as also did the calculated alveolar (from 56.38 ± 22.47 to 178.09 ± 37.46 mL) and physiological (from 0.37 ± 0.05 to 0.75 ± 0.10 fraction) dead spaces. Based on our data, we conclude that the severe arterial hypoxemia observed in this experimental model may be attributed to the reduction of the VAeff/Q ratio. We were also able to demonstrate that VAeff/Q progressively improves after embolization, a fact attributed to the alveolar ventilation redistribution induced by hypocapnic bronchoconstriction.
Correspondence J.H.T. Ferreira Rua João Bissoto Filho, 99 Bloco 15, Apto. 21 13275-410 Valinhos, SP Brasil
Fax: +55-19-3233-2969 E-mail:[email protected] or [email protected]
Publication supported by FAPESP.
Received November 24, 2005 Accepted June 12, 2006
Key words
•Effective alveolar ventilation •Mismatching ventilation/
perfusion
•Pulmonary gas exchange
Introduction
Hypoxemia is one of the most important clinical signs of pulmonary embolism (PE). The complex abnormalities in gas exchange that occur are multiple, but the literature
remains unassertive to elucidate the underly-ing mechanisms (1-10).
car-diopulmonary disease (8,9). Dantzker and Bower (8) stated that this difficulty exists even in experimental situations because of differences in species, the specific experi-mental circumstances, as well as the size, composition and quantity of the embolized material utilized, which may influence re-sults in each individual model (11).
Several mechanisms are believed to be responsible for hypoxemia. These include low-partial oxygen pressure in mixed venous blood (PvO2), the mismatch between ventila-tion and perfusion, the intrapulmonary shunt, the diffusion limitation, and the severity of the embolism, impairing the identification of the real cause of hypoxemia (8,9). Recently, the mechanisms responsible for gas exchange have been investigated with the use of the multiple inert gas elimination technique (9).
In normal lungs there is equilibrium be-tween alveolar ventilation and capillary per-fusion at the proportion of approximately 1:1. The transfer of O2 is jeopardized when this equilibrium is altered and this propor-tion is reduced (2,4).
Pulmonary shunt occurs in humans and animals after PE, although its etiology has not been clearly established (8). Kasinski et al. (7) did not find a significant shunt in the embolization of the pulmonary circulation of dogs with autologous clots. Similarly, Wilson et al. (12) did not detect a shunt in clinical studies.
Mismatch between ventilation and per-fusion has been reported by most investiga-tors as the most common cause of the gene-sis of hypoxemia in PE. Correction of mis-matching alveolar ventilation to cardiac out-put (CO) ratio (VA/Q) may occur from the redistribution of the perfusion towards ven-tilated areas or from a fall in ventilation of areas with limited or absent perfusion (3-6,8,10,13,14). Indeed, Levy and Simmons (15) observed that in PE there is a partial auto-regulation of the alveolar ventilation and perfusion at the lobar and segmental levels in order to maintain the equilibrium of
the VA/Q (4,16). This phenomenon has only recently been confirmed with technology based on positron emission tomography scan that quantifies the redirection of the ventila-tion to alveoli with maintained perfusion, called effective or regional alveolar ventila-tion (VAeff) (14,17,18). Most studies attribute the redirection of alveolar ventilation to re-gional bronchoconstriction induced by al-veolar hypocapnia (14,15,17,19,20). How-ever, this redistribution of alveolar ventila-tion varying from nonexistent to highly sig-nificant has been frequently reported in the literature (8,9,15), probably because of the different approaches and models used (3).
A third element described in the patho-genesis of hypoxemia in PE is the reduction in PVO2 as a result of the fall in CO (8).
The aim of the present study was to de-termine the effective alveolar ventilation to perfusion ratio as a possible causal factor of hypoxemia in an experimental acute model of PE.
Material and Methods
The study was conducted in the Núcleo de Medicina e Cirurgia Experimental of the State University of Campinas (UNICAMP) and was approved by the Ethics Committee for Animal Research of the Institute of Biol-ogy, UNICAMP.
Seven Large-White pigs weighing 24.00 ± 0.6 kg were pretreated with 10 mg/kg intramuscular ketamine and subsequently anesthetized with 12 µg/kg fentanyl citrate and 25 mg/kg sodium thiopentate.
decreasing inspiratory air flow.
A #5F-Swan-Ganz pulmonary artery cath-eter was introduced through the right femoral vein. A #6F-polyethylene catheter was intro-duced through the femoral artery and the tip was guided to the abdominal aorta. The cor-rect location of the catheters was checked systematically by the analysis of the morphol-ogy of the pressure curves. Each catheter was filled with saline solution containing 5 units of heparin/mL and was connected to a Medex electromanometer (Hilliard, OH, USA). CO and blood pressure were recorded with a car-diac monitor (BESE, Belo Horizonte, MG, Brazil). All pressures were measured with the animals in the supine position and the zero reference point was set at the mid-thoracic line of the animal.
The blood pressure monitor was cali-brated with a standard mercury column and CO was obtained by thermodilution, with the injection of 5% dextrose in water at a temperature of less than 5ºC.
The central temperature was obtained directly from the thermistor located at the tip of the pulmonary artery. Blood samples were collected simultaneously from the arterial and mixed venous lines and immediately analyzed with an IL-640 instrument (Instru-mentation Laboratory, Lexington, MA, USA). Blood lactate was measured with an equipment that provides lactate values within 1 min from a single drop of arterial blood (Accusport, Boehringer Mannheim, Asta Medica, São Paulo, SP, Brazil).
The following hemodynamic parameters were measured and their variables calcu-lated: CO, mean arterial pressure (MAP), pulmonary artery pressure (PAP), occluded pulmonary artery pressure, and heart rate. Capnography was carried out using the res-piratory profile monitor DX-8100 (CO2 SMOPlus, Novametrix/Respironics, Che-shire, CT, USA). Analysis Plus software (Novametrix/Respironics) was used for the calculation of the physiological respiratory variables. The CO2SMOPlus
pneumotacho-graph is based on the principle of differential manometry with a fixed resistance and is auto-calibrated.
One hour before embolization, 100 IU lyophilized bovine thrombin (Laboratory Instrumentation Company, Lexington, MA, USA) were added to 200 mL of blood re-moved from the jugular vein. After a period of 45 min the clotted blood was fragmented with a manual processor in order to obtain uniform fragments of clots measuring ap-proximately 3 mm in diameter. These thrombi were filtered and suspended in saline solu-tion and placed in a large syringe connected to a #14F-polyethylene catheter inserted into the left jugular vein of the animal.
The clots were injected in small volumes in order to reach the end point of a mean PAP (MPAP) two and a half times the MPAP recorded before embolism. The total volume of injected clots was 24.66 ± 4.27 mL and the average total time of clot injection was 20 min. Recordings of hemodynamic, cap-nographic, arterial and mixed venous blood gases, and blood lactate were carried out before embolization (baseline) and every 20 min starting at the end of clot injection. Four recordings were obtained, T0 (baseline) and T20, T40, and T60, at 20, 40, and 60 min, respectively, after MPAP established as the end point of embolization.
The Fowler method was used by the CO2SMOPlus to calculate the anatomical dead space (VDana). The physiological dead space (VD/VTphys) was calculated with the equation of Bohr-Enghoff (21):
VD/VTphys = (PaCO2 - PECO2)/PaCO2
where PECO2 is the partial pressure of mean CO2 in exhaled air.
The alveolar dead space (VDalv) was cal-culated as the difference between the physi-ological dead volume (VDphys, Bohr-Eng-hoff) (21) and the VDana.
VDalv = VDphys - VDana
cal-The partial pressure of oxygen in alveo-lar air (PAO2) was calculated from the equa-tion of the alveolar air (22) with the formula:
PAO2 = PIO2 - (PaCO2/QR)
where PIO2 is the partial oxygen pressure on inspired air, PaCO2 was obtained from blood gas report and QR is the respiratory quotient considered to be fixed and equal to 0.8.
Systemic vascular resistance (SVR) was calculated by the equation SVR = MAP/CO and pulmonary vascular resistance (PVR) was calculated by the equation PVR = MPAP/CO.
Statistical analysis
Analysis of variance (ANOVA) for re-peated measures with rank was used to com-pare the variables of interest for each group and for each time, with the level of signifi-cance set at 5% (P < 0.05).
Results
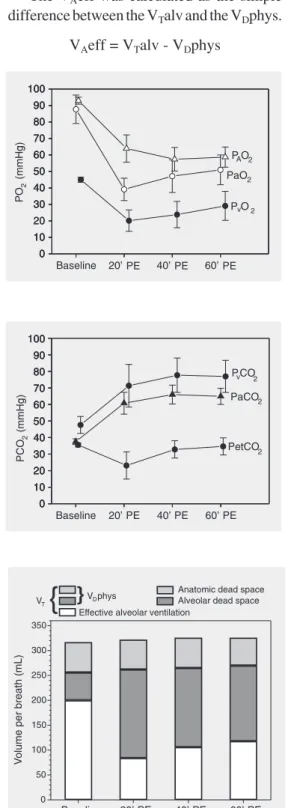
After embolization there was a signifi-cant fall in oxygen partial pressure in arterial blood (PaO2), PVO2 and PAO2, as shown in Figure 1.
Alveolar to arterial oxygen partial pres-sure gradient (P(A-a)O2) increased at T20 after embolization. However, it fell again at T60. Figure 2 shows a significant increase of PaCO2 and carbon dioxide partial pressure in mixed venous blood 20 min after embo-lism. Exhaled air at the end of the respiratory cycle (PetCO2) was significantly reduced at this time, returning to baseline at T40 (Figure 2). However, the arterial to alveolar carbon dioxide gradient (P(a-et)CO2) increased sig-nificantly and remained elevated up to T60.
Figure 3 shows increases of VDalv and VDphys. VDana did not change. The VTalv remained unchanged throughout the experi-ment. On the other hand, at T20, VAeff exhib-ited a significant reduction despite a fixed minute volume, followed by a tendency to recovery.
Figure 1. Partial pressure of oxy-gen in alveolar air (PAO2), in
ar-terial blood (PaO2) and in
venous blood (PvO2) during
ex-perimental pulmonary embolism (PE) in pigs. Data are reported as means ± SD for 7 pigs.
Figure 2. Carbon dioxide par-tial pressure in arterial blood (PaCO2) and in venous blood
(PvCO2), and end tidal exhaled
air (PetCO2) during
experimen-tal pulmonary embolism (PE) in pigs. Data are reported as means ± SD for 7 pigs.
Figure 3. Respiratory variation in volume per breath during ex-perimental pulmonary embolism (PE) in pigs. Data are reported as means for 7 pigs. VT = tidal
volume; VDphys = physiological
dead space.
culated as the simple difference between the VT and the VDphys.
VTalv = VT - VDphys
The VAeff was calculated as the simple difference between the VTalv and the VDphys.
The VAeff/Q ratio exhibited a significant reduction at T20 after embolization (Figure 4). However, at T40 and T60 these values tended to recover partially.
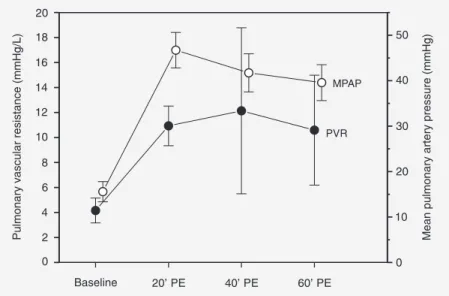
MPAP starting from a mean baseline value of 15.57 ± 2.23 mmHg reached a mean value of 46.71 ± 3.90 mmHg after emboliza-tion (T20), with no changes in CO. On the other hand, all animals presented severe tachycardia at T20. However, mean blood pressure did not change after embolization. Pulmonary vascular resistance increased sig-nificantly at T20, remaining elevated at T40 and T60 (Figure 5).
Discussion
Blockade of pulmonary perfusion by clots results in ventilation of non-perfused alveoli, characterizing wasted ventilation, conven-tionally named VDalv. The increase in VDalv subtracts a considerable fraction of alveolar ventilation, leading to reduction of VAeff (15).
The present data show that VDana was unchanged, whereas VDphys and VDalv in-creased in an expressive way as a result of blood clots impairing the pulmonary circu-lation of the animals (2,13).
Since no increase in VDana was detected, the expressive increase in VDphys could be exclusively attributed to the increase in VDalv. The significant increase in PaCO2 after embolization was attributed to the abol-ished reflex hyperventilation normally trig-gered by hypercapnia, because the animals were sedated and mechanically ventilated (2,15).
It could be argued that the reduction of VDalv, the P(a-et)CO2 gradient and the im-provement of VAeff and arterial oxygen-ation at T40 and T60 were caused by sponta-neous thrombolysis. If this was the case, a reduction in pulmonary vascular resistance should be expected. Actually, pulmonary vascular resistance increased at T20 and re-mained elevated at T40 and T60 (Figure 5).
Figure 4. Effective alveolar ventilation per breath (VAeff) and effective alveolar ventilation
to cardiac output ratio (VAeff/Q) during experimental pulmonary embolism (PE) in pigs.
Data are reported as means ± SD for 7 pigs.
Figure 5. Pulmonary vascular resistance (PVR) and mean pulmonary artery pressure (MPAP)during experimental pulmonary embolism (PE) in pigs. Data are reported as means ± SD for 7 pigs
This fact can only be attributed to vasocon-striction induced by the low PAO2 values (Figure 1) since it has been shown that PAO2 values below 70 mmHg trigger marked va-soconstriction, up to the point where blood flow is abolished (8,15,23,24).
ventilation and as relative reperfusion of the vascular bed due to the reduction of VDalv at T40 (Figure 2) despite elevated values com-pared to baseline.
In a study of the kinetics of carbon diox-ide pulmonary artery occlusion in dogs with subsequent reperfusion, Anderson and Breen (13)stated that the return of PetCO2 to base-line values is indicative of pulmonary perfu-sion and, indeed, in the present study PetCO2 returned to baseline levels at T40 (Figure 2). However, this finding cannot be attributed exclusively to thrombolysis since PaO2 and PaCO2 did not normalize.
As can be seen in Figure 1, the animals presented an important fall in PAO2 and PaO2 which was much more pronounced than ex-pected, causingonly an increase in alveolar carbon dioxide. For this reason, a second mechanism must be responsible for the im-portant hypoxemia observed, such as pul-monary shunt or mismatch between ventila-tion and perfusion (23).
Venous admixture (Qva/Qt) increased significantly. However, this variable does not discriminate venous mixture from true shunt. Despite suggestions that alterations in surfactant synthesis due to pulmonary em-bolism can induce alveolar collapse (8,25), it is hard to believe that these alterations would occur as early as 20 min after PE. Also, the true shunt could hardly be attrib-uted to alveolar exclusion as observed in acute respiratory distress syndrome or in acute pulmonary edema. For these reasons, it is more sensible to attribute the increase of the Qva/Qt ratio to a VA/Q imbalance.
In this model of PE, redistribution of perfusion must have necessarily occurred since there were non-perfused areas in the pulmonary circulation and CO was un-changed.
In this experimental model, the venti-lated, but non-perfused alveoli increased VDalv from 56.38 ± 22.47 at baseline to 178.09 ± 37.46 mL at T20. Actually, the increase in dead space per se does not induce
hypoxemia. For this reason, hypoxemia is attributed to a significant alteration of the VA/Q ratio (3,5,10,14,15,17,25), with alveo-lar ventilation being slightly increased but with perfusion being markedly increased.
The effective alveolar ventilation is de-fined as the ventilation in contact with the pulmonary circulation (26). Although the term “effective alveolar ventilation” is not currently used in respiratory physiology text-books, Levy and Simmons (15), in 1974, introduced this term to characterize exclu-sively the ventilation of areas with main-tained or increased perfusion. The increase in VAeff with time (Figures 3 and 4) was attributed to hypocapnic bronchoconstriction because the authors showed that a group of animals that inhaled 3% CO2 after pulmo-nary embolism did not exhibit the expected increase in VAeff (15).
Vidal Melo et al. (14), after injecting autologous clots in six mechanically venti-lated sheep, confirmed by positron emission tomography scan that there was an increase in regional alveolar ventilation in pulmo-nary areas that remained perfused after em-bolization, as an expression of the redistri-bution of VT mediated by the hypocapnic bronchoconstriction. The quantity and qual-ity of the clots used in the experimental studies may influence the duration and in-tensity of bronchoconstriction. Fresh clots may liberate serotonin because of the pres-ence of thrombin. Robinson et al. (27) showed that serotonin has an important bronchocon-strictor effect when pulmonary emboliza-tion is induced with fresh clots. Levy and Simmons (15) observed a bronchoconstric-tion of 30-min durabronchoconstric-tion after injecbronchoconstric-tion of 30 mL of fresh clots. In our study, bronchocon-striction occurred up to 60 min after embo-lization, as suggested by the progressive increase in effective alveolar ventilation. This finding is attributed to the large quantity of clots (24.66 ± 4.27 mL) and to the added lyophilized bovine thrombin.
In the present study, VDalv as well as P(a-et)CO2 increased significantly at T20 (56.38 ± 22.47 to 178.09 ± 37.46 mL, and
1.94 ± 1.36 to 37.61 ± 12.79 mmHg, respec-tively), but decreased at T40 and T60. This was also observed by Skimming et al. (28) in 11 mechanically ventilated sheep with in-duced acute pulmonary lesion, with the au-thors concluding that P(a-et)CO2 was a good predictor of VDalv. Similarly, Moreira et al. (29), comparing two experimental situations, i.e., PE and hemorrhagic shock, demonstrated a significant increase of P(a-et)CO2 only in PE, which was associated with increased VDalv as measured by volumetric capnogra-phy. The increase in P(a-et)CO2 was signifi-cant and sufficiently specific to suggest the diagnosis of PE.
Based on our data obtained in animals under mechanical ventilation and submitted to pulmonary embolism by injection of auto-logous clots, we conclude that the severe arterial hypoxemia observed must be attrib-uted to the reduction of both VAeff and the VAeff/Q ratio. These variables, as well as the arterial hypoxemia, tended to recover with time, but did not return to baseline levels even after 60 min of embolism. This behav-ior is attributed to the redistribution of the alveolar ventilation induced by hypocapnic bronchoconstriction.
References
1. Wood KE. Major pulmonary embolism: review of a pathophysiologic approach to the golden hour of hemodynamically significant pulmo-nary embolism. Chest 2002; 121: 877-905.
2. Goldhaber SZ, Elliott CG. Acute pulmonary embolism: Part I: epide-miology, pathophysiology, and diagnosis. Circulation 2003; 108: 2726-2729.
3. Altemeier WA, Robertson HT, McKinney S, Glenny RW. Pulmonary embolization causes hypoxemia by redistributing regional blood flow without changing ventilation. J Appl Physiol 1998; 85: 2337-2343.
4. Brimioulle S, Lejeune P, Naeije R. Effects of hypoxic pulmonary vasoconstriction on pulmonary gas exchange. J Appl Physiol 1996; 81: 1535-1543.
5. Huet Y, Lemaire F, Brun-Buisson C, Knaus WA, Teisseire B, Payen D, et al. Hypoxemia in acute pulmonary embolism. Chest 1985; 88: 829-836.
6. Manier G, Castaing Y, Guenard H. Determinants of hypoxemia
during the acute phase of pulmonary embolism in humans. Am Rev Respir Dis 1985; 132: 332-338.
7. Kasinski N, Afonso JE, Ferreira C, dos Santos ML, Ratto OR, Barcellini A. Pulmonary embolism with autologous blood clot. Ex-perimental study in dogs. Arq Bras Cardiol 1980; 34: 203-210. 8. Dantzker DR, Bower JS. Alterations in gas exchange following
pulmonary thromboembolism. Chest 1982; 81: 495-501.
9. Santolicandro A, Prediletto R, Fornai E, Formichi B, Begliomini E, Giannella-Neto A, et al. Mechanisms of hypoxemia and hypocapnia in pulmonary embolism. Am J Respir Crit Care Med 1995; 152: 336-347.
10. Póvoa R, Kasinski N. Hipertensão pulmonar no tromboembolismo pulmonar. Rev Soc Cardiol Estado São Paulo 2000; 5: 590-598. 11. Jatene FB, Bernardo WM. Isquemia pulmonar embólica - aspectos
clínicos e experimentais. Rev Assoc Med Bras 2003; 49: 342-348. 12. Wilson JE III, Pierce AK, Johnson RL Jr, Winga ER, Harrell WR,
J Clin Invest 1971; 50: 481-491.
13. Anderson CT, Breen PH. Carbon dioxide kinetics and capnography during critical care. Crit Care 2000; 4: 207-215.
14. Vidal Melo MF, Harris RS, Layfield D, Musch G, Venegas JG. Changes in regional ventilation after autologous blood clot pulmo-nary embolism. Anesthesiology 2002; 97: 671-681.
15. Levy SE, Simmons DH. Redistribution of alveolar ventilation follow-ing pulmonary thromboembolism in the dog. J Appl Physiol 1974; 36: 60-68.
16. Naeije R, Brimioulle S. Physiology in medicine: importance of hy-poxic pulmonary vasoconstriction in maintaining arterial oxygen-ation during acute respiratory failure. Crit Care 2001; 5: 67-71. 17. Severinghaus JW, Swenson EW, Finley TN, Lategola MT, Williams
J. Unilateral hypoventilation produced in dogs by occluding one pulmonary artery. J Appl Physiol 1961; 16: 53-60.
18. Vidal Melo MF, Layfield D, Harris RS, O’Neill K, Musch G, Richter T, et al. Quantification of regional ventilation-perfusion ratios with PET.
J Nucl Med 2003; 44: 1982-1991.
19. Simon BA, Tsuzaki K, Venegas JG. Changes in regional lung me-chanics and ventilation distribution after unilateral pulmonary artery occlusion. J Appl Physiol 1997; 82: 882-891.
20. Simon BA, Zanaboni PB, Nyhan DP. Effect of hypoxia on respiratory system impedance in dogs. J Appl Physiol 1997; 83: 451-458. 21. Enghoff H. Volumem Inefecax. Bemerkungen zur Frage dês
schaedlichen Raumes. Uppsala Läk For Förh 1938; 44: 191-218. 22. Terzi RGG, Dragosavac D. Ventilação mecânica básica. In:
Carvalho CRR (Editor), Monitorização do intercâmbio gasoso
pulmonar no paciente submetido à ventilação mecânica. São Paulo: Atheneu; 2000. p 189-213.
23. West JB. Fisiologia respiratória. In: West J (Editor), Ventilação -como o gás chega aos alvéolos. São Paulo: Editora Manole; 2002. p 11-20.
24. Marshall BE, Hanson CW, Frasch F, Marshall C. Role of hypoxic pulmonary vasoconstriction in pulmonary gas exchange and blood flow distribution. 2. Pathophysiology. Intensive Care Med 1994; 20: 379-389.
25. Baruzzi ACA, Knobel E, Kasinski N, Junior CJF. Condutas no paciente grave. In: Knobel E (Editor), Tromboembolismo pulmonar. São Paulo: Atheneu; 1994. p 8-19.
26. Stenqvist O, Olausson M, Karlsen KL. Luxury lung perfusion in end-stage liver disease during liver transplantation. Acta Anaesthesiol Scand 1999; 43: 447-451.
27. Robinson AE, Puckett CL, Green JD, Silver D. In vivo demonstration of small-airway bronchoconstriction following pulmonary embolism.
Radiology 1973; 109: 283-286.
28. Skimming JW, Banner MJ, Spalding HK, Jaeger MJ, Burchfield DJ, Davenport PW. Nitric oxide inhalation increases alveolar gas ex-change by decreasing deadspace volume. Crit Care Med 2001; 29: 1195-1200.