D e ve lo pme ntal no rms fo r the
Gardne r Ste adine ss Te st and the Purdue
Pe gbo ard: a study with childre n o f
a me tro po litan scho o l in Brazil
1Laboratório de Neuropsicologia Clínica, Setor de Neurociências,
Departamento de Pediatria, Instituto Fernandes Figueira, FIO CRUZ, Rio de Janeiro, RJ, Brasil
2Laboratório de Neuropsicologia Clínica, Setor de Neurociências,
Universidade Federal Fluminense, Niterói, RJ, Brasil G.N.O . Brito1,2
and T.R. Santos-Morales1
Abstract
Norms for the Gardner Steadiness Test and the Purdue Pegboard were developed for the neuropsychological assessment of children in the metropolitan area of Rio de Janeiro. A computer-generated unbiased sample of 346 children with a mean age of 9.4 years (SD = 2.76), who were attending a large normal public school in this urban area, was the subject of this study. Two boys were removed from the study, one for refusing to participate and the other due to severe strabismus. There-fore, the final sample contained 344 children (173 boys and 171 girls). Sex and age of the child and hand preferred for writing, but not ethnic membership or social class, had significant effects on performance in the Gardner Steadiness Test and the Purdue Pegboard. Girls outper-formed boys. Older children peroutper-formed better than younger children. However, the predictive relationship between age of the child and neuropsychological performance included linear and curvilinear com-ponents. Comparison of the present results to data gathered in the United States revealed that the performance of this group of Brazilian children is equivalent to that of US children after Bonferroni’s correc-tion of the alpha level of significance. It is concluded that sex and age of the child and hand preferred for writing should be taken into account when using the normative data for the two instruments evaluated in the present study. Furthermore, the relevance of neurobe-havioral antidotes for the obliteration of some of the probable neuro-psychological effects of cultural deprivation in Brazilian public school children is hypothesized.
Co rre spo nde nce
G.N.O . Brito Caixa Postal 100846 24001-970 Niterói, RJ Brasil
E-mail: ccsgnob@ vm.uff.br Research supported by FUNPENE. This study was performed under the auspices of the agreement celebrated between the Instituto Fernandes Figueira (FIO CRUZ) and the Instituto de Educação Prof. Ismael Coutinho (IEPIC).
Received July 17, 2001 Accepted May 24, 2002
Ke y words
•Neuropsychology •Assessment instruments •Norms
•Development
•Cross-cultural differences •Manual differences •Sex differences •Brazil
•Metropolitan children
Intro ductio n
Research in child neuropsychology in Brazil is hindered by the lack of appropriate normative information for neurobehavioral assessment instruments. As emphasized by
description of the demographic characteris-tics of the participants and the use of rather crude statistical procedures render the data of limited value for use in the Brazilian setting (cf. 1). The need for adequate locally derived normative data for instruments used in the neuropsychological assessment of chil-dren cannot be overemphasized (1).
One of the purposes of our research pro-gram is the development of adequate norma-tive data for neuropsychological instruments used in the assessment of children and adults in Brazil. Our previous efforts in this direc-tion have made several neurobehavioral as-sessment instruments available for use in this country: the Conners Abbreviated Teacher Rating Scale (3,4), the Composite Teacher Rating Scale (5,6), the Edinburgh Handedness Inventory (7-10), the Attention Deficit Hyperactivity Disorder (ADHD) (DSM-IIIR) Teacher Rating Scale (11), the Bender Gestalt Test (1,12), the Benton Right-Left Discrimination Test, Motor Persistence Tests, the Color Span Test, and WISC-R’s Digit Span Test (1). The clinical applications and relevance of these instruments for re-search in child neuropsychology in Brazil have been described by Brito et al. (13).
The Gardner Steadiness Test (14) and the Purdue Pegboard (15) were examined in the present study because performance on both instruments has been reported to be fre-quently impaired in developmentally dis-abled children and brain-damaged adults (for reviews, see 14,16,17).
As emphasized by Gardner (14), the Steadiness Test was not designed to be a simple test for the presence of developmen-tal disabilities involving hyperactivity and attentional deficits since it also measures motor persistence and motor coordination. Additionally, abnormal movements such as resting tremors and choreiform movements, and tension and anxiety may affect perfor-mance. However, the results derived from this test in conjunction with data obtained with other assessment instruments and the
clinical history of the child may allow the examiner to conclude which neurobehav-ioral function is probably impaired. Along this line, Gardner (14) reported the useful-ness of the Steadiuseful-ness Test for monitoring drug treatment of ADHD children with psychostimulants. Furthermore, he demon-strated that psychostimulant-induced im-provement in the performance of this test usually corresponds with parent description of improved behavior. Moreover, perfor-mance in this instrument also proved useful for adjusting drug dosage level when the child is being maintained on medication.
In the present paper, we describe devel-opmental norms for the Gardner Steadiness Test (14) and the Purdue Pegboard (15) ap-plied to Brazilian children attending a large normal public school located in the metro-politan area of Rio de Janeiro. However, the scope of these tests was expanded with the addition of procedures not included in the standard administration of both instruments. The objective of the addition of these proce-dures was to derive several different meas-ures of performance with each hand in order to ascertain performance differences between the preferred and the non-preferred hands better than presently possible. As described above, performance differences between hands might have important clinical impli-cations for neuropsychological assessment and rehabilitation (see 16).
Mate rial and Me thods
Subje cts
A computer-generated unbiased sample of 346 children was the subject of this study. The children had a mean age of 9.4 years (standard deviation = 2.76) and were drawn from a large normal public school in the greater Rio de Janeiro area (Niterói) with over 2,000 registered children in preschool, elementary and junior high school classes. As emphasized in previous publications (1,11,12), we selected the only normal school in this metropolitan area for our research program dealing with the development of normative data for instruments used in the neuropsychological assessment of children not only due to its large number of children but, more importantly, because it attracts children from all ethnic groups and social strata, albeit mostly from lower social classes, with place of residence in communities dis-tributed throughout the city of Niterói and adjoining municipalities (São Gonçalo, Itaboraí and Maricá, RJ, Brazil). Although the children were not subjected to a
the left hand, a frequency distribution con-sistent with data reported elsewhere (9,10). Thirty-three (9.5%) children in need of neu-rological, psychological or speech therapy, according to their teachers, were included in the normative sample. Therefore, it is pre-sumed that the unbiased sample of partici-pants drawn from a large pool of children in attendance of the normal school selected for the present study is representative of the population of public school children in the metropolitan area of Rio de Janeiro.
Ne uropsychological batte ry
The neuropsychological battery used in the present study was administered during two sessions (one session a day) during the academic years of 1999 and 2000 and con-sisted of the tests listed below in the order administered. Children were tested individu-ally in a quiet and air-conditioned room of the school.
The first session included the following tests:
Edinburgh Handedness Inventory (21). The procedures for the administration of the Edinburgh Handedness Inventory in chil-dren were as described (9,10). The Edinburgh Handedness Inventory was administered to the participants of the present study in order to investigate the relationships between manual preference, as assessed by the inven-tory, and manual specialization, as assessed by the two instruments described below. Analysis of these data is currently being conducted and will be the subject of a sepa-rate report. For the present study, however, the item of the inventory related to the hand preferred for writing was used to classify children as right- or left-handed.
Gardner Steadiness Test. The procedures for this test were reported by Gardner (14). Initially, the examiner demonstrates how to hold a stylus in a hole mounted on a metal board without making contact with the metal, while standing in front of the board. Also,
the examiner demonstrates how a sound is produced when an error is made, i.e., when contact between the stylus and the hole is made. The length of the stylus, the diameter of the hole and the distance between the stylus tip and the handle point where the child grips are all standardized (14). Two digital clocks are used, one to measure the duration of the trial and the other to measure touch time during the trial. A counter col-lects the number of contacts made between the stylus and the metal. In order to be counted the contact has to last at least 100 ms. In the original administration, three trials of 60 s were administered only with the hand the child preferred to use in the test. In the present study, however, similar data were also collected with the non-preferred hand. Trials for each hand were administered alter-nately. Total number of contacts and total touch time across three trials were used for data analysis.
The second session consisted of the fol-lowing test:
three trials with each hand alternately. In each trial, the child is asked to place ten pegs with either the preferred or the non-pre-ferred hand as rapidly as he or she possibly can and the time taken to perform the task is recorded with a stopwatch. The second task was a modification of the task described by Annett (22). Again, three trials are adminis-tered with the child alternatively using the preferred and non-preferred hand. In each trial, the child is requested to move ten pegs from the left to the right row of holes if his or her preferred hand is the right hand and move them back to the left row with the non-preferred (left) hand. The procedure is re-versed if the child’s preferred hand is the left hand. Time to perform the transfer of the pegs is recorded with a stopwatch. After completion of these two tasks, the last task of the standard procedure is administered. In this task, the child is requested to build “as-semblies” of a peg, a washer, a collar and another washer. The examiner instructs the child that the fastest way to form the “assem-blies” is to alternate hands. Only one row of holes is used and the single trial duration is 60 s. The total number of items (pegs, wash-ers and collars) assembled in the allotted time is recorded.
Statistical analysis
Statistical procedures available in the Sta-tistical Analysis System package (23) were used for data analysis and followed the same principles as described in a previous report (1). Briefly, the data referring to the Gardner Steadiness Test and the Purdue Pegboard were initially subjected to multivariate anal-ysis of variance (MANOVA) in order to control the experimentwise error rate. Sex, age, hand used for writing, ethnic group, social class and need for treatment were the independent variables. The Gardner Steadi-ness Test provided four dependent (neuro-psychological) variables, each representing totals across the three trials administered for
each hand, i.e., number of contacts and touch time. The Purdue Pegboard provided eight dependent (neuropsychological) variables: number of pegs placed with each hand, num-ber of pairs of pegs placed with both hands, total time to place ten pegs with each hand across three trials, total time to transfer ten pegs with each hand across three trials and total number of items assembled in the “as-sembly” modality of the test. A significant MANOVA was followed by univariate ANOVAs for each dependent variable with age and sex as the independent variables. When the ANOVA was significant, post hoc
Scheffé’s tests were performed. Addition-ally, polynomial regression analyses were also performed to determine trends in per-formance with age. Moreover, the perfor-mance of Rio de Janeiro children was com-pared to that of their US counterparts by bilateral t-tests across sex and age groups with (and without) Bonferroni correction for error rates. In order to compare the perfor-mance of Brazilian and US children, how-ever, the age of Brazilian children was en-tered into the analysis in yearly intervals exactly as presented by Gardner (14) in his normative studies of the Steadiness Test and the Purdue Pegboard in US children.
Re sults
MANOVAs and ANOVAs, where appli-cable, of data on the effects of ethnic group, social class and need for treatment on the neuropsychological variables derived from the Gardner Steadiness Test and the Purdue Pegboard revealed no significant statistical effects. Therefore, there will be no further mention of ethnic group, social class and need for treatment in the presentation of the results.
with the right hand in children who preferred to write with the left hand, and the inverse was also true. Multiple paired t-tests with Bonferroni’s correction for the alpha level of significance confirmed that the perfor-mance of the left hand was significantly better than the performance of the right hand for each of the variables derived from the Gardner Steadiness Test and the Purdue Peg-board (with the exclusion of performance with both hands and the assembly modality) in children who preferred to write with the left hand. Likewise, the performance of the right hand was significantly better than the performance of the left hand for each of the variables derived from those two tests in children who preferred to write with the right hand.
Hand used for writing, however, had no significant multivariate effect when the neuro-psychological variables entered into the analy-sis were those related to performance of the preferred or non-preferred hand on the two tests described in the present study. In the case of the Gardner Steadiness Test, these variables were total number of contacts and total touch time with the left or right hand for children who preferred to write with the left or right hand, respectively, and total number of con-tacts and total touch time with the right or left hand for children who preferred to write with the left or right hand, respectively. For the Purdue Pegboard, the variables entered into the multivariate analysis were number of pegs placed with the left or right hand, total time to place ten pegs with the left or right hand, and total time to transfer ten pegs with the left or right hand for children who preferred to write with the left or right hand, respectively, and number of pegs placed with the right or left hand, total time to place ten pegs with the right or left hand, and total time to transfer ten pegs with the right or left hand for children who preferred to write with the left or right hand, respectively. Performance with both hands and in the assembly modality were also in-cluded in the analysis. The lack of a significant
multivariate effect for hand used for writing on the variables just described was confirmed by multiple t-tests for independent samples which did not reveal a significant effect for any of the pairwise comparisons included in the multi-variate analysis.
Taken together, the results described above demonstrate that the performance of the left hand was better than that of the right hand in children who preferred to write with the left hand and the inverse was also true. Furthermore, these results clearly show that there were no differences in performance between the left hand of children who pre-ferred to write with the left hand and the right hand of children who preferred to write with the right hand. Likewise, there were no differences in performance between the right hand of children who preferred to write with the left hand and the left hand of children who preferred to write with the right hand. Moreover, the performance of children who preferred to write with the left hand was equivalent to that of children who preferred to write with the right hand in the two bi-manual tasks of the Purdue Pegboard, i.e., both hands and the assembly modality. These results allowed us to combine the data for the performance of the left hand of children who preferred to write with the left hand with that of the right hand of children who preferred to write with the right hand as preferred-hand performance and similarly to combine the data for the performance of the right hand of children who preferred to write with the left hand with that of the left hand of children who preferred to write with the right hand as non-preferred-hand performance. Therefore, the remainder of the statistical analysis and the normative data presented below will deal with performance of the hand preferred and non-preferred for writing in lieu of perfor-mance of the left and right hand.
Gardne r Ste adine ss Te st
in the Gardner Steadiness Test revealed sig-nificant effects of sex (F = 7.87, d.f. = 4,307, P = 0.0001) and age (F = 6.06, d.f. = 64,1204, P = 0.0001). Univariate ANOVAs showed significant sex and age effects for each of the variables derived from this test: total number of contacts with the preferred hand (sex: F = 31.16, d.f. = 1,310, P = 0.0001; age: F = 20.78, d.f. = 16,310, P = 0.0001), total num-ber of contacts with the non-preferred hand (sex: F = 23.25, d.f. = 1,310, P = 0.0001; age: F = 17.35, d.f. = 16,310, P = 0.0001), total touch time with the preferred hand (sex: F = 8.46, d.f. = 1,310, P = 0.0039; age: F = 17.21, d.f. = 16,310, P = 0.0001), and total touch time with the non-preferred hand (sex: F = 12.11, d.f. = 1,310, P = 0.0006; age: F = 19.71, d.f. = 16,310, P = 0.0001). Girls had
significantly lower scores (i.e., better perfor-mance) than boys. Additionally, post hoc
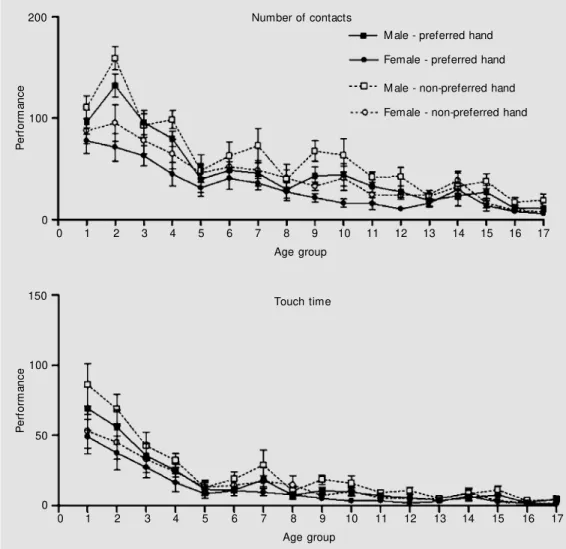
analysis of the data showed that older chil-dren had better performance than younger children for each of the variables described above. However, polynomial regression analyses indicated not only statistically sig-nificant (all P = 0.0001) linear, but also quadratic age trends for each of the variables derived from the Gardner Steadiness Test. Therefore, the predictive relationship be-tween age of the child and neuropsychologi-cal performance includes both linear and curvilinear components, as illustrated in Fig-ure 1.
As expected, total number of contacts and total touch time with both the preferred and non-preferred hands correlated
signifi-P
e
rf
o
rm
a
n
c
e
200
100
0
P
e
rf
o
rm
a
n
c
e
150
100
50
0
0 1 2 3 4 5 6 7 8 9 10 11 12 13 14 15 16 17
Age group
0 1 2 3 4 5 6 7 8 9 10 11 12 13 14 15 16 17
Age group Touch time Number of contacts
M ale - preferred hand
Female - preferred hand
M ale - non-preferred hand
Female - non-preferred hand
cantly (r = 0.77, P = 0.0001 and r = 0.79, P = 0.0001, respectively).
Appendix 1 shows the normative results for the variables derived from the Gardner Steadiness Test for boys and girls across age. Data are presented separately for the pre-ferred and non-prepre-ferred hands.
Comparison of our data with those re-ported by Gardner (14) revealed that Brazil-ian boys performed significantly worse than US boys only in the 5-0 to 5-11 age range. In addition, Brazilian girls performed signifi-cantly better in the 10-0 to 10-11 age range, but significantly worse in the 11-0 to 11-11 age range in comparison with US girls. Per-formance differences between Brazilian and US children were, nevertheless, eliminated after the application of Bonferroni’s correc-tion for the alpha level of significance. (Brazil-ian-US children comparison data are avail-able from the first author).
Purdue Pegboard
A MANOVA of the data for the perfor-mance of the Purdue Pegboard revealed sig-nificant effects of sex (F = 3.88, d.f. = 8,303, P = 0.0002) and age (F = 6.62, d.f. = 128,2197, P = 0.0001). Univariate ANOVAs showed significant sex and age effects for each of the variables derived from this instrument, ex-cept for total time to transfer ten pegs with the non-preferred hand across three trials, which showed a significant age, but not sex, effect: number of pegs placed with the pre-ferred hand (sex: F = 16.53, d.f. = 1,310, P = 0.0001; age: F = 41.29, d.f. = 16,310, P = 0.0001), number of pegs placed with the non-preferred hand (sex: F = 15.36, d.f. = 1,310, P = 0.0001; age: F = 39.36, d.f. = 16,310, P = 0.0001), number of pairs of pegs placed with both hands (sex: F = 3.94, d.f. = 1,310, P = 0.0480; age: F = 34.16, d.f. = 16,310, P = 0.0001), total time to place ten pegs with the preferred hand across three trials (sex: F = 11.24, d.f. = 1,310, P = 0.0009; age: F = 61.91, d.f. = 16,310, P =
0.0001), total time to place ten pegs with the non-preferred hand across three trials (sex: F = 7.48, d.f. = 1,310, P = 0.0066; age: F = 47.07, d.f. = 16,310, P = 0.0001), total time to transfer ten pegs with the preferred hand across three trials (sex: F = 5.00, d.f. = 1,310, P = 0.0261; age: F = 61.13, d.f. = 16,310, P = 0.0001), total time to transfer ten pegs with the non-preferred hand across three trials (sex: F = 1.38, d.f. = 1,310, P = N.S.; age: F = 52.72, d.f. = 16,310, P = 0.0001) and the total number of items assembled in the “as-sembly” modality of the test (sex: F = 16.14, d.f. = 1,310, P = 0.0001; age: F = 49.37, d.f. = 16,310, P = 0.0001). Except for total time to transfer ten pegs with the non-preferred hand across three trials, for which there was no significant effect of sex, the data demon-strated that girls had significantly better scores than boys on each of the variables described above. Additionally, post hoc analysis of the data showed that the older the child the better the performance in each of the vari-ables derived from the Purdue Pegboard. However, as demonstrated for the Gardner Steadiness Test, polynomial regression analy-ses revealed statistically significant (all P = 0.0001) linear and quadratic age trends for each of the variables derived from the Purdue Pegboard. Therefore, the predictive relation-ship between age of the child and neuropsy-chological performance in both instruments includes linear and curvilinear components. Appendix 2 shows the normative results for the variables derived from the Purdue Pegboard for boys and girls across age. Data are reported separately for the preferred and non-preferred hands, both hands and the assembly modality.
Brazilian children. Likewise, US boys and girls demonstrated better performance with the non-preferred hand in six and three age groups, respectively. Additionally, perfor-mance with both hands was better for US boys and girls in four and three age groups, respectively. However, Brazilian boys and girls showed better performance in the more complex assembly modality in six and five age groups, respectively. Bonferroni’s cor-rection for the alpha level of significance eliminated each of the performance differ-ences between US and Brazilian children determined by multiple t-tests. (Brazilian-US children comparison data are available from the first author).
Pe rformance diffe re nce s be twe e n hands
A MANOVA of the between-hand (non-preferred minus (non-preferred) performance dif-ference scores for total number of contacts and total touch time (Gardner Steadiness Test) and number of pegs placed individu-ally with each hand, total time to place ten pegs and total time to transfer ten pegs (Purdue Pegboard) revealed a significant age effect (F = 1.87, d.f. = 80,1477, P = 0.0001). Sex, however, had no significant multivari-ate effect on between-hand differential per-formance, i.e., the performance differences between the non-preferred and the preferred hand were equivalent in boys and girls. Ap-pendix 3 shows the normative results for the between-hand performance difference scores across age for variables derived from the Gardner Steadiness Test and the Purdue Peg-board.
D iscussio n
The results demonstrate that ethnic group, social class and need for treatment (accord-ing to the teacher) had no effect on perfor-mance in the Gardner Steadiness Test and the Purdue Pegboard. As expected, hand preference for writing had a significant
mul-tivariate effect on performance and there-fore has to be taken into account in the derivation of the normative data for these two neuropsychological assessment instru-ments. Additionally, girls outperformed boys and older children performed the Gardner Steadiness Test and the Purdue Pegboard better than younger children. The predictive relationship between age of the child and performance included both linear and curvi-linear components. The performance differ-ences between the preferred and the non-preferred hands in the Gardner Steadiness Test and the Purdue Pegboard demonstrated a significant age, but not sex, effect.
Moreover, comparison of the data herein presented to those obtained in the US showed a few significant differences between the two groups of children which were, never-theless, eliminated after application of Bon-ferroni’s correction for the alpha level of significance.
occupation, an index of social class, on neu-ropsychological performance was attributed to the fact that such information was missing for a substantial number of the children in the sample. However, in the present report, data for social class were missing for only four children in the sample and so the lack of effect of socioeconomic status on perfor-mance in the Gardner Steadiness Test and the Purdue Pegboard cannot be explained by limitations in data. It is, of course, plausible that the reduced number of children in the upper social classes in our sample may have limited our ability to detect a significant effect of social class on the performance in the two instruments. This remains to be de-termined in future studies.
The significant effect of age on perfor-mance in the Gardner Steadiness Test and the Purdue Pegboard reported in the present study is consistent with data reported by other investigators (14,17). Additionally, our data show that the predictive relationship between age and neuropsychological perfor-mance includes both linear and curvilinear components. Furthermore, age had a signifi-cant effect on the between-hand performance difference scores in both tests. Therefore, the age of the child should be considered when using the normative data herein pre-sented. Moreover, the effect of age on neuro-psychomotor performance, as reported in the present study, is in agreement with a recent model of the role of the brain in human cognitive development (24) and a neuropsychological theory of motor skill learning (25). In addition, it has been re-ported that age has a significant effect on the performance in other instruments used in the assessment of motor function (26). Lastly, it is well known that the primate motor system has a prolonged developmental trajectory (for a review, see 27).
As reported in the present study and in previous publications from our group (1,12), and consistent with data from other investi-gators (e.g., 16), there seems to be a
differen-tial rate of neuropsychological development for boys and girls in the sense that girls usually outperform boys in most assessment instruments. On a molecular level, it may be suggested that the better neuropsychological performance of girls is related to develop-mental differences between the sexes in ba-sic mechanisms of neuronal plasticity in the brain (see 28). Furthermore, differences in neuropsychological performance between boys and girls may depend on the extent of recruitment of populations of cortical neu-rons likely to be selectively activated during the planning and execution of a particular behavioral task (e.g., 29). It can be surmised that between-sex differences in the develop-ment of neuropsychological functions de-pend on epigenetic factors (e.g., hormones) impinging upon the brain during neural de-velopment.
taken together with the results herein de-scribed, seem to provide further support for the hypothesis that the limited extent of for-mal academic instruction in Brazilian metro-politan public schools may lead to specific underdevelopment of secondary abilities (31) or scientific concepts (32), as proposed by Brito and colleagues (1) and consistent with recent ideas formulated by Michel (33) and Gottlieb (34). Therefore, we hypothesize that neurobehavioral antidotes along the lines advanced by Hunt (35) almost half a century ago might eliminate at least some of the neuropsychological effects of cultural depri-vation found in Brazilian metropolitan
pub-lic school children (1).
Ackno wle dgm e nts
The authors are grateful to Angela Guedes (NPD-UFF) for assistance in the use of the SAS package, Rubem Goulart (NPD-UFF) for assistance in the maintenance of com-puter systems, and Tatianna R. Santos for assistance with the preparation of the manu-script. The authors also wish to thank the children who participated in the study, their teachers and the staff of IEPIC (Instituto de Educação Prof. Ismael Coutinho).
Re fe re nce s
1. Brito GNO, Alfradique GM N, Pereira CCS, Porto CM B & Santos TR (1998). Develop-mental norms for eight instruments used in the neuropsychological assessment of children: studies in Brazil. Brazilian Jour-nal of M edical and Biological Research, 31: 399-412.
2. Cunha JA (1993). Psicodiagnóst ico -Revisão. Artes M édicas, Porto Alegre, RS, Brazil.
3. Brito GNO (1987). The Conners Abbrevi-ated Teacher Rating Scale: Development of norms in Brazil. Journal of Abnormal Child Psychology, 15: 511-518.
4. Brito GNO (1987). The Conners Abbrevi-ated Teacher Rating Scale: a factor analy-sis study in Brazil. Brazilian Journal of M edical and Biological Research, 20: 553-556.
5. Brito GNO & Pinto RCA (1991). A Com-posite Teacher Rating Scale: Analysis in a sample of Brazilian children. Journal of Clinical and Experimental Neuropsychol-ogy, 13: 417-418.
6. Brito GNO (1999). Escala de Avaliação do Comportamento Infantil para o Professor (EACI-P). 1st edn. Editora Entreletras, Rio de Janeiro, RJ, Brazil.
7. Brito GNO, Brito LSO & Paumgartten FJR (1985). Effect of age on handedness in Brazilian adults is sex-dependent. Percep-tual and M otor Skills, 61: 829-830. 8. Brito GNO, Brito LSO, Lins M FC &
Paum-gartten FJR (1989). Lateral preferences in Brazilian adults: An analysis w ith the Edinburgh Inventory. Cortex, 25: 403-415.
9. Brito GNO, Lins M FC, Paumgartten FJR & Brito LSO (1992). Hand preference in 4-to 7-year-old children: An analysis w ith the Edinburgh Inventory in Brazil. Devel-opmental Neuropsychology, 8: 59-68. 10. Brito GNO & Santos-M orales TR (1999).
Lateral preferences in 8- to 15-year-old Brazilian children assessed w it h t he Edinburgh Inventory: Different measures of handedness and com parison w it h younger children and adults. Developmen-tal Neuropsychology, 16: 433-453. 11. Brito GNO, Lins M FC & Pinto RCA (1995).
A behavioral assessment scale for Atten-tion Deficit Disorder in Brazilian children based on DSM -III-R criteria. Journal of Ab-normal Child Psychology, 23: 509-520. 12. Brito GNO & Santos TR (1996). The
Bender Gestalt Test in 5- to 15-year-old Brazilian children: norms and validity. Bra-zilian Journal of M edical and Biological Research, 29: 1513-1518.
13. Brito GNO, Pereira CCS & Santos-M orales TR (1999). Behavioral and neuropsycho-logical correlates of hyperactivity and inat-tention in Brazilian school children. Devel-opmental M edicine and Child Neurology, 41: 732-739.
14. Gardner RA (1979). The Objective Diag-nosis of M inimal Brain Dysfunction. Crea-tive Therapeutics, Cresskill, NJ, USA. 15. Tiffin J (1968). Purdue Pegboard:
Exam-iner M anual. Science Research Associ-ates, Chicago, IL, USA.
16. Lezak M D (1995). Neuropsychological As-sessment. 3rd edn. Oxford University
Press, New York, NY, USA.
17. Spreen O & Strauss E (1998). A Compen-dium of Neuropsychological Tests. 2nd edn. Oxford University Press, New York, NY, USA.
18. Hollingshead AB & Redlich FC (1958). So-cial Class and M ental Illness. Wiley, New York, NY, USA.
19. Sondik EJ, Lucas JW, M adans JH & Smith SS (2000). Race/ethnicity and the 2000 Census: Implications for public health. American Journal of Public Health, 90: 1709-1713.
20. Nobles M (2000). History counts: A com-parative analysis of racial/color categoriza-tion in US and Brazilian censuses. Ameri-can Journal of Public Health, 90: 1738-1745.
21. Oldfield RC (1971). The assessment and analysis of handedness: The Edinburgh Inventory. Neuropsychologia, 9: 97-113. 22. Annett M (1970). A classification of hand
preference by association analysis. Brit-ish Journal of Psychology, 61: 303-321. 23. SAS Institute (1990). SAS/STAT User’s
Guide. Vol. 2. 4th edn. SAS Institute, Cary, NC, USA.
24. Epstein HT (2001). An outline of the role of brain in human cognitive development. Brain and Cognition, 45: 44-51.
25. Willingham DB (1998). A neuropsychologi-cal theory of motor skill learning. Psycho-logical Review, 105: 558-584.
hand-edness. Journal of Neural Transmission, 107: 73-85.
27. Lemon RN (1999). Neural control of dex-terity: w hat has been achieved? Experi-mental Brain Research, 128: 6-12. 28. Karni A, M eyer G, Rey-Hipolito C, Jezzard
P, Adams M M , Turner R & Ungerleider LG (1998). The acquisition of skilled mo-tor performance: fast and slow experi-ence-driven changes in primary motor cor-tex. Proceedings of the National Acade-my of Sciences, USA, 95: 861-868. 29. Darian-Smith I, Burman K & Darian-Smith
C (1999). Parallel pathw ays mediating manual dexterity in the macaque. Experi-mental Brain Research, 128: 101-108. 30. Rosenbaum DA, Carlson RA & Gilmore
RO (2001). Acquisition of intellectual and perceptual-motor skills. Annual Review of Psychology, 52: 453-470.
31. Geary DC (1996). Sexual selection and sexual differences in mathematical abili-ties. Behavioral and Brain Sciences, 19: 229-284.
32. Vygotsky L (1986). Thought and Lan-guage. M IT Press, Cambridge, UK.
33. M ichel GF (2001). A developm ent al-psychobiological approach to develop-mental neuropsychology. Developmental Neuropsychology, 19: 11-32.
34. Gottlieb G (2001). The relevance of devel-opmental-psychobiological metatheory to developmental neuropsychology. Devel-opmental Neuropsychology, 19: 1-9. 35. Hunt JM (1964). The psychological basis
Appendix 1. Performance in the Gardner Steadiness Test for boys and girls across age.
Age Number of contacts
Preferred hand Non-preferred hand
M ale Female M ale Female
5.0-5.5 M eans ± SD 96.0 ± 39.9 77.7 ± 39.7 110.7 ± 38.7 87.4 ± 40.7
N 11 10 11 10
95% CI 69.1-122.8 49.2-106.1 84.7-136.7 58.2-116.5
5.6-5.11 M eans ± SD 132.2 ± 34.2 71.4 ± 42.6 159.1 ± 34.2 95.2 ± 57.2
N 9 10 9 10
95% CI 105.8-158.5 40.8-101.9 132.8-185.4 54.2-136.1
6.0-6.5 M eans ± SD 95.7 ± 38.1 62.9 ± 31.3 92.9 ± 36.8 77.9 ± 42.6
N 10 10 10 10
95% CI 68.4-122.9 40.5-85.2 66.5-119.2 47.4-108.3
6.6-6.11 M eans ± SD 79.7 ± 23.8 44.7 ± 36.8 98.5 ± 28.0 64.8 ± 45.9
N 10 10 10 10
95% CI 62.6-96.7 18.3-71.0 78.4-118.5 31.9-97.6
7.0-7.5 M eans ± SD 39.7 ± 37.7 31.3 ± 27.2 48.0 ± 44.6 45.8 ± 29.5
N 8 10 8 10
95% CI 8.1-71.3 11.7-50.8 10.6-85.3 24.6-66.9
7.6-7.11 M eans ± SD 48.4 ± 29.2 40.5 ± 33.2 62.6 ± 48.0 51.9 ± 35.3
N 12 10 12 10
95% CI 29.8-66.9 16.6-64.3 32.1-93.1 26.5-77.2
8.0-8.5 M eans ± SD 45.6 ± 40.7 35.9 ± 21.7 72.7 ± 53.6 48.5 ± 25.7
N 10 10 10 10
95% CI 16.4-74.7 20.3-51.4 34.3-111.0 30.0-66.9
8.6-8.11 M eans ± SD 29.5 ± 27.7 27.2 ± 29.5 39.5 ± 28.9 40.9 ± 44.6
N 10 11 10 11
95% CI 9.6-49.3 7.4-47.1 18.7-60.2 10.9-70.9
9.0-9.5 M eans ± SD 43.1 ± 27.0 21.4 ± 13.4 67.5 ± 31.8 32.8 ± 13.5
N 10 10 10 10
95% CI 23.7-62.4 11.7-31.0 44.7-90.2 23.0-42.5
9.6-9.11 M eans ± SD 43.9 ± 36.8 16.0 ± 11.4 63.2 ± 54.4 40.7 ± 33.8
N 11 8 11 8
95% CI 19.1-68.6 6.4-25.5 26.6-99.8 12.4-69.0
10.0-10.5 M eans ± SD 32.7 ± 20.0 15.6 ± 18.9 41.7 ± 15.6 24.3 ± 25.4
N 10 10 10 10
95% CI 18.3-47.0 2.0-29.1 30.4-52.9 6.0-42.5
10.5-10.11 M eans ± SD 27.2 ± 17.2 10.3 ± 8.0 42.2 ± 28.3 23.8 ± 13.4
N 10 10 10 10
95% CI 14.8-39.5 4.5-16.0 21.8-62.5 14.1-33.4
11.0-11.5 M eans ± SD 18.7 ± 21.0 16.0 ± 9.1 22.8 ± 18.5 24.4 ± 13.7
N 10 10 10 10
95% CI 3.6-33.7 9.4-22.5 9.5-36.0 14.5-34.2
11.6-11.11 M eans ± SD 23.4 ± 30.9 29.6 ± 21.5 32.4 ± 41.2 38.5 ± 29.4
N 10 10 10 10
95% CI 1.2-45.5 14.1-45.0 2.9-61.8 17.4-59.5
12.0-12.11 M eans ± SD 26.9 ± 21.3 13.4 ± 16.9 37.6 ± 23.3 16.0 ± 15.2
N 10 11 10 11
95% CI 11.6-42.1 2.0-24.8 20.9-54.2 5.8-26.3
13.0-13.11 M eans ± SD 10.8 ± 11.3 7.7 ± 5.7 16.9 ± 15.0 9.1 ± 5.8
N 11 10 11 10
95% CI 3.1-18.4 3.6-11.7 6.8-26.9 4.9-13.2
14.0-15.11 M eans ± SD 11.2 ± 13.1 5.4 ± 5.2 18.9 ± 21.1 7.6 ± 6.1
N 11 11 11 11
95% CI 2.4-20.0 1.8-9.0 4.6-33.1 3.5-11.7
Appendix 1. Continued.
Age Touch time (s)
Preferred hand Non-preferred hand
M ale Female M ale Female
5.0-5.5 M eans ± SD 69.1 ± 51.3 49.1 ± 39.0 86.1 ± 50.1 52.9 ± 38.0
N 11 10 11 10
95% CI 34.6-103.7 21.1-77.0 52.4-119.7 25.7-80.1
5.6-5.11 M eans ± SD 55.7 ± 37.1 37.3 ± 38.4 68.7 ± 31.5 44.9 ± 37.8
N 9 10 9 10
95% CI 27.2-84.2 9.8-64.8 44.4-92.9 17.8-72.0
6.0-6.5 M eans ± SD 35.5 ± 26.7 27.2 ± 23.3 42.5 ± 29.8 33.0 ± 30.0
N 10 10 10 10
95% CI 16.3-54.6 10.5-43.9 21.1-63.9 11.5-54.5
6.6-6.11 M eans ± SD 25.0 ± 13.8 16.2 ± 19.7 32.0 ± 15.7 23.8 ± 23.2
N 10 10 10 10
95% CI 15.1-34.9 2.1-30.3 20.7-43.2 7.2-40.5
7.0-7.5 M eans ± SD 11.5 ± 13.0 8.4 ± 9.2 12.8 ± 14.5 12.9 ± 11.2
N 8 10 8 10
95% CI 0.5-22.4 1.8-15.0 0.6-24.9 4.9-20.9
7.6-7.11 M eans ± SD 11.1 ± 7.8 10.5 ± 10.2 18.7 ± 18.0 14.3 ± 12.0
N 12 10 12 10
95% CI 6.1-16.1 3.2-17.8 7.2-30.2 5.7-22.9
8.0-8.5 M eans ± SD 18.2 ± 27.7 9.3 ± 7.7 28.7 ± 34.2 17.2 ± 12.4
N 10 10 10 10
95% CI 0.0-38.1 3.8-14.9 4.2-53.2 8.3-26.1
8.6-8.11 M eans ± SD 7.3 ± 8.2 7.6 ± 10.9 10.2 ± 8.6 14.7 ± 21.0
N 10 11 10 11
95% CI 1.4-13.1 0.3-14.9 4.0-16.3 0.5-28.8
9.0-9.5 M eans ± SD 10.6 ± 7.8 5.0 ± 4.3 18.4 ± 10.9 6.9 ± 3.4
N 10 10 10 10
95% CI 5.0-16.2 1.9-8.1 10.6-26.2 4.4-9.4
9.6-9.11 M eans ± SD 9.5 ± 9.1 3.3 ± 2.3 15.9 ± 17.2 10.0 ± 8.7
N 11 8 11 8
95% CI 3.4-15.7 1.3-5.2 4.3-27.5 2.6-17.3
10.0-10.5 M eans ± SD 6.9 ± 4.2 3.4 ± 4.6 9.1 ± 3.3 5.1 ± 6.0
N 10 10 10 10
95% CI 3.8-9.9 0.0-6.7 6.7-11.5 0.8-9.5
10.5-10.11 M eans ± SD 5.6 ± 3.8 1.9 ± 1.4 10.5 ± 7.5 5.1 ± 3.7
N 10 10 10 10
95% CI 2.8-8.3 0.9-2.9 5.1-15.9 2.5-7.8
11.0-11.5 M eans ± SD 3.8 ± 5.7 3.1 ± 2.4 5.0 ± 5.4 4.6 ± 3.2
N 10 10 10 10
95% CI 0.0-7.9 1.3-4.8 1.1-8.9 2.3-7.0
11.6-11.11 M eans ± SD 5.4 ± 8.4 6.6 ± 5.7 8.3 ± 13.1 9.1 ± 7.9
N 10 10 10 10
95% CI 0.0-11.5 2.5-10.7 0.0-17.7 3.4-14.7
12.0-12.11 M eans ± SD 7.5 ± 6.7 2.7 ± 3.9 11.0 ± 9.2 3.6 ± 3.9
N 10 11 10 11
95% CI 2.7-12.3 0.1-5.3 4.4-17.6 0.9-6.2
13.0-13.11 M eans ± SD 2.2 ± 2.4 1.4 ± 1.1 3.2 ± 3.0 1.8 ± 1.3
N 11 10 11 10
95% CI 0.5-3.8 0.6-2.2 1.2-5.3 0.8-2.8
14.0-15.11 M eans ± SD 4.5 ± 8.4 0.9 ± 0.9 4.2 ± 5.0 1.3 ± 0.9
N 11 11 11 11
95% CI 0.0-10.1 0.3-1.6 0.8-7.7 0.7-2.0
Appendix 2. Performance in the Purdue Pegboard for boys and girls across age.
Age Preferred hand Non-preferred hand
M ale Female M ale Female
5.0-5.5 M eans ± SD 8.7 ± 1.0 9.4 ± 2.0 8.0 ± 1.5 8.5 ± 1.5
N 11 10 11 10
95% CI 8.0-9.4 7.9-10.8 6.9-9.0 7.4-9.5
5.6-5.11 M eans ± SD 7.5 ± 1.1 9.0 ± 1.5 7.2 ± 0.9 7.5 ± 1.5
N 9 10 9 10
95% CI 6.6-8.4 7.8-10.1 6.4-7.9 6.4-8.5
6.0-6.5 M eans ± SD 9.8 ± 1.4 10.3 ± 0.9 9.0 ± 1.6 8.6 ± 1.3
N 10 10 10 10
95% CI 8.7-10.8 9.6-10.9 7.7-10.2 7.6-9.5
6.6-6.11 M eans ± SD 10.8 ± 1.2 10.8 ± 1.5 9.0 ± 1.2 10.2 ± 0.9
N 10 10 10 10
95% CI 9.9-11.6 9.6-11.9 8.1-9.8 9.5-10.8
7.0-7.5 M eans ± SD 11.2 ± 1.4 11.7 ± 1.4 9.5 ± 1.3 10.6 ± 2.0
N 8 10 8 10
95% CI 10.0-12.4 10.6-12.7 8.4-10.5 9.1-12.0
7.6-7.11 M eans ± SD 12.1 ± 1.4 11.9 ± 1.6 10.5 ± 1.3 10.3 ± 1.7
N 12 10 12 10
95% CI 11.2-13.0 10.7-13.0 9.6-11.3 9.0-11.5
8.0-8.5 M eans ± SD 12.3 ± 1.2 13.5 ± 1.2 10.5 ± 1.1 11.5 ± 1.2
N 10 10 10 10
95% CI 11.4-13.1 12.5-14.4 9.6-11.3 10.5-12.4
8.6-8.11 M eans ± SD 12.2 ± 1.8 13.8 ± 1.2 11.3 ± 2.2 12.2 ± 1.4
N 10 11 10 11
95% CI 10.9-13.4 12.9-14.6 9.6-12.9 11.2-13.2
9.0-9.5 M eans ± SD 12.3 ± 1.4 13.4 ± 2.0 11.5 ± 1.5 11.8 ± 1.6
N 10 10 10 10
95% CI 11.2-13.3 11.9-14.8 10.3-12.6 10.6-12.9
9.6-9.11 M eans ± SD 13.0 ± 1.3 12.6 ± 1.3 11.5 ± 0.8 11.7 ± 1.3
N 11 8 11 8
95% CI 12.1-14.0 11.5-13.7 10.9-12.0 10.5-12.9
10.0-10.5 M eans ± SD 13.1 ± 1.9 14.3 ± 1.1 12.4 ± 1.7 12.8 ± 1.1
N 10 10 10 10
95% CI 11.7-14.4 13.4-15.1 11.1-13.6 11.9-13.6
10.5-10.11 M eans ± SD 14.0 ± 1.3 14.4 ± 1.1 11.9 ± 1.1 12.9 ± 1.5
N 10 10 10 10
95% CI 13.0-14.9 13.5-15.2 11.0-12.7 11.7-14.0
11.0-11.5 M eans ± SD 13.6 ± 1.1 13.7 ± 1.5 13.0 ± 1.1 13.6 ± 1.8
N 10 10 10 10
95% CI 12.7-14.4 12.5-14.8 12.1-13.8 12.2-14.9
11.6-11.11 M eans ± SD 14.5 ± 1.3 15.2 ± 1.7 12.7 ± 1.1 12.9 ± 0.7
N 10 10 10 10
95% CI 13.5-15.4 13.9-16.4 11.8-13.5 12.3-13.4
12.0-12.11 M eans ± SD 13.7 ± 1.4 15.1 ± 2.4 12.4 ± 2.3 14.6 ± 1.0
N 10 11 10 11
95% CI 12.6-14.7 13.5-16.8 10.7-14.0 13.9-15.3
13.0-13.11 M eans ± SD 15.7 ± 1.7 15.7 ± 1.1 13.9 ± 1.2 14.3 ± 1.5
N 11 10 11 10
95% CI 14.5-16.9 14.8-16.5 13.0-14.7 13.1-15.4
14.0-15.11 M eans ± SD 15.0 ± 1.7 16.3 ± 1.6 13.8 ± 1.1 14.6 ± 1.6
N 11 11 11 11
95% CI 13.9-16.2 15.2-17.4 13.0-14.6 13.5-15.7
Appendix 2. Continued.
Age Both hands Assembly
M ale Female M ale Female
5.0-5.5 M eans ± SD 6.0 ± 1.5 5.8 ± 1.8 12.0 ± 4.0 14.9 ± 3.1
N 11 10 11 10
95% CI 5.0-7.1 4.5-7.0 9.2-14.7 12.6-17.1
5.6-5.11 M eans ± SD 6.2 ± 1.3 6.4 ± 1.1 13.5 ± 3.6 14.4 ± 4.7
N 9 10 9 10
95% CI 5.2-7.2 5.5-7.2 10.7-16.3 11.0-17.7
6.0-6.5 M eans ± SD 7.3 ± 1.4 6.8 ± 1.2 17.9 ± 3.6 17.6 ± 4.1
N 10 10 10 10
95% CI 6.2-8.3 5.9-7.6 15.2-20.5 14.6-20.5
6.6-6.11 M eans ± SD 7.6 ± 1.2 8.0 ± 0.8 17.0 ± 4.6 23.0 ± 7.3
N 10 10 10 10
95% CI 6.6-8.5 7.4-8.5 13.6-20.3 17.7-28.2
7.0-7.5 M eans ± SD 8.2 ± 1.6 8.8 ± 1.7 21.8 ± 6.2 26.8 ± 5.6
N 8 10 8 10
95% CI 6.8-9.6 7.5-10.0 16.6-27.1 22.7-30.8
7.6-7.11 M eans ± SD 9.3 ± 1.6 8.6 ± 1.3 24.3 ± 5.0 24.4 ± 5.1
N 12 10 12 10
95% CI 8.3-10.3 7.6-9.5 21.1-27.5 20.7-28.0
8.0-8.5 M eans ± SD 8.2 ± 1.6 8.9 ± 1.1 22.5 ± 4.6 27.1 ± 3.0
N 10 10 10 10
95% CI 6.9-9.4 8.0-9.7 19.1-25.8 24.9-29.2
8.6-8.11 M eans ± SD 9.8 ± 0.9 10.3 ± 1.7 27.3 ± 3.4 31.7 ± 3.5
N 10 11 10 11
95% CI 9.1-10.4 9.1-11.5 24.7-29.8 29.3-34.1
9.0-9.5 M eans ± SD 9.7 ± 0.6 9.9 ± 1.6 24.6 ± 6.5 27.4 ± 5.1
N 10 10 10 10
95% CI 9.2-10.1 8.7-11.0 19.9-29.2 23.7-31.0
9.6-9.11 M eans ± SD 9.5 ± 1.2 10.5 ± 1.9 28.9 ± 3.8 30.5 ± 5.1
N 11 8 11 8
95% CI 8.6-10.4 8.8-12.1 26.3-31.4 26.1-34.8
10.0-10.5 M eans ± SD 10.6 ± 1.7 10.3 ± 1.6 32.5 ± 5.8 32.6 ± 5.2
N 10 10 10 10
95% CI 9.3-11.8 9.1-11.4 28.2-36.7 28.8-36.3
10.5-10.11 M eans ± SD 10.5 ± 1.4 10.7 ± 1.7 32.1 ± 4.4 32.2 ± 3.5
N 10 10 10 10
95% CI 9.4-11.5 9.4-11.9 28.9-35.2 29.6-34.7
11.0-11.5 M eans ± SD 10.2 ± 1.0 11.3 ± 1.4 31.1 ± 4.5 34.1 ± 4.7
N 10 10 10 10
95% CI 9.4-10.9 10.2-12.3 27.8-34.3 30.7-37.4
11.6-11.11 M eans ± SD 10.7 ± 1.9 11.3 ± 1.4 30.1 ± 4.9 34.6 ± 6.2
N 10 10 10 10
95% CI 9.3-12.0 10.2-12.3 26.5-33.6 30.1-39.0
12.0-12.11 M eans ± SD 10.9 ± 1.9 12.0 ± 1.5 30.3 ± 6.3 35.1 ± 7.4
N 10 11 10 11
95% CI 9.5-12.2 11.0-13.1 25.7-34.8 30.2-40.1
13.0-13.11 M eans ± SD 11.8 ± 1.6 12.1 ± 0.8 38.9 ± 4.3 38.7 ± 3.5
N 11 10 11 10
95% CI 10.7-12.8 11.4-12.7 36.0-41.8 36.1-41.2
14.0-15.11 M eans ± SD 12.3 ± 1.3 12.7 ± 1.7 40.6 ± 4.5 37.0 ± 5.4
N 11 11 11 11
95% CI 11.4-13.2 11.5-13.9 37.6-43.6 33.3-40.6
Appendix 2. Continued.
Age Time to place 10 pegs (s)
Preferred hand Non-preferred hand
M ale Female M ale Female
5.0-5.5 M eans ± SD 97.9 ± 19.5 89.3 ± 16.6 110.1 ± 25.2 101.0 ± 18.4
N 11 10 11 10
95% CI 84.8-111.0 77.4-101.2 93.1-127.0 87.8-114.1
5.6-5.11 M eans ± SD 106.0 ± 13.5 98.4 ± 15.3 112.4 ± 9.9 104.2 ± 15.9
N 9 10 9 10
95% CI 95.6-116.4 87.4-109.4 104.8-120.1 92.8-115.6
6.0-6.5 M eans ± SD 86.6 ± 8.5 82.4 ± 10.8 96.5 ± 17.9 96.5 ± 13.7
N 10 10 10 10
95% CI 80.5-92.8 74.6-90.1 83.7-109.4 86.6-106.3
6.6-6.11 M eans ± SD 75.6 ± 7.8 70.3 ± 6.6 89.6 ± 9.3 84.7 ± 13.4
N 10 10 10 10
95% CI 70.0-81.2 65.5-75.1 82.9-96.3 75.0-94.3
7.0-7.5 M eans ± SD 71.5 ± 7.3 67.9 ± 6.9 84.9 ± 7.6 79.0 ± 8.6
N 8 10 8 10
95% CI 65.3-77.6 62.9-72.9 78.5-91.3 72.8-85.2
7.6-7.11 M eans ± SD 66.7 ± 9.6 67.9 ± 11.4 76.4 ± 10.6 78.1 ± 11.6
N 12 10 12 10
95% CI 60.6-72.9 59.7-76.1 69.6-83.2 69.7-86.4
8.0-8.5 M eans ± SD 66.6 ± 8.2 60.5 ± 5.4 77.2 ± 12.2 71.3 ± 11.3
N 10 10 10 10
95% CI 60.7-72.5 56.6-64.4 68.4-86.0 63.2-79.4
8.6-8.11 M eans ± SD 62.6 ± 6.4 57.0 ± 4.9 69.3 ± 8.2 62.9 ± 7.1
N 10 11 10 11
95% CI 58.0-67.3 53.6-60.4 63.4-75.2 58.1-67.7
9.0-9.5 M eans ± SD 65.5 ± 5.9 61.4 ± 9.9 72.7 ± 6.6 72.1 ± 11.1
N 10 10 10 10
95% CI 61.2-69.7 54.3-68.5 67.9-77.4 64.1-80.1
9.6-9.11 M eans ± SD 61.5 ± 5.5 60.5 ± 10.7 71.2 ± 5.8 67.9 ± 9.4
N 11 8 11 8
95% CI 57.8-65.2 51.5-69.4 67.3-75.1 60.1-75.8
10.0-10.5 M eans ± SD 57.4 ± 6.4 56.6 ± 4.0 63.5 ± 6.5 63.4 ± 5.9
N 10 10 10 10
95% CI 52.8-62.0 53.7-59.4 58.8-68.2 59.2-67.7
10.5-10.11 M eans ± SD 57.3 ± 5.9 57.3 ± 6.1 67.4 ± 7.4 68.1 ± 9.2
N 10 10 10 10
95% CI 53.0-61.5 52.9-61.7 62.1-72.8 61.4-74.7
11.0-11.5 M eans ± SD 58.4 ± 5.2 53.2 ± 3.9 64.5 ± 5.7 61.8 ± 4.8
N 10 10 10 10
95% CI 54.6-62.1 50.4-56.0 60.3-68.6 58.4-65.3
11.6-11.11 M eans ± SD 56.1 ± 7.4 54.1 ± 4.8 65.8 ± 10.6 62.9 ± 7.1
N 10 10 10 10
95% CI 50.8-61.4 50.7-57.6 58.3-73.4 57.8-68.1
12.0-12.11 M eans ± SD 51.1 ± 7.2 50.4 ± 6.6 60.3 ± 9.4 56.3 ± 5.4
N 10 11 10 11
95% CI 45.9-56.3 46.0-54.9 53.6-67.0 52.6-59.9
13.0-13.11 M eans ± SD 47.6 ± 4.0 50.8 ± 4.3 57.3 ± 5.4 57.7 ± 3.8
N 11 10 11 10
95% CI 44.9-50.3 47.7-53.9 53.6-61.0 54.9-60.4
14.0-15.11 M eans ± SD 50.3 ± 4.9 47.3 ± 5.5 55.9 ± 4.1 53.4 ± 7.1
N 11 11 11 11
95% CI 47.0-53.6 43.6-51.1 53.1-58.6 48.6-58.3
Appendix 2. Continued.
Age Time to transfer 10 pegs (s)
Preferred hand Non-preferred hand
M ale Female M ale Female
5.0-5.5 M eans ± SD 59.2 ± 9.3 54.0 ± 9.9 68.5 ± 13.6 62.1 ± 12.5
N 11 10 11 10
95% CI 52.9-65.4 46.9-61.1 59.4-77.7 53.2-71.1
5.6-5.11 M eans ± SD 61.4 ± 7.2 58.0 ± 8.1 68.7 ± 9.1 65.1 ± 14.4
N 9 10 9 10
95% CI 55.8-67.0 52.2-63.8 61.6-75.8 54.7-75.5
6.0-6.5 M eans ± SD 50.0 ± 5.3 54.0 ± 7.5 57.6 ± 7.7 58.1 ± 6.9
N 10 10 10 10
95% CI 46.2-53.9 48.6-59.4 52.1-63.1 53.1-63.1
6.6-6.11 M eans ± SD 46.1 ± 4.9 43.1 ± 4.3 54.8 ± 6.1 50.0 ± 7.4
N 10 10 10 10
95% CI 42.5-49.7 39.9-46.2 50.4-59.3 44.7-55.3
7.0-7.5 M eans ± SD 43.6 ± 5.8 42.1 ± 4.7 48.5 ± 2.7 47.0 ± 4.0
N 8 10 8 10
95% CI 38.7-48.5 38.7-45.5 46.2-50.9 44.1-49.9
7.6-7.11 M eans ± SD 40.0 ± 5.0 41.6 ± 4.1 45.3 ± 5.1 47.7 ± 7.0
N 12 10 12 10
95% CI 36.8-43.2 38.6-44.6 42.0-48.6 42.6-52.8
8.0-8.5 M eans ± SD 39.2 ± 4.7 38.3 ± 5.3 43.1 ± 5.7 44.5 ± 7.3
N 10 10 10 10
95% CI 35.8-42.6 34.5-42.2 39.0-47.2 39.3-49.7
8.6-8.11 M eans ± SD 37.5 ± 3.3 34.0 ± 2.0 41.0 ± 5.6 40.7 ± 2.7
N 10 11 10 11
95% CI 35.1-39.9 32.7-35.4 37.0-45.1 38.8-42.5
9.0-9.5 M eans ± SD 42.1 ± 5.8 37.8 ± 5.3 45.0 ± 6.2 42.8 ± 4.6
N 10 10 10 10
95% CI 37.9-46.3 33.9-41.6 40.6-49.5 39.5-46.1
9.6-9.11 M eans ± SD 37.7 ± 2.4 37.6 ± 7.8 41.7 ± 3.8 42.9 ± 6.4
N 11 8 11 8
95% CI 36.1-39.3 31.0-44.1 39.1-44.3 37.5-48.2
10.0-10.5 M eans ± SD 34.9 ± 4.9 33.3 ± 1.9 39.2 ± 4.3 38.7 ± 3.6
N 10 10 10 10
95% CI 31.4-38.4 31.9-34.7 36.1-42.2 36.1-41.4
10.6-10.11 M eans ± SD 34.2 ± 4.1 34.7 ± 3.6 40.5 ± 3.6 39.3 ± 4.5
N 10 10 10 10
95% CI 31.2-37.2 32.0-37.3 37.8-43.1 36.0-42.5
11.0-11.5 M eans ± SD 33.7 ± 4.0 31.1 ± 1.9 36.3 ± 5.1 35.7 ± 3.1
N 10 10 10 10
95% CI 30.7-36.6 29.7-32.5 32.7-40.0 33.5-37.9
11.6-11.11 M eans ± SD 32.1 ± 4.7 33.1 ± 5.8 35.7 ± 3.8 38.5 ± 5.8
N 10 10 10 10
95% CI 28.7-35.5 28.9-37.3 32.9-38.5 34.4-42.7
12.0-12.11 M eans ± SD 33.1 ± 4.4 30.6 ± 3.5 37.1 ± 4.9 33.1 ± 2.7
N 10 11 10 11
95% CI 30.0-36.3 28.2-32.9 33.6-40.6 31.2-35.0
13.0-13.11 M eans ± SD 28.9 ± 1.3 31.2 ± 2.9 32.2 ± 2.5 33.4 ± 3.3
N 11 10 11 10
95% CI 28.0-29.8 29.0-33.3 30.5-33.9 31.0-35.8
14.0-15.11 M eans ± SD 30.1 ± 5.2 27.8 ± 2.6 32.3 ± 4.0 34.2 ± 4.5
N 11 11 11 11
95% CI 26.5-33.6 26.0-29.7 29.6-35.0 31.1-37.2
Appendix 3. Betw een-hand performance differences in the Gardner Steadiness Test and the Purdue Pegboard across age.
Age N Gardner Steadiness Test Purdue Pegboard
Number of Touch time Number of Time to Time to transfer
contacts (s) pegs placed place 10 pegs (s) 10 pegs (s)
5.0-5.5 21 12.3 ± 20.5 10.6 ± 16.9 0.8 ± 1.2 11.9 ± 14.3 8.7 ± 9.3
2.9-21.7 2.9-18.3 0.2-1.3 5.3-18.4 4.5-13.0
5.6-5.11 19 25.2 ± 26.9 10.1 ± 16.6 0.9 ± 1.2 6.0 ± 13.3 7.2 ± 8.2
12.2-38.2 2.0-18.1 0.3-1.5 0.0-12.5 3.2-11.1
6.0-6.5 20 6.1 ± 26.5 6.4 ± 14.8 1.2 ± 1.4 11.9 ± 11.5 5.8 ± 4.0
0.0-18.5 0.0-13.3 0.5-1.9 6.6-17.3 3.9-7.7
6.6-6.11 20 19.4 ± 20.3 7.3 ± 7.0 1.2 ± 1.1 14.1 ± 7.9 7.8 ± 4.2
9.9-28.9 4.0-10.5 0.6-1.7 10.4-17.8 5.8-9.8
7.0-7.5 18 11.7 ± 16.0 3.0 ± 8.1 1.3 ± 2.5 12.1 ± 7.4 4.9 ± 4.0
3.7-19.7 0.0-7.1 0.1-2.6 8.4-15.8 2.9-6.9
7.6-7.11 22 12.9 ± 24.3 5.9 ± 9.1 1.6 ± 1.5 9.9 ± 7.0 5.6 ± 4.8
2.1-23.7 1.8-9.9 0.9-2.3 6.7-13.0 3.5-7.7
8.0-8.5 20 19.8 ± 20.3 9.1 ± 8.7 1.9 ± 1.5 10.6 ± 8.4 5.0 ± 5.6
10.3-29.3 5.1-13.2 1.1-2.6 6.7-14.6 2.4-7.6
8.6-8.11 21 11.9 ± 19.0 5.0 ± 8.8 1.2 ± 1.4 6.2 ± 6.6 5.1 ± 4.1
3.2-20.5 1.0-9.1 0.5-1.8 3.2-9.2 3.2-7.0
9.0-9.5 20 17.9 ± 16.7 4.8 ± 5.8 1.2 ± 1.3 8.9 ± 5.9 3.9 ± 4.3
10.0-25.7 2.1-7.6 0.5-1.8 6.1-11.7 1.9-6.0
9.6-9.11 19 21.6 ± 24.4 6.5 ± 8.0 1.2 ± 1.4 8.7 ± 6.8 4.5 ± 3.8
9.8-33.4 2.6-10.4 0.5-1.9 5.4-12.0 2.6-6.3
10.0-10.5 20 8.8 ± 12.1 2.0 ± 2.7 1.1 ± 1.2 6.4 ± 4.7 4.8 ± 2.9
3.1-14.5 0.7-3.3 0.5-1.6 4.2-8.7 3.5-6.2
10.6-10.11 20 14.2 ± 14.4 4.0 ± 4.3 1.8 ± 1.5 10.4 ± 6.7 5.4 ± 3.7
7.4-21.0 2.0-6.1 1.0-2.5 7.3-13.6 3.6-7.2
11.0-11.5 20 6.2 ± 12.8 1.3 ± 3.1 0.3 ± 1.5 7.3 ± 5.0 3.6 ± 2.9
0.2-12.2 0.0-2.8 0.0-1.0 4.9-9.7 2.2-5.0
11.6-11.11 20 8.9 ± 11.4 2.6 ± 4.1 2.0 ± 1.2 9.2 ± 7.0 4.5 ± 2.8
3.5-14.3 0.6-4.5 1.4-2.6 5.9-12.5 3.1-5.8
12.0-12.11 21 6.4 ± 8.7 2.1 ± 2.9 0.9 ± 1.6 7.4 ± 5.3 3.2 ± 2.7
2.4-10.4 0.7-3.4 0.1-1.6 5.0-9.8 1.9-4.4
13.0-13.11 21 3.8 ± 7.0 0.7 ± 1.4 1.6 ± 1.4 8.3 ± 3.5 2.8 ± 2.4
0.6-7.0 0.0-1.4 0.9-2.2 6.7-9.9 1.6-3.9
14.0-15.11 22 4.9 ± 9.4 0.0 ± 5.2 1.5 ± 1.5 5.8 ± 4.4 4.2 ± 4.3
0.6-9.1 0.0-2.4 0.8-2.1 3.8-7.7 2.3-6.2