IN PARAOPEBA RIVER BASIN, MG
Matheus Fonseca Durães2, Carlos Rogério de Mello3, Mauro Naghettini4 (received: November 24, 2010; accepted: June 30, 2011)
ABSTRACT: The SWAT model (Soil and Water Assessment Tool) was applied for simulating the hydrologic pattern of Paraopeba river basin, in Minas Gerais state, under different land use and occupation scenarios, looking to support basin management actions. The model parameters were calibrated and validated, with respect to the data observed from 1983 to 2005. The basin was assessed at the ‘Porto do Mesquita’ gauging station and change in land use and occupation was based on the annual growth scenarios proposed in the partial report of Paraopeba basin’s master plan. The model was found to be highly sensitive to basefl ow, its main calibration variable. Statistical analyses produced a Nash-Sutcliffe coeffi cient above 0.75, which is considered good and acceptable. The SWAT model provided satisfactory results in simulating hydrologic pattern under different scenarios of land use change, demonstrating that it can be applied for forecasting discharge in the aforesaid basin. The current land use scenario provided a peak discharge simulation of 1250 m³ s-1, while in years 2019 and 2029 peak discharge simulations were 1190 m³ s-1 and 1230 m³ s-1 respectively. The 2019 scenario provided the best results with respect to basefl ow increase and peak discharge reduction.
Key words: Hydrology modeling, land cover, basin management.
APLICABILIDADE DO MODELO SWAT PARA SIMULAÇÃO HIDROLÓGICA NA BACIA HIDROGRÁFICA DO RIO PARAOPEBA, MG
RESUMO: O modelo SWAT (Soil and Water Assessment Tool) foi aplicado para simular o comportamento hidrológico da bacia do rio Paraopeba, estado de Minas Gerais, sob diferentes usos e ocupação do solo, visando a subsidiar ações de manejo na bacia hidrográfi ca, tendo-se o período de 1983 a 1989 como referência para calibração do modelo e o período entre 2000 e 2005 para a validação. A bacia foi analisada na seção de controle “Porto do Mesquita” e a mudança no uso e ocupação do solo foi conduzida mediante os cenários de crescimento anual, propostos no Relatório Parcial do Plano Diretor da Bacia do rio Paraopeba. O modelo apresentou elevada sensibilidade ao escoamento de base, sendo esta sua principal variável de calibração. As análises estatísticas mostraram um coefi ciente de Nash-Sutcliffe superior a 0,75, o qual é considerado como bom e aceitável. O modelo SWAT apresentou resultados satisfatórios na simulação do comportamento hidrológico sob diferentes cenários de mudanças no uso do solo, mostrando que pode ser aplicado para a previsão de vazões na referida bacia. O cenário atual de uso do solo apresentou uma vazão de pico simulada de 1250 m³ s-1, enquanto que nos anos de 2019 e 2029, as vazões máximas simuladas foram de 1190 m³ s-1 e 1230 m³ s-1, respectivamente. O cenário relativo ao ano 2019 produziu os melhores resultados no tocante ao aumento do escoamento de base e redução das vazões de pico.
Palavras-chave: Modelagem hidrológica, cobertura vegetal, manejo de bacias hidrográfi cas.
1Excerpt from the fi rst author’s MSc dissertation, submitted to the Universidade Federal de Minas Gerais
2Agronomist, PhD Candidate in Water Resources in Agricultural Systems – Laboratório de Hidráulica – Departamento de Engenharia – Universidade
Federal de Lavras – Cx. P. 3037 – 37200-000 – Lavras, MG, Brazil – [email protected]
3Agricultural Engineer, Professor PhD in Soil Science – Laboratório de Hidráulica – Departamento de Engenharia – Universidade Federal de
Lavras – Cx. P. 3037 – 37200-000 – Lavras, MG, Brazil – [email protected] a.br
4Civil Engineer, Professor Ph.D. in Civil Environmental and Water Resources Eng. – Escola de Engenharia – Universidade Federal de Minas Gerais –
Av. Antônio Carlos 6627 – 31270-901 – Belo Horizonte, MG, Brazil – [email protected] 1 INTRODUCTION
Simulating the hydrologic pattern of river basins is one of the most important tools for sound management of natural resources, as it potentially allows forecasting the impacts of land use changes on the hydrology of a basin. Land use is a critical issue that affects primarily soil water infi ltration and evapotranspiration, and some physically based hydrologic models in one way or another use data or parameters based on land use and occupation (SUI, 2005).
Li et al. (2009) evaluated the impacts of change in land cover and climate variability on the basin of Heihe river in China, and demonstrated that the SWAT model proved to be an effective tool in helping evaluate the effects of impacts resulting from environmental change.
Stackelberg et al. (2007) used the SWAT model for simulating the hydrologic impacts of a pine crop
(Pinus taeda) which was introduced as replacement for
pastureland in Tacuarembó river watershed, Uruguay, a drainage area of 107.7 ha, and estimated a streamfl ow reduction of around 23%, fi nding that the model gave a satisfactory performance under those conditions, given the Nash-Sutcliffe coeffi cient of 0.70.
Machado et al. (2003) used the SWAT model under Brazilian conditions for simulating alternative land use scenarios in the Marins river watershed, in Piracicaba (SP), obtaining a 10.8% reduction in sediment yield in scenario 1 where permanent preservation areas along riverbanks and ponds had been respected, against a 94% reduction in sediment yield in scenario 2 where pastureland had been replaced with native vegetation, which shows the need for handling a watershed’s landscape from a global standpoint, identifying sensitive areas requiring control practices to monitor erosion processes.
This work aims to evaluate applicability of the SWAT model for predicting the hydrologic pattern of Paraopeba river basin under different land use scenarios, comparatively assessing discharge patterns for each period being studied and contributing information to help ensure suitable land use and management in the near future.
2 MATERIAL AND METHODS 2.1 SWAT model
SWAT is a physical-mathematical model with distributed parameters that allow simulating a number of different physical processes for the ultimate purpose of evaluating impacts of land use change on surface and groundwater runoff, on sediment yield and on water quality (SRINIVASAN; ARNOLD, 1994), operating on a daily basis while being capable of computing the effects of management variations over long periods.
The model is based on a command structure that distributes runoff, sediment and agrochemicals across the basin. The hydrologic component includes subroutines of surface runoff, percolation, subsurface lateral fl ow, shallow aquifer return fl ow and evapotranspiration, yet for that the model requires daily data set about precipitation,
air temperature, solar radiation, wind speed and relative humidity (ARNOLD et al., 1998).
The SWAT hydrology model uses a modified formulation of the CN-SCS method (UNITED STATE DEPARTMENT OF AGRICULTURE - USDA, 1972) to calculate surface runoff. The CN method relates surface runoff with soil type, land use and management practices, enabling to characterize the Curve-Number parameter for each situation (ARNOLD et al., 1998). Data entry is done using a suitable computer program interface and requires the following map-formatted information: digital terrain elevation model (MDE), soil types and land use. The model interface then subdivides the basin into subbasins based on direction of drainage network fl ow, which are derived from the terrain elevation model, and then it extracts input data from each subbasin database. As a result, it helps generate Hydrologic Response Units (HRU) within each subbasin. Each unit is composed of areas with the same soil type and land use which are homogeneous in terms of hydrologic response, and also based on topographic criteria.
These input data are incorporated into the model using tables that contain information about the hydrologic characteristics of relevant soils (Hydrologic Groups of the CN-SCS method), which enable estimating a CN value for each Hydrologic Unit, data about solar radiation, wind speed, relative humidity, maximum and minimum temperature, location of existing rainfall and streamfl ow gauging stations. Based on these meteorological data, the Penman-Monteith model is then applied to estimate evapotranspiration and to establish the water balance of each HRU.
2.2 Study site
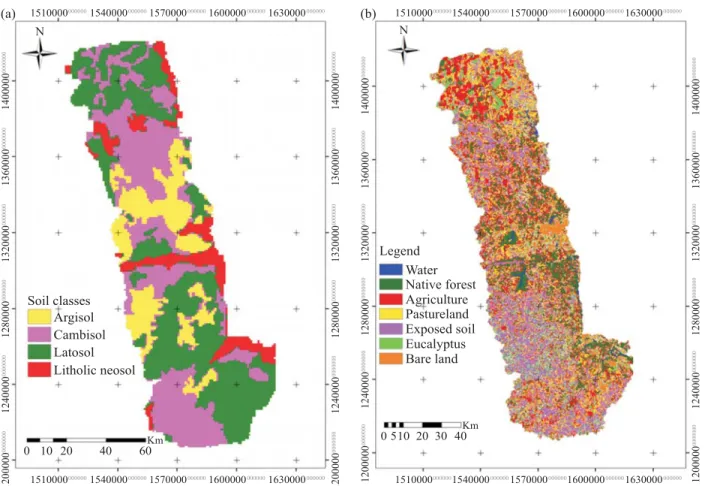
Paraopeba river basin is located in Minas Gerais state, between geographic coordinates 20°51’ – 18°35’ south latitude and 45°11’ – 43°38’ west longitude, at an altitude ranging between 650 and 1544 m. Predominating soil types are: Latosol in 39.68% of the basin area, Cambisol in 34.97%, Argisol in 16.97%, and Litholic Neosol in 8.39% of the basin area. Figure 1a provides a soil map of Paraopeba river basin (DURÃES, 2010).
rates adopted to calculate the evolution of demand by different user sectors, as defi ned in the partial report of Paraopeba basin’s master plan. Rates used in the partial report were estimated in a simplifi ed way, ignoring both the peculiarities of each subbasin and any biased scenarios (CONSÓRCIO INTERMUNICIPAL DA BACIA HIDROGRÁFICA DO RIO PARAOPEBA - CIBAPAR, 2010).
The Paraopeba river basin has been explored in a recent study led by the mineral resource research company Companhia de Pesquisa de Recursos Minerais - CPRM (2001), which states that the subbasin of lower Paraopeba river drains terrains underlined by bedrock of the Paraopeba and Três Marias formations, Três Marias group (Early Proterozoic), while to the east and southeast the subbasin of mid and higher Paraopeba river drains the karstic region of Sete Lagoas formation, Bambuí group, and the granitic-gneissic rocks of Belo Horizonte and
Bonfi m complexes (Archean) as well as the units of Minas and Rio das Velhas supergroups (Early Proterozoic and Archean respectively).
The relief of the basin is characterized by plateaus, depressions and dissected areas predominantly resulting from alternate morphoclimatic processes in combination with geological conditioning. Local climate types include Cwa, Cwb and Aw, according to Köppen classifi cation (CIBAPAR, 2010), and the drainage area covers 10,200 km² until Porto do Mesquita streamfl ow gauging station, draining directly into Três Marias hydroelectric reservoir.
This study considered escalation in land use on areas falling into the ‘bare land’ category. Scenarios were developed taking into account the entire basin, as illustrated in Table 1, showing how different occupation patterns can infl uence basefl ow regime, and peak discharge reduction, within a broader water resource management context.
Figure 1 – Map of soil types (a) and land use (b) in Paraopeba river basin.
2.3 Statistical analyses
Statistics included the Nash-Sutcliffe coeffi cient (COE) and the deviation of simulated data in relation to observations (Dv), which were used for comparing simulated and observed discharges at Porto do Mesquita streamfl ow gauging station for the calibration phase (1983 to 1989 period) and for the validation phase (2000 to 2005 period).
where Qobsis observed discharge; Qsim is simulated discharge; Qis the average observed event for the simulation period
and n is the number of events. According to Zhang et al. (2007), the COE value indicates the fi t of simulated
data to observed data in the 1:1 line. Gotschalk and Motoviloc (2000) provided the following classifi cation for this coeffi cient: COE = 1 corresponds to a perfect fi t; COE > 0.75 signals that the model is good and suitable; 0.36 < COE < 0.75 signals that the model is acceptable.
3 RESULTS AND DISCUSSION
3.1 Calibration and validation of the SWAT model for Paraopeba river basin
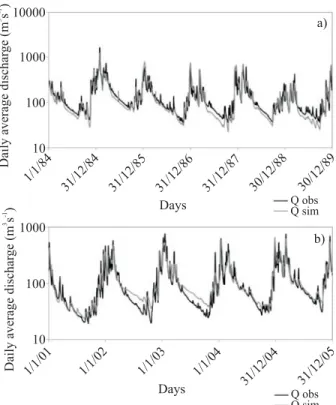
The result of SWAT model calibration to Paraopeba river basin, considering the Porto do Mesquita streamfl ow gauging station, is illustrated in Figure 2a. The modeled hydrograph showed goodness of fi t to observations, which means there was good estimation of discharge in that
phase, observing model sensitivity to peak discharges. In other words, the model was succeeded in capturing oscillations brought about by intensifi ed rainfall events. Yet, an underestimation bias was noted during recession periods, particularly in the hydrologic year of 1986-1987, in other words, the model tends to underestimate basefl ow. While studying SWAT model performance under different climate conditions and drainage areas, Douglas-Mankin et al. (2010) found that the model showed a similar basefl ow underestimation bias under wet climate conditions in some North American basins, yet pointing to better model performance under these climate conditions. The Nash-Sutcliffe coeffi cient (COE) was 0.79 which indicates that the model is good and suitable. Kim et al. (2010) fi tted the SWAT model for a basin similar in size to Paraopeba basin and obtained a COE value of 0.66. These authors concluded that, despite the not fully satisfactory COE, the model can be applied to hydrologic simulation of both streamfl ow and water quality. Complementarily, the Dv Figure 2 – Observed and calibrated hydrographs for Paraopeba river at Porto do Mesquita station and (a) observed and validated hydrographs for the same station (b).
Figura 2 – Hidrogramas observados e calibrados no rio Paraopeba, na estação de Porto do Mesquita (a) e hidrogramas observados e validados para a mesma estação (b).
(
)
(
)
2
1
2
1
1
n
OBS SIM
i n
OBS i
Q Q
COE
Q Q
=
=
− = −
−
∑
∑
100
OBS SIM
OBS
Q Q
Dv
Q
⎛ − ⎞ =⎜ ⎟×
⎝ ⎠
Table 1 – Prospected scenarios of land use, as basin area percentage (%).
Tabela 1 – Cenários de uso do solo projetados, em porcentagem de área da bacia (%).
Use Current 2019 2029
Urban 4.14 6.58 8.80
Pastureland 31.17 34.68 38.57
Agriculture 19.71 23.26 27.20
Native Forest 3.88 3.88 3.88
Eucalyptus 9.03 9.03 9.03
between observed and simulated values was 5.02 which indicates that the simulated discharge did not statistically exceed the observed discharge in the period being analyzed (BESKOW, 2009).
The hydrograph corresponding to the validation phase is illustrated in Figure 2b. The validation phase of a hydrologic simulation process is critical, allowing defi nitive characterization of model applicability. This is due to the fact that in this phase the model is applied to a novel database, considering the parameters obtained during the calibration phase. Here, as is illustrated in Figure 2b, modeled values showed goodness of fi t to observed values, repeating the calibration phase pattern. The COE value here was also 0.79, reinforcing the description in the calibration phase.
Notter et al. (2007), while developing and applying a semi-distributed model based on the CN-SCS method to the Mount Kenya region in Africa, obtained COE values of 0.693 and 0.513 for calibration and validation respectively, thus falling into the ‘acceptable’ category. The model was then applied for simulating the impacts of different land use and global warming patterns on said region.
Beskow et al. (2011), while working with a model distributed across an experimental basin 32 km² in size in south Minas Gerais, obtained COE values on the order of 0.82 and 0.764 for calibration and validation respectively. Mello et al. (2008), applying the same hydrology model distributed across subbasins in Alto Rio Grande basin, found COE values above 0.7 in the calibration and validation phases, demonstrating that the model satisfactorily simulated hydrologic impacts resulting from land use change in that basin.
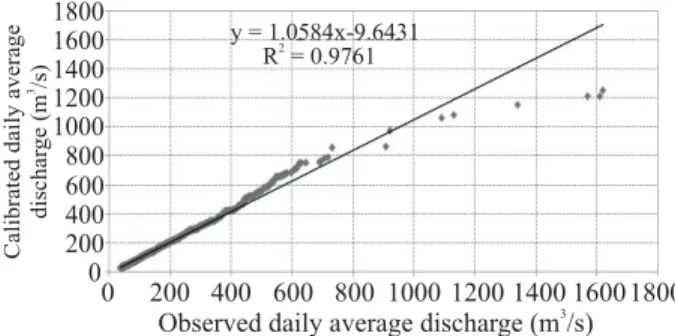
The dispersion diagram between simulated and observed discharges is provided in Figure 3.
Although Figures 2b and 3 reveal that the model satisfactorily represented the simulated discharge, an underestimation is noted in the recession period of the hydrograph, possibly relating to insuffi cient climatologic stations to compose the climate generator of the model, since the river basin in question is large and boasts assorted climate types as well as aquifer systems and therefore shows high spatial variability of climate components necessary to operate the model. Sexton et al. (2010) reported similar concerns, arguing that spatial variability of climate variables, particularly precipitation, is a critical issue to be considered when applying hydrology models, including the SWAT model.
A bias is noted in Figure 3 caused by model parameters, since with greater discharges the variability increases about the 1:1 line, with points concentrating below the line, denoting a tendency to underestimate discharges higher than 1000 m³s-1. Yet, the frequency of occurrence of such discharges in Paraopeba basin is relatively low, as is illustrated in Figure 3.
Despite the bias found in discharge estimations, considering precision statistics and relevant acceptance in literature, particularly the results found by various authors working with the SWAT model, it can be said that this model is capable of simulating suitably enough the hydrologic impacts resulting from land use change in Paraopeba river basin.
3.2 Model application for simulation of structured scenarios
After the calibration and validation processes, the SWAT model was applied based on the land use scenarios proposed by Paraopeba basin’s master plan. It should be noted that under the simulation conditions used here, the same historical series of climate and discharge as used in the calibration phase was used, in other words, no scenarios of climate change were structured. Results should be interpreted bearing in mind the calibration phase of the model, as it revealed good precision during its validation (2001-2005). The simulated hydrograph for land use change was confronted with the calibrated hydrograph due to some uncertainties associated with the calibration phase and parameter characterization of the SWAT model for the Paraopeba basin. The simulated hydrographs for the 2019 and 2029 scenarios are illustrated in Figures 4a and 4b, respectively.
The graphic analysis of simulated hydrographs reveal that, with the occupation of areas where the current Figure 3 – Calibrated discharge versus observed discharge in
Paraopeba river at Porto do Mesquita gauging station.
scenario was bare land, an increase will follow in water supply, particularly in the recession period relating to the 2019 scenario. In such scenario, the mean CN-SCS value was 46.76, against 54 for the land use conditions of the current scenario, demonstrating that said scenario allows good conditions for increasing water infi ltration in the soil, with reduction in surface runoff. The 2019 scenario provided an average annual surface runoff value on the order of 181.01 mm, while in the current land use scenario the corresponding value was 207.26 mm. Under such scenario (Table 1) an increase of more than 2% in urbanized area is observed, which entails increased fl ood discharge and reduced recharge. However, the expansion of pastureland on bare land areas was higher than 4%, which impacts improved physical conditions to the soil in terms of its infi ltration capability, providing favorable conditions for groundwater recharge.
For the 2029 scenario, despite the continuous expansion of urbanized area as well as of pastureland areas, an important and expressive expansion is noted in the area devoted to traditional agriculture which helps reduce
conditions for water infi ltration in the soil. Within such context, a slight reduction is noted in water availability in the recession period, leading to a reduction in the annual surface runoff value, around 200.65 mm. It should be also noted that maintenance of native forest areas in relation to the current scenario, which means to say that land exploration would only occur in areas of bare land, is a desirable situation from a basin management standpoint.
With the analysis of impact simulations produced by the various scenarios, Table 2 provides maximum and minimum annual discharge values, showing the important role of reducing surface runoff by techniques that focus on environmental preservation, particularly those related to recovery of degraded areas with bare land.
Table 2 – Maximum and minimum annual discharges simulated for different scenarios.
Tabela 2 – Vazões máximas e mínimas anuais simuladas para os cenários projetados.
Hydrologic indicator Year
2010 2019 2029
Maximum annual discharges (m³s-1)
1250 1190 1230
1210 1160 1190
1150 1150 1130
1080 1100 1070
1060 1030 1060
Minimum annual discharges with 90% duration (Q90%) m³s-1
39.6 42.2 36.6
Figure 4 – Simulated hydrograph for the scenario of year 2019 (a) and simulated hydrograph for the scenario of year 2029 (b).
Figura 4 – Hidrograma simulado para o cenário relativo ao ano de 2019 (a) e hidrograma simulado para o cenário relativo ao ano de 2029 (b).
It is noted that occupation of areas referred to as ‘bare land’ favored reduction in peak discharge in the simulated scenarios, which means that proposing policies and techniques capable of minimizing the occurrence of such situation will favor water infi ltration, reduce surface runoff and reduce peak discharge in the basin, while minimizing its vulnerability to periodical fl ooding.
4 CONCLUSIONS
The SWAT model enabled the hydrologic simulation of Paraopeba river basin, proving a useful tool for water resource planning and management.
Land use change in the proposed scenarios led to reduction in peak discharges and increase in minimum discharges, both situations resulting from occupation of bare land areas, denoting a better condition for water infi ltration, in particular concerning the land use characteristics predicted by the 2019 scenario.
5 REFERENCES
ARNOLD, J. G.; SRINIVASAN, R.; MUTTIAH, R. S.; WILLIAMS, J. R. Large area hydrologic modeling and assessment part I: model development. Journal of American Water Resources Association, Washington, v. 34, p. 73-89, 1998.
BESKOW, S. LASH model: a hydrological simulation tool in GIS framework. 2009. 118 p. Tese (Doutorado em Engenharia Agrícola) - Universidade Federal de Lavras, Lavras, 2009.
BESKOW, S.; MELLO, C. R.; NORTON, L. D.; SILVA, A. M. Performance of a distributed semi-conceptual hydrological model under tropical watershed conditions. Catena,
Amsterdam, v. 86, p. 160-171, 2011.
COMPANHIA DE PESQUISA DE RECURSOS
MINERAIS. Superintendência regional de Belo Horizonte: regionalização de vazões sub-bacias 40 e 41, convênio 015/2000 ANEEL – 013/CPRM/2000, relatório fi nal. Belo Horizonte, 2001.
CONSÓRCIO INTERMUNICIPAL DA BACIA HIDROGRÁFICA DO RIO PARAOPEBA. Estudos preliminares para implementação do Plano Diretor das águas da bacia do rio Paraopeba. Betim, 2010. 346 p.
DOUGLAS-MANKIN, K. R.; SRINIVASAN, R.; ARNOLD, J. G. Soil and water assessment tool (SWAT) model: current developments and applications. Transactionsof the ASABE, Saint Joseph,v. 53, p. 1423-1431, 2010.
DURÃES, M. F. Caracterização e avaliação do estresse hidrológico da bacia do rio Paraopeba, por meio de
simulação chuva-vazão de cenários atuais e prospectivos de ocupação e uso do solo utilizando um modelo
hidrológico distribuído. 2010. 147 p. Dissertação (Mestrado em Saneamento, Meio Ambiente e Recursos Hídricos) – Universidade Federal de Minas Gerais, Belo Horizonte, 2010.
KIM, N. W.; SHIN, A. H.; LEE, J. Effects of streamfl ow routing schemes on water quality with SWAT. Transactions of the ASABE, Saint Joseph,v. 53, p. 1457-1468, 2010.
LI, Z.; LIU, W.; ZHANG, X.; ZHENG, F. Impacts of land use change and climate variability on hydrology in an agricultural catchment on the Loess Plateau of China. Journal of Hydrology, Amsterdam, v. 377, p. 35-42, 2009.
MACHADO, R. E.; VETTORAZZI, C. A.; XAVIER, A. C. Simulação de cenários alternativos de uso da terra em uma microbacia utilizando técnicas de modelagem e geoprocessamento. Revista Brasileira de Ciência do Solo, Campinas, v. 27, p. 727-733, 2003.
MELLO, C. R.; VIOLA, M. R.; NORTON, L. D.; SILVA, A. M.; WEIMAR, F. A. Development and application of a simple hydrologic model simulation for a Brazilian headwater basin. Catena, Amsterdam, v. 75, p. 235-247, 2008.
NOTTER, B.; MACMILLAN, L.; VIRIROLI, D.; WEINGARTNER, R.; LINIGER, H. P. Impacts of environmental change on water resources in the Mt. Kenya Region. Journal of Hydrology, Amsterdam, v. 343, p. 266-278, 2007.
PETERSON, J. R.; HAMLETT, J. M. Hydrological calibration of the SWAT model in a watershed containing fragipan soils. Journal of the American Water Resources Association, Washington, v. 34, p. 531-544, 1998.
SEXTON, A. M.; SADEGHI, A. M.; ZHANG, X.;
SRINIVASAN, R.; SHIRMOHAMMADI, A. Using NEXRAD and rain gauge precipitation data for hydrologic calibration of SWAT in a Northeastern watershed. Transactions of the ASABE, Saint Joseph,v. 53, p. 1501-1510, 2010.
STACKELBERG, N. O.; CHESCHEIR, G. M.; SKAGGS, R. W.; AMATYA, D. M. Simulation of the hydrologic effects of afforestation in the Tacuarembó river basin, Uruguay. Transactions of the ASABE, Saint Joseph, v. 50, p. 455-468, 2007.
SUI, J. Estimation of design fl ood hydrograph for an ungauged watershed. Water Resources Management, Oxford, v. 19, p. 813-830, 2005.
UNITED STATE DEPARTMENT OF AGRICULTURE. Soil conservation service: hydrology. Washington, 1972. Section 4.