COMMON BEAN CULTIVARS AND LINES
INTERACTIONS WITH ENVIRONMENTS
Sérgio Augusto Morais Carbonell1*; Joaquim Adelino de Azevedo Filho2; Luiz Antônio dos Santos Dias3; Antonio Augusto Franco Garcia4; Lizz Kezzy de Morais5
1
IAC/APTA - Centro de Análise e Pesquisa Tecnológica do Agronegócio dos Grãos e Fibras, C.P. 28 - 13001-970 - Campinas, SP - Brasil.
2
DDD/APTA - Pólo Regional do Leste Paulista, C.P. 11 - 13910-000 - Monte Alegre do Sul, SP - Brasil. 3
UFV/BIOAGRO - 36571-000 - Viçosa, MG - Brasil. 4
USP/ESALQ - Depto. de Genética, C.P. 83 - 13400-970 - Piracicaba, SP - Brasil. 5
UFG/Escola de Agronomia - Setor de Melhoramento Vegetal, C.P. 131 - 74001-970 - Goiânia, GO - Brasil. *Corresponding author <[email protected]>
ABSTRACT: The performance of bean lines brought forth in breeding programs or of cultivars in use can be affected by environmental variability. The adaptability and stability of grain yield of 18 common bean cultivars and lines in 23 environments (combinations of seasons, years and locations) were evaluated in the State of São Paulo, Brazil. ‘IAC-Carioca’ and ‘IAC-Carioca Eté’ were used as standard cultivars for the carioca grain type, while ‘FT-Nobre’ and ‘IAC-Una’ represented the standard for black grains. The experiment was set up in a randomized complete block design with four replications and plots consisting of two, two central five meters rows flanked by border rows. Stability parameters were estimated by the methods Maximum Yield Deviations (MYD) and by the Additive Main Effects and Multiplicative Interaction Analysis (AMMI). For the identification of the most stable cultivars, the two methods led to consistent results, although by MYD the highest stability was always associated to the highest yield. ‘MAC-733327’ and ‘LP 9637’ were the most suitable cultivars and lines for the joint seasons, while ‘LP 9637’ and ‘FT-Nobre’ were the most suitable for the dry season. The MYD method combined a simple procedure, easiness of result interpretation, uniqueness of parameters, and association between stability and yield. On the other hand, the AMMI method simplified the identification of stable cultivars by visual inspection, also providing information on the environments. However, the complex nature which combines uni- and multivariate techniques hampers its widespread use in breeding programs.
Key words: Phaseolus vulgaris, AMMI, adaptability, stability, cultivar
INTERAÇÕES DE CULTIVARES E LINHAGENS DE FEIJOEIRO
COM AMBIENTES
RESUMO: A variabilidade de ambientes pode afetar o desempenho de linhagens de feijoeiro geradas nos programas de melhoramento e também dos cultivares em uso. Assim, foram avaliadas a adaptabilidade e a estabilidade de produção de grãos de 18 cultivares e linhagens de feijoeiro em 23 ambientes (combinações de épocas, anos e locais), no Estado de São Paulo. ‘IAC-Carioca’ e ‘IAC-Carioca Eté’ foram os cultivares usados como padrões de grãos tipo carioca, enquanto ‘FT-Nobre’ e ‘IAC-Una’ foram padrões para grãos pretos. Os ensaios foram instalados em blocos completos casualizados, com quatro repetições e parcela útil de duas linhas centrais de cinco metros. Os parâmetros de estabilidade foram estimados pelos métodos dos Desvios da Produtividade Máxima (MYD) e da Análise da Interação Multiplicativa e dos Efeitos Principais Aditivos (AMMI). Ambos produziram resultados congruentes em termos de identificação dos cultivares mais estáveis, porém a maior estabilidade esteve sempre associada à maior produtividade no MYD. ‘MA-733327’ e ‘LP 9637’ foram os cultivares mais indicados para o conjunto das épocas, águas e inverno, enquanto LP 9637 e FT-Nobre foram os mais estáveis na seca. MYD reuniu simplicidade de procedimento, facilidade de interpretação de resultados, unicidade de parâmetros e associação entre estabilidade e produtividade. Por sua vez, AMMI, além de informar sobre os ambientes, facilitou a identificação dos cultivares estáveis por inspeção visual. Porém sua fundamentação complexa, visto que combina técnicas uni e multivariadas, dificulta seu uso generalizado em programas de melhoramento.
Palavras-chave: Phaseolus vulgaris, AMMI, adaptabilidade, estabilidade, cultivares
INTRODUCTION
Brazil is an outstanding producer and consumer of common bean (Phaseolus vulgaris L.). Combined with
three seasons: rainy, dry and winter, with sowings be-tween August and October, January and March, and April and May, respectively, according to the ecological zon-ing of the crop (Pinzan et al., 1994).
The common bean is cultivated in a great vari-ability of environments. Knowledge on the performance of new lines brought forth by breeding programs and the cultivars in use is determinant for the success of the crop. Studies on adaptability and yield stability of cultivars and lines have pointed to the importance of the interaction between genotypes and environments (GE interaction) and, as a consequence, the variable behavior of these genotypes according to different locations, years, and cul-tivation periods (Ramalho et al., 1993; Carbonell & Pompeu, 2000).
In bean breeding programs, the identification of “strategic sites” for the selection, based on GE interac-tions and using data on grain productivity and reaction to diseases, is also important. Strategic sites have been investigated in the States of São Paulo (Carbonell & Pompeu, 1997), Minas Gerais (Abreu et al., 1992), and Goiás (Duarte & Zimmermann, 1991).
Aiming the selection and recommendation of new cultivars, statistical methodologies have been used for various crops to evaluate genotype behavior in dif-ferent environments. For the common bean, Carbonell et al. (2001) applied two methodologies to evaluate the adaptability and stability of 12 cultivars in 24 environ-ments of the State of São Paulo, during 1997 and 1998. According to these authors, the method of Lin & Binns (1988), modified by Carneiro (1998), presented the most informative and consistent results than the Cruz et al. (1989) method, which suggested that the most stable and responsive cultivars were also the most pro-ductive.
The use of uni-multivariate method called Addi-tive Main Effects and MultiplicaAddi-tive Interaction Analy-sis - AMMI (Gauch & Zobel, 1996) was proposed for studies involving adaptability and phenotypic stability (Duarte & Venkovsky, 1999). According to Gauch & Zobel (1996), AMMI can help to identify highly produc-tive and broadly adaptable genotypes, and perform the so-called ecological regionalization, to establish region spe-cific recommendations.
A total of 18 bean cultivars and lines, participants of the State Evaluation System, were evaluated in this study, aiming at a registration by the Ministério da Agricultura, Pecuária e Abastecimento – MAPA (Minis-try of Agriculture, Animal Husbandry, and Supply) and the recommendation of cultivars. Phenotypic adaptabil-ity and stabiladaptabil-ity analyses were carried out by the method of Lin & Binns (1988), modified by Carneiro (1998), and by AMMI, in 23 environments (combinations of seasons, locations, and years of cultivation), and the efficiency of these methods was also discussed.
MATERIAL AND METHODS
Trials
Experiments for the evaluation of the 18 cultivars and lines were set up in 1999 and 2000, in the main bean producing regions of São Paulo, Brazil, during the rainy, dry, and winter seasons (Table 1). The experimental de-sign consisted of randomized complete block dede-sign, with four replications. Each plot contained four rows, five meter long, 0.60 m between rows (in winter), 0.50 m (rainy and dry), and 0.20 m along the row, with three seeds per pit. Two out of three plants per pit were left after thinning (60 plants per row). Only the two central rows of each plot were harvested. The experimental man-agement (fertilization, thinning, crop spraying, and har-vest) was made as described by Carbonell et al. (2001).
Data analyses
‘IAC-Carioca’ (carioca), ‘IAC-Carioca Eté’ (ca-rioca), ‘IAC-Una’ (black) and ‘FT-Nobre’ (black) were used as standard cultivars and compared to others, using the Dunnett test (α = 0.05). Joint variance analyses were carried out for grain productivity per sowing season and for the combined seasons (Table 2). Homogeneity analy-ses of variance were performed through the Hartley test. When necessary, degrees of freedom were adjusted accord-ing to Cochran (1954). Analyses of grain productivity sta-bility were processed by the methods of Maximum Yield Deviations (MYD) (Linn & Binns, 1988, modified by Carneiro, 1998) and by Additive Main Effects and Multi-plicative Interaction Analysis (AMMI) (Gauch & Zobel, 1996). The analytical procedure was carried out with the help of the softwares GENES (Cruz, 2001) for MYD, and SAS (SAS Institute, 1989) for AMMI.
The genotype performance (Pi) was estimated for MYD as the mean square of the distance between the cul-tivar mean and the highest mean response of each envi-ronment. Since this maximum response is at the upper limit of each environment, the lowest mean square (low-est Pi) indicates the general superiority of the cultivar in study. This superiority mean is calculated by (1):
e 2
) M Y ( P
n
1 j
2 j ij
i
å
=
-= (1)
f 2
) M Y ( P
f
1 j
2 j ij
if
å
=
-= (2)
u M Y P
u j
j ij iu
2 ) (
1
2
å
=
-= (3)
pro-Cultivars and Lines Environments (Seasons)
Rainy Dry Winter Rainy/Dry/Winter
Code Name Graintype Code Environments(Local-Year) Code (Local-Year)Environments Code Environments(Local-Year) Code (Local-Season-Year)Environments
1 FT-Nobre Carioca A Capão Bonito - 1999 I Capão Bonito -1999 O Tatuí -1999 I Capão Bonito-Dry - 1999
2 FT-Porto Real Carioca B Mococa-1999 J Capão Bonito
-2000 P
Votuporanga
-1999 O
Tatuí Winter -1999
3 FT-901909 Carioca C Espírito Santo doPinhal - 1999 K 2000Adamantina1 - Q 1999Ribeirão Preto - P Votuporanga -Winter -1999
4 GenC97-2 Carioca D Taquarituba - 1999 L 2000Adamantina2 - R 1999Pindamonhangaba- Q Ribeirão Preto -Winter -1999
5 GenC97-3 Carioca E 2000Monte Alegre do Sul- M Espírito Santo doPinhal - 2000 S Pindorama - 1999 R Pindamonhangaba -Winter -1999
6 GenC97-7 Carioca F Capão Bonito - 2000 N Itapeva - 2000 T Pindorama - 2000 S Pindorama -Winter-1999
7 GenC97-10 Carioca G Mococa - 2000 U 2000Adamantina3 - A Capão Bonito -Rainy -1999
8 IAC-Carioca Carioca H Espírito Santo doPinhal - 2000 V 2000Adamantina4 - B Mococa -Rainy-1999
9 IAC-CariocaEté Carioca X Mococa-2000 C Espírito Santo doPinhal -Rainy-1999
10 IAC-Una Carioca D Taquarituba -Rainy -1999
11 IAPAR-80 Carioca J Capão Bonito -Dry-2000
12 IAPAR-81 Carioca K 2000Adamantina1 -
Dry-13 LM-932042-17 Preto L 2000Adamantina2 -
Dry-14 LP 9637 Preto M Espírito Santo doPinhal-Dry - 2000
15 LP 9672 Preto N Itapeva-Dry - 2000
16 MA-733327 Preto T Pindorama
-Winter-2000
17 PF-902998 Preto U Adamantina3 -Winter-2000
18 Princesa Preto V Adamantina4 -Winter-2000
X MococaWinter
-2000
E Sul-Rainy - 2000Monte Alegre do
F Capão Bonito-Rainy- 2000
G MococaRainy
-2000
H Espírito Santo doPinhal-Rainy -2000 Table 1 - Cultivars, lines, environments and their respective codes evaluated in the São Paulo State common bean yield trials.
Adamantina: 51°11’59W - 21°24’S; Capão Bonito: 48°36’W - 23°50’S; Espírito Santo do Pinhal: 46°55’W - 22°04’S; Itapeva: 49°15’W - 23°35’S; Mococa: 47°16’W - 21°16’S; Monte Alegre do Sul: 46°45’W - 22°38’S; Pindamonhangaba: 45°41’W - 22°43’W; Pindorama: 49°01’W - 21°7’S; Ribeirão Preto: 47°59’W - 21°04’S; Taquarituba: 49°40’W - 23°24’S; Tatui: 48°05’W - 23°13’S and Votuporanga: 50°11’W - 29°19’S.
ductivity in the environment j; Mj is the highest response obtained among all cultivars in environment j; and e, f, and u express the total number of environments , favor-able and unfavorfavor-able, respectively.
However, to obtain cultivar recommendations which include the aspect of favorable (f) and unfavor-able (u) environment groups, expressing, in a way, environments of high and low technology input, Carneiro (1998) suggested to split Pi in two parts, fa-vorable (Pif) in (2) and unfavorable (Piu) in (3). The
clas-sification of these environments was made based on environmental indices, defined as the difference between the evaluated cultivar mean in each environ-ment and the general experienviron-mental mean. Favorable en-vironments (f) are those that present means above or equal to zero, while the unfavorable (u) present nega-tive indices.
multipli-cative components for the interaction effect (geij) between them. In this model, besides the general mean (µ) and the Pooled Error (εij), the other terms are the result of the in-teraction matrix GE(ge) = [(gê)ij)], using the Analysis of Principal Components (PCA) for this purpose. Conse-quently, the mean productivity of one genotype i in an environment j is expressed in (4) as:
å
= e + r + a g l + + + m = U n 1 k ij ij jk ik k j iij g e (4)
where Yij is the mean productivity of the genotype i in
the environment j; µ is the general mean productivity; gi is the effect of the genotype i; ej is the effect of the envi-ronment j; εij is the Pooled Error regarding Yij, assumedly independent and normally distributed; ρij is the PCA resi-due (“noise” portion); λk is the eigenvalue of the PCA axis k, obtained from the matrices (GE)(GE)’ and (GE)’(GE) (of nonzero eigenvalues); λik and αjk are the scores of the principal components of genotype i and en-vironment j, respectively, on the PCA axis k; and n is the number of axes or the retained principal components to describe the standard GE interaction.
s e c r u o
S Environments(Seasons)
y n i a
R Dry Winter Rainy/Dry/Winter
f
d MS F/Fr df MS F/Fr df MS F/Fr Df MS F/Fr
/ n o i t a c il p e R l a i r
T 24 720648.93 4.9 18 539330.34 4.18 27 229934.16 1.67 69 481329.60 3.47
e n i L / r a v i t l u C ) L / C
( 17 1138237.69 7.73** 17 263836.65 2.05** 17 712911.27 5.17** 17 1399777.73 10.09**
s t n e m n o r i v n E ) E
( 7 27570628.08 187.29** 5 37872404.62 293.85** 8 42652071.71 309.6** 22 33521973.92 241.63**
E x L /
C 1/ 93 633681.09 4.3** 85 253385.02 1.97** 105 288519.77 2.09** 291 396639.03 2.86**
1 A C P
I 23 1272587.04 8.64** 21 391108.00 3.03** 24 658329.56 4.78** 38 1045194.12 7.53**
l a u d i s e R 1 I M M
A 70 480778.25 3.27** 64 208208.38 1.61* 81 240279.00 1.74** 253 332872.72 2.40**
2 A C P
I 21 1151490.04 7.82** 19 260314.60 2.02** 22 408923.04 2.97** 36 844795.00 6.09**
l a u d i s e R 2 I M M
A 49 292278.94 1.99** 45 186207.98 1.44* 59 199054.91 1.44* 217 271442.04 1.96**
3 A C P
I 19 486581.41 3.30** 17 244063.08 1.89* 20 353720.20 2.57** 34 528180.60 3.81**
l a u d i s e R 3 I M M
A 30 227292.38 1.54* 28 151081.67 1.17 39 154864.83 1.24 183 238625.84 1.72**
4 A C P
I 17 252786.89 1.72* 15 182310.46 1.41 18 297168.69 2.16** 32 407709.06 2.94**
l a u d i s e R 4 I M M
A 13 216179.38 1.47 13 115048.46 0.89 21 105605.80 0.77 151 215503.35 1.55**
5 A C P
I 16 169123.89 1.23 30 397347.95 2.86**
l a u d i s e R 5 I M M
A 5 77375.55 0.56 121 188761.50 1.36**
6 A C P
I 28 380911.01 2.75**
l a u d i s e R 6 I M M
A 93 156192.26 1.14
7 A C P
I 26 234415.07 1.69*
l a u d i s e R 7 I M M
A 67 144980.30 1.04
8 A C P
I 24 220160.28 1.58*
l a u d i s e R 8 I M M
A 43 130660.30 0.94
9 A C P
I 22 230879.87 1.66*
l a u d i s e R 9 I M M
A 21 109460.01 0.79
0 1 A C P
I 20 176119.43 1.27
l a u d i s e R 0 1 I M M
A 1 93588.72 0.14
r o r r
E 1/ 306 147210.28 306 128885.25 342 137766.77 903 138734.55
n a e
M 2496 2263 2473 2425
% V
C 15 16 15 13
Table 2 - ANOVA for the São Paulo State common bean yield (kg.ha-1) trials. The C/L-E interaction was partitioned to
Interaction Principal Component Axes (IPCA) by using AMMI model.
**, *F-test significant at the 1% and 5%, respectively.
1Degrees of freedom for Pooled Error, C/L-E interaction and its partitions in the dry, rainy and winter seasons and joint seasons were
AMMI recovers the portion of the sum of squares of the GE interaction (SSGE), which is actually an estimate of interaction, known as “standard” portion, and the “noise” portion, known as residual (Weber et al., 1996). “Standard” stands for the general law of matrix formation which domi-nates the phenomena of the GE interaction, explained by the n first PCA axes. An investigation of these axes allows the identification of the environmental and genetic factors which are more directly related to the interaction. The noise, present in GE, but not strongly determined by geno-types and environments (matrix lines and columns) is, thus, discarded (Duarte & Venkovsky, 1999). This approach en-hances the prediction capacity of the model.
Not seldom, the choice of the most suitable AMMI model in terms of number of IPCA axes to be re-tained and able to explain the interaction, is determined by the SSGE proportion accumulated up to the nth axis (
∑
=
n k
GE k SS
1 2/
λ ). For this purpose, the Fr test of Cornelius et al. (1992) is used as applied by Piepho (1995), who tests the AMMI residual of the IPCA axis. A significant re-sult of the Fr test suggests that at least one multiplicative term should still be added to the n already adjusted axes. Once the AMMI model which best describes results is selected, the result of the stability analysis is displayed in the biplot.
Biplots are obtained by combinations of the IPCA scores and capture the standard portion of the GE inter-action, since they are able to identify genotypes with ti-niest contributions to the interaction (stable); or yet com-binations of desirable genotypes and environments in terms of adaptability and stability. Basically, these biplots belong to two types: AMMI 1 and AMMI 2 (Duarte & Venkovsky, 1999). In AMMI 1, the genotype and envi-ronment means are plotted on the abscissa, and the IPCA scores for the same genotypes and environments, on the ordinate. Nevertheless, in AMMI 2, the IPCA scores of the first and second principal components are plotted on the abscissa and ordinate, respectively. For interpretation of the AMMI 1 biplot, the magnitude and signal of the scores of the IPCA1 is observed; scores close to zero are characteristic of genotypes and environments which con-tribute little to the interaction, that is, they are stable. In a biplot of AMMI 2, the stable genotypes and environ-ments are those that are placed in a circle around the score crossing, close to the origin of the axes.
Although there is no consensus on the minimum proportion of the SSGE that must be accumulated by the first IPCA axis for presentation of the biplot, the visual inspection is convenient. According to Duarte & Venkovsky (1999), biplots have been presented with first axes which accumulated a proportion between 27.1 and 71%. In this study, the Fr test results were presented (Table 3), although, because of its excessive rigorism, it was decided to present the biplots in those cases where
the first IPCA axis accumulated over 25% of the SSGE and offered a similar order of cultivars and lines as the MYD method, independently of the significance of the Fr tests. Furthermore, for better visual display, the AMMI 1 biplots were presented under omission of the environments.
RESULTS AND DISCUSSION
Individual analyses of variance were carried out for the 23 environments (Table 1). A high significance for cultivars, environments, and for the GE interactions was revealed by the joint analyses of variance for each planting season separately, and in the set (Table 2). It is therefore possible, taking the differential behavior in the included environments into consideration, to select the most stable and productive cultivars and lines. An experi-mental coefficient of variation (CVe) equal to or under 16% can also be observed in the analyses in relation to single and joint seasons and mean productivities above 2,260 kg ha-1, demonstrating a good experimental preci-sion and high yield potential of the evaluated cultivars and lines. CVe values and mean productivities of the same magnitude were reported by Carbonell et al. (2001).
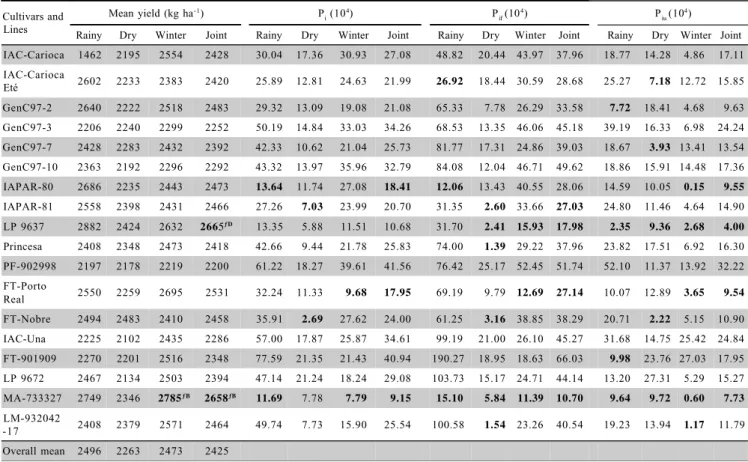
The relation of the mean seasonal productivity (either one by one or joint) (Table 3) allows the identifi-cation of line MA-733327, for winter, and the lines LP 9637 and, again, MA-733327 for the joint seasons, as su-perior. The mean grain productivity in the dry season (2,263 kg ha-1) was 9% lower than the one obtained in the rainy season (2,496 kg ha-1) and in the winter (2,473 kg ha-1). The smaller productivity during the dry season can be probably attributed to the occurrence of high tem-peratures during flowering and pod formation, giving rise to aborting of flowers and pods. On the other hand, the highest grain productivity obtained during the rainy sea-son and the winter is probably a consequence of regular rainfalls throughout the entire crop cycle of the rainy sea-son, and the artificial irrigation applied during winter.
Estimates of adaptability and stability parameters obtained by the MYD method (Table 3) for cultivar and line recommendations for a broad range of environments (the three seasons together), show that the lines MA-733327 and LP 9637 and the cultivars FT-Porto Real and IAPAR-80 are the most stable (< Pi and < Piu) and respon-sive (< Pif), only to underscore the four genotypes. These four most stable cultivars and lines also contain the most productive group and can therefore be recommended for all environments presented here.
decreasing of stability, were FT-Nobre (1), LM-932042-17 (13), FT-Porto Real (2), GenC97-2 (4), MA-733327 (16), and LP 9637 (14). The reduced absorption of the interaction by the first principal component might have led to this distortion in the blipot. ‘MA-733327’, ‘LP 9637’, and ‘FT-Porto Real’ were also identified by MYD (Table 3) as the most adapted, stable, and most respon-sive to environmental enhancement, although in decreas-ing order of stability and productivity.
By the AMMI 2 biplot (Figure 1H), conclusions can be drawn on the most stable environments: Mococa-Rainy-2000 (G), Capão Bonito-Dry-2000 (J),
Mococa-1999 (B), and Adamantina 3-2000 (U). It is also possible
to identify strategic environments for a differentiation of the genotypes in the cases: Monte Alegre do Sul-2000 (E), Espírito Santo do Pinhal-Rainy-2000 (H), Capão
Bo-nito-Rainy-2000 (F), and Votuporanga-Winter-1999 (P).
Carbonell & Pompeu (1997) reported on Capão Bonito as a genotype discriminating environment for, mainly, re-action to diseases, and Mococa, as a homogenous and less stressful environment.
For a specific recommendation of adaptation to the rainy season by MYD, lines MA-733327 and LP
9637, and the cultivar IAPAR-80 were the most out-standing (Table 3), as the most stable (< Pi). Line MA-733327 and the cultivars IAPAR-80 and IAC-Carioca Eté were most responsive (< Pif) to environmental im-provements, and lines LP 9637, GenC97-2, and MA-733327 most stable in unfavorable environments. By the AMMI 1 biplot (Figure 1A), with the first axis of the IPCA which accumulates 38.80% of the SSGE, the most stable and productive cultivars and lines, in decreasing order for stability and increasing order of productivity were FT-Porto Real (2), IAC-Carioca Eté (9), GenC97-2 (4), MA-7333GenC97-27 (16), and LP 9637 (14). Despite the fact that both methods presented the latter lines as stable, the most stable cultivars and lines identified by AMMI, opposite to the MYD, were again not the most produc-tive, although the absorption of the interaction was greater than in the combination of the seasons. The most differentiating environments of cultivars and lines (Fig-ure 1B) were Monte Alegre do Sul-2000 (E), Espírito
Santo do Pinhal-Rainy-2000 (H), and Capão
Bonito-Rainy-2000 (F).
For the dry season, the MYD method identified FT-Nobre, LP9637, and IAPAR-81 (Table 3) as most
Cultivars and Lines
Mean yield (kg ha- 1) P
i (10
4) P
if (10
4) P
iu (10 4)
Rainy Dry Winter Joint Rainy Dry Winter Joint Rainy Dry Winter Joint Rainy Dry Winter Joint
IAC-Carioca 1462 2195 2554 2428 30.04 17.36 30.93 27.08 48.82 20.44 43.97 37.96 18.77 14.28 4.86 17.11
IAC-Carioca
Eté 2602 2233 2383 2420 25.89 12.81 24.63 21.99 26.92 18.44 30.59 28.68 25.27 7.18 12.72 15.85
GenC97-2 2640 2222 2518 2483 29.32 13.09 19.08 21.08 65.33 7.78 26.29 33.58 7.72 18.41 4.68 9.63
GenC97-3 2206 2240 2299 2252 50.19 14.84 33.03 34.26 68.53 13.35 46.06 45.18 39.19 16.33 6.98 24.24
GenC97-7 2428 2283 2432 2392 42.33 10.62 21.04 25.73 81.77 17.31 24.86 39.03 18.67 3.93 13.41 13.54
GenC97-10 2363 2192 2296 2292 43.32 13.97 35.96 32.79 84.08 12.04 46.71 49.62 18.86 15.91 14.48 17.36
IAPAR-80 2686 2235 2443 2473 13.64 11.74 27.08 18.41 12.06 13.43 40.55 28.06 14.59 10.05 0.15 9.55
IAPAR-81 2558 2398 2431 2466 27.26 7.03 23.99 20.70 31.35 2.60 33.66 27.03 24.80 11.46 4.64 14.90
LP 9637 2882 2424 2632 2665ƒD 13.35 5.88 11.51 10.68 31.70 2.41 15.93 17.98 2.35 9.36 2.68 4.00
Princesa 2408 2348 2473 2418 42.66 9.44 21.78 25.83 74.00 1.39 29.22 37.96 23.82 17.51 6.92 16.30
PF-902998 2197 2178 2219 2200 61.22 18.27 39.61 41.56 76.42 25.17 52.45 51.74 52.10 11.37 13.92 32.22
FT-Porto
Real 2550 2259 2695 2531 32.24 11.33 9.68 17.95 69.19 9.79 12.69 27.14 10.07 12.89 3.65 9.54
FT-Nobre 2494 2483 2410 2458 35.91 2.69 27.62 24.00 61.25 3.16 38.85 38.29 20.71 2.22 5.15 10.90
IAC-Una 2225 2102 2435 2286 57.00 17.87 25.87 34.61 99.19 21.00 26.10 45.27 31.68 14.75 25.42 24.84
FT-901909 2270 2201 2516 2348 77.59 21.35 21.43 40.94 190.27 18.95 18.63 66.03 9.98 23.76 27.03 17.95
LP 9672 2467 2134 2503 2394 47.14 21.24 18.24 29.08 103.73 15.17 24.71 44.14 13.20 27.31 5.29 15.27
MA-733327 2749 2346 2785ƒB 2658ƒB 11.69 7.78 7.79 9.15 15.10 5.84 11.39 10.70 9.64 9.72 0.60 7.73
LM-932042
-17 2408 2379 2571 2464 49.74 7.73 15.90 25.54 100.58 1.54 23.26 40.54 19.23 13.94 1.17 11.79
Overall mean 2496 2263 2473 2425
Table 3 - São Paulo State common bean yield (kg ha-1) evaluated in 23 environments (combinations of Seasons, Locations
and Years. Estimates of stability (Pi) were performed by the MYD method, by partitioning it into parts due to
favorable (Pif) and unfavorable (Piu) environments.
f D e f B: Dunnett test at the 5%. Significant values was compared to IAC-Carioca (Diverse grain - D) and IAC-Una (Black grain - B) as the
stable cultivars and lines. The two latter were also respon-sive to environmental enhancement and the former pre-sented stability to favorable environments (<Piu). An analysis of the dry season by the AMMI 1 biplot (Figure 1E), with the first axis of the IPCA which accumulates 38.13% of the SSGE and a highly significant Fr test (Table 2) for AMMI 2 (absorption of 61.09% of the SSGE), iden-tified the cultivars and lines Princesa (18), LM932042-17 (13), LP 9637 (14), and FT-Nobre (1) as most stable
and productive, both in increasing order. The combina-tion of the percentage with the significance of the Fr test is more important than the percentage magnitude of the interaction absorption by the first principal component for the graphic representation. In case the Fr test should al-ready be significant for the first and second axis, the AMMI biplots 1 and 2 would be less distorted, despite the low percentage value. Again, both methods are re-markably congruent and identify two most stable and
pro-Figure 1- Biplots of the AMMI model for São Paulo state common bean yield trials with 18 cultivars and lines evaluated in rainy, dry and winter seasons and in joint season, for crops 1999 and 2000. Cultivars and environments (seasons) codes are given in Table 1.
1 2 3 4 5 6 7 8 9 10 11 12 13 14 15 16 18 -30 -20 -10 0 10 20
2200 2300 2400 2500 2600 2700 2800 2900
Mean yield in kg ha-1
A - RAINY
1 2 3 4 5 6 7 8 9 10 11 12 13 14 15 16 17 18 A B C D E F G H -35 -25 -15 -5 5 15 25 35 45
-30 -20 -10 0 10 20 30 40 B - RAINY
IPCA 1 1 2 3 4 5 6 7 8 9 10 11 12 13 14 15 16 17 18 -25 -15 -5 5 15 25
2200 2300 2400 2500 2600 2700 2800 C - WINTER
Mean yield in kg ha-1
1 2 3 4 5 6 7 8 9 10 11 12 13 14 15 16 17 18 O P Q R S T U V X -25 -15 -5 5 15 25 35
-25 -15 -5 5 15 25 D - WINTER
IPCA 1 1 2 3 4 5 6 78 9 10
11 131214
15 16 17 18 -20 -10 0 10 20 30 40
2050 2150 2250 2350 2450 E - DRY
Mean yield in kg ha-1
1 2 3 4 5 6 7 8 9 10 11 12 13 14 15 16 1718 I J K L M N -20 -15 -10 -5 0 5 10 15 20 25
-25 -15 -5 5 15 25 35
IPCA 1
F - DRY
6 1 2
3 4 5 7 8 9 10 11 12 13 14 15 16 17 18 -45 -30 -15 0 15 30
2150 2250 2350 2450 2550 2650 2750
Mean yield in kg ha-1
G - JOINT
1 2 3 4 5 6 7 8 9 10 11 12 13 14 15 16 17 18 I O P QR S A B C D J K
L M N T U V X E F G H -30 -20 -10 0 10 20 30 40
-40 -30 -20 -10 0 10 20 30 40 50
IPCA 1
H - JOINT
ductive cultivars in common. The most differentiating en-vironments (Figure 1F) were Capão Bonito-Dry-1999 (I),
Capão Bonito-Dry-2000 (J), Adamantina2-2000 (L), and
Espírito Santo do Pinhal-Dry-2000 (M).
In winter, models AMMI 1 and AMMI 2 ab-sorbed 36.99% and 58.05% of the SSGE, respectively. The lines GenC97-2 (4), MA-733327 (16), and LP 9637 (14) were identified as most stable and productive. The MYD method (Table 3) also presented ‘MA733327’, ‘FT- Porto Real’, and ‘LP 9637’ as most stable and responsive to environmental improvement. Cultivar FT-Nobre (1) and lines GenC97-10 (7) and PF-902998 (17) presented spe-cific adaptation to the environment Adamantina 4-2000 (V). Likewise, FT-901909 (3) and MA-733327 (16)
in-dicated specific adaptation to the environments of Votuporanga-1999 (P) and Pindorama-1999 (S),
respec-tively. Other specific adaptations were ‘IAC-Carioca’ (8) to the Pindorama-2000 environment (T), and ‘FT-Porto
Real’ (2) to Pindamonhangaba-1999 (R). The
environ-ments Votuporanga-1999 (P) and Pindorama-1999 (S) are
close in the biplot, evidencing similarity, possibly because they are located in similar edaphoclimatic regions. Adamantina 3-2000 (U) and Adamantina 4-2000 (V),
close in the biplot, are environments which are only sepa-rated by a difference of 30 days in the sowing season (Fig-ure 1D).
This whole differential behavior in relation to the adaptability and stability and to the responsiveness of cul-tivars and lines in the sowing seasons is probably caused, according to Carbonell et al. (2001), by the presence or absence of pathogens and, in some cases, their physiologi-cal races, in different seasons. The response of these cul-tivars and lines under high temperatures also influenced the mean productivities observed in this study. Dias (1998) claims that the selection of most productive and stable genotypes is an indirect form of accessing the dis-ease resistance of cultivars and lines. In this situation, re-sistance is seen as a protection against production loss, from the point of view that resistant cultivars and lines would be the most productive and stable and, therefore, presenting a smaller yield loss. The same train of thought can be extended to resistance to high temperatures dur-ing the dry season.
The applied methods of adaptability and stabil-ity (MYD and AMMI) presented considerable congru-ence, since they identified the same cultivars and lines as stable. MYD, however, invariably identified the most stable cultivars and lines as most productive also, a fact which was not always verified by AMMI. The reason is that MYD identifies the most stable cultivars and lines as those with the smallest deviation from the highest mean productivity in each environment. This procedure agrees to the most recent understanding of adaptation, accord-ing to which an adapted cultivar/line has the highest eco-nomic production (Ceccarelli, 1996). For AMMI, the
clas-sification of the cultivars and lines for stability and pro-ductivity was only the same in the dry season. On the other hand, Gonçalves (1997) did not observe any simi-larity between MYD and AMMI applied to maize, and ascribed this to the small absorption of the interaction variation by the first axis of the IPCA, in this case, 45.8%. The relative agreement between the methods was obtained with absorption percentages varying from 26.20% (joint seasons) to 38.80% (rainy season) of SSGE.
CONCLUSIONS
The analyses of adaptability and stability pro-cessed by the MYD and AMMI methods identified lines MA-733327 and LP 9637 as the most stable and respon-sive to the environmental enhancement for the rainy and winter seasons together. ‘LP 9637’ and ‘FT-Nobre’ were the most stable in the dry season. The first two were also the most productive and are the recommended for the State of São Paulo. MYD and AMMI produced similar results, in terms of the order of the most stable cultivars and lines. The MYD method combined a simple proce-dure, easiness of result interpretation, uniqueness of pa-rameters, and parallelism between stability and yield, though it provides little information on the evaluated en-vironments. The AMMI method comes up for this aspect with a biplot of clear visual display. Furthermore, AMMI is a relative complex method, and requires knowledge on advanced statistics from the breeder, or help of a biometrist.
ACKNOWLEDGEMENTS
To IAC and other Departments of APTA, Coop-eratives and farmers for their help with the set up of the experiments; to FAPESP and CNPq for financial support; to professor João Batista Duarte, of Universidade Fed-eral de Goiás for the AMMI analyses.
REFERENCES
ABREU, A.F.B.; RAMALHO, M.A.P.; SANTOS, J.B. Desempenho e estabilidade fenotípica de cultivares de feijão em algumas localidades do Estado de Minas Gerais no período de 1989-1991. Ciência e Prática, v.16, p.18-24, 1992.
CARBONELL, S.A.M.; POMPEU, A.S. Estratificação de ambientes em experimentos de feijoeiro no Estado de São Paulo. Bragantia, v.56, p.207-218, 1997.
CARBONELL, S.A.M.; POMPEU, A.S. Estabilidade fenotípica de linhagens de feijoeiro em três épocas de plantio no Estado de São Paulo. Pesquisa Agropecuária Brasileira, v.35, p.321-329, 2000.
CARBONELL, S.A.M.; AZEVEDO FILHO, J.A.; DIAS, L.A.S.; GONÇALVES, C.; ANTONIO, C.B. Adaptabilidade e estabilidade de produção de cultivars e linhagens de feijoeiro no Estado de São Paulo. Bragantia, v.60, p.69-77, 2001.
CARNEIRO, P.C.S. Novas metodologias de análise da adaptabilidade e estabilidade de comportamento. Viçosa: UFV, 1998. 155p. (Tese -Doutorado).
COCHRAN, W.G. The combination of estimates from different experiments. Biometrics, v.10, p.101-129, 1954.
CORNELIUS, P.L.; SEYEDSADR, M.S.; CROSSA, J. Using the shifted multiplicative model to search for ‘separability’ in crop cultivar trial. Theoretical and Applied Genetics, v.84, p.161-172, 1992.
CRUZ, C.D. Programa Genes: versão Windows;aplicativo computacional em genética e estatística. Viçosa: UFV, 2001. 648p.
CRUZ, C.D.; TORRES, R.A.; VENCOVSKY, R. An alternative approach to the stability analysis proposed by Silva e Barreto. Revista Brasileira de Genética, v.12, p.567-580, 1989.
DIAS, L.A.S. Novos rumos no melhoramento genético do cacaueiro. In: SIMPÓSIO SOBRE ATUALIZAÇÃO EM GENÉTICA E MELHORAMENTO DE PLANTAS, 3., Lavras, 1998. Anais. Lavras: UFLA, Núcleo de Estudos de Genética, 1998. p.9-27.
DUARTE, J.B.; VENCOVSKY, R.. Interação genótipos x ambientes: uma introdução à análise “AMMI”. Ribeirão Preto: Sociedade Brasileira de Genética, 1999. 60p. (Série Monografias, 9).
DUARTE, J.B.; ZIMMERMANN, M.J. Selection of location for common bean (Phaseolus vulgaris L.) germplasm evaluation. Revista Brasileira
de Genética, v.14, p.765-770, 1991.
GAUCH, H.G.; ZOBEL, R.W. AMMI analysis of yield trials. In: KANG, M.S.; GAUCH. H.G. (Ed.) Genotype by environment interaction. Boca Raton: CRC Press, 1996. cap.4, p.85-122.
GONÇALVES, F.M.A. Adaptabilidade e estabilidade de cultivares de milho avaliadas em “safrinha” no período de 1993 a 1995. Lavras: UFLA, 1997. 98p. (Dissertação - Mestrado).
Received October 04, 2002 Accepted December 12, 2003
LIN, C.S.; BINNS, M.R. A superiority measure of cultivar performance for cultivar x location data. Canadian Journal of Plant Science, v.68, p.193-198, 1988.
PIEPHO, H.P. Robustness of statistical test for multiplicative terms in the additive main effects and multiplicative interaction model for cultivar trial. Theoretical and Applied Genetics, v.90, p.438-443, 1995. PINZAN, N.R.; BULISANI, E.A.; BERTI, A.J. Feijão: zoneamento
ecológico e épocas de semeadura para o Estado de São Paulo. Campinas: CATI, 1994. 19p. (Boletim Técnico, 218).
RAMALHO, M.A.P.; ABREU, A.F.B.; RIGHETTO, G.U. Interação de cultivares de feijão por épocas de semeadura em diferentes localidades do Estado de Minas Gerais. Pesquisa Agropecuária Brasileira, v.28, p.1183-1189, 1993.
SAS INSTITUTE. SAS/STAT user’s guide: version 6. 4.ed.Cary: Statistic Analysis System, 1989. v.2, 846p.