Crop Breeding and Applied Biotechnology 9: 132-139, 2009
Brazilian Society of Plant Breeding. Printed in Brazil
Received 02 October 2008
Accepted 22 February 2009
Strategies for recommendation of common bean lines
tested for value of cultivation and use in different
environments
Ranoel José de Sousa Gonçalves1, Ângela de Fátima Barbosa Abreu2, Magno Antonio Patto Ramalho1*, and Adriano Teodoro Bruzi1
ABSTRACT - The purpose of this study was to develop strategies for the recommendation of common bean cultivars tested in VCU trials with regard to the performance of lines with different growth habits, at different fertilizer rates and sowing densities. It was found that the grain yield of lines is more affected by variations in fertilizer rates than of the sowing density; the response of the lines to higher planting density and fertilizer rate varies with the environment of evaluation and does not depend on the growth habit, the interactions between fertilizer rates and sowing densities were significant, demonstrating the importance of VCU trials with different fertilizer rates and sowing densities.
Key words: Phaseolus vulgaris L., genotype - environment interaction, stability, fertilizer rates, sowing densities.
1 Departamento de Biologia, Universidade Federal de Lavras (UFLA), C.P. 3037, 37200-000, Lavras, MG, Brazil. *E-mail: [email protected] 2 Embrapa Arroz e Feijão/UFLA, C.P. 3037, 37200-000, Lavras, MG, Brazil
INTRODUCTION
Before a new common bean (Phaseolus vulgaris L.) line is recommended to farmers, it must be evaluated in trials testing the Value of Cultivation and Use (VCU). The Ministry of Agriculture, Livestock and Food Supply of Brazil (MAPA) requires that such experiments are conducted at least three locations per soil-climatic region that is relevant for the crop in each growing season (spring-summer, summer-autumn and autumn-winter) for a minimum period of two years (Brazil 1998). A standard management system is used in such experiments, i.e., the row spacing, sowing density and
suitable, and the nutrient requirements for earlier cultivars may differ.
It is therefore important that the recommendation of a line is coupled with information on the most recommended density and fertilizer. For this purpose, information could be obtained in the VCU trials using different management systems. This would not only produce the desired information, but the interactions involving these different management variables could be estimated as well.
The purpose of this study was to develop strategies for the recommendation of common bean cultivars tested in VCU trials with regard to the performance of lines with different growth habits, at different fertilizer rates and sowing densities.
MATERIAL AND METHODS
The experiments were conducted in six environments (growing seasons and locations) from November 2006 to February 2008. Nine experiments were conducted in each environment, resulting from combinations of three fertilizer rates and three sowing densities. Fertilizer rates of 0, 300 and 600 Kg ha-1 of N,
P2O5 and K2O compound fertilizer (8-28-16) were applied
at sowing and 0, 100 and 200 Kg ha-1 ammonium sulfate
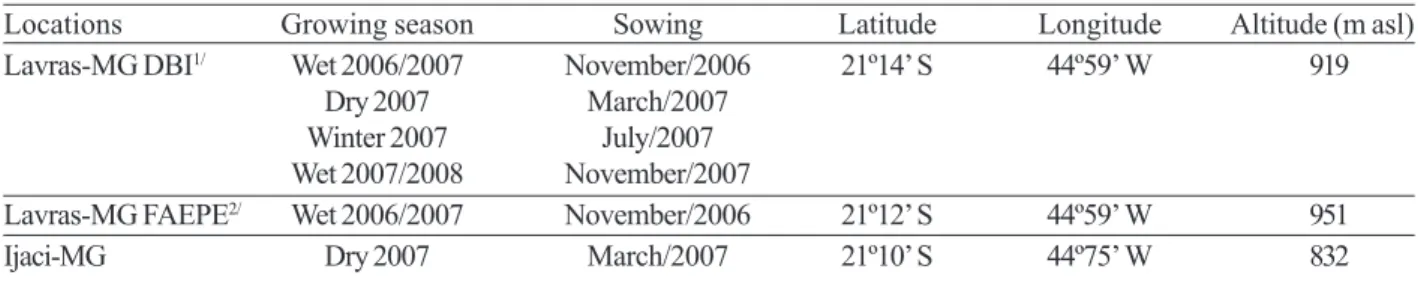
as top dressing, 20 days after emergence. The sowing densities were 10, 15 and 20 seeds per meter. The main characteristics of the locations and growing seasons of the experiments are listed in Table 1 and the soil chemical properties in Table 2.
Eleven common bean lines were evaluated in these experiments (main traits in Table 3) in a randomized block design with three replications. Each plot consisted of three 3.0-m long rows, spaced 0.5 m apart in all experiments. Along the entire length of each row, 60
seeds were sown for a density of 10 plants m-1 and 90
seeds for densities of 15 and 20 seeds m-1. Seven to ten
days after emergence the seedlings were thinned to 30, 45 and 60 plants (densities of 10, 15 and 20 seeds m-1,
respectively) in each row.
The fertilizer rates at sowing as well as for top dressing (20 days after emergence) were applied by hand in all experiments. In the dry and winter growing seasons, sprinkler irrigation was used. The other cultural treatments in the three growing seasons were applied as recommended for the crop. The center row of each plot was harvested, the plants per row were counted and the grain yields calculated in kg ha-1.
Prior to the analysis of variance of grain yield, analysis of variance was performed for the stand of each experiment. Since the effect of lines was not significant in most tests, it was decided to correct the stand to an ideal value for each sowing density, in all experiments, by analysis of covariance. Subsequently, the Hartley test was applied to verify the homogeneity of variance of errors prior to the joint analysis of variance of grain yield (kg ha-1) involving the effects of environments
(growing seasons and locations), fertilizer rates and sowing densities, using PROC GLM of SAS (SAS 2000). Using the sum of squares (SS) in the joint analysis, the contribution of each source of variation to total sum of square (R2
f) was estimated be the expression:
The means of the lines were compared by the Scott-Knott test (1974). Based on the grain yield means (Kg ha-1) of the lines evaluated in the different
experiments, the stability and adaptability were analyzed by the graphical method (Nunes et al. 2005), using software SAS (SAS 2000).
Locations Growing season Sowing Latitude Longitude Altitude (m asl) Lavras-MG DBI1/ Wet 2006/2007 November/2006 21º14’ S 44º59’ W 919
Dry 2007 March/2007 Winter 2007 July/2007 Wet 2007/2008 November/2007
Lavras-MG FAEPE2/ Wet 2006/2007 November/2006 21º12’ S 44º59’ W 951
Ijaci-MG Dry 2007 March/2007 21º10’ S 44º75’ W 832
1/ Department of Biology of the Universidade Federal de Lavras 2/ Farm of FAEPE (Fundação de Amparo ao Ensino, Pesquisa e Extensão)
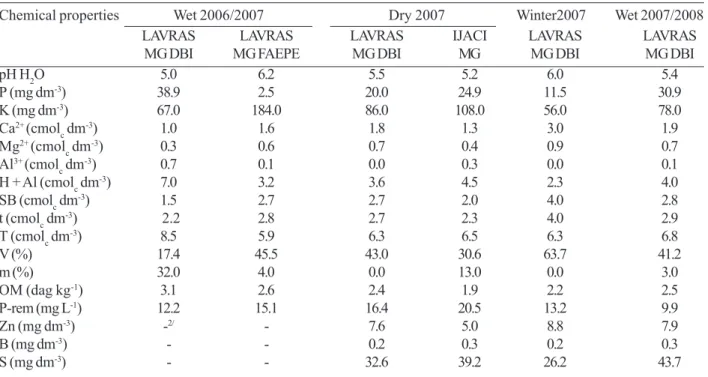
1/ Analyses at the soil analysis laboratory of the Soil Science Department, UFLA 2/ Element not stated in the soil analysis
SB : sum of bases; t : Effective cation exchange capacity ; T : Total cation exchange capacity V : base saturation m : aluminum saturation; OM : organic matter
Table 2. Chemical analyses of soil samples from the 0-20 cm layer of experimental areas in Lavras-MG and Ijaci-MG, prior to the
installation of the experiments1/
Lines Origin Growth habit/ Grain color
BRS Radiante EMBRAPA I beige with red stripes
CNFRJ 10564 EMBRAPA I beige with red stripes
IAPAR 81 IAPAR II beige with brown stripes
BRS Horizonte EMBRAPA II beige with brown stripes
BRS Valente EMBRAPA II black
BRS Supremo EMBRAPA II black
Carioca MG UFLA II beige with brown stripes
BRSMG Talismã UFLA/UFV/EPAMIG/EMBRAPA III beige with brown stripes
Pérola EMBRAPA III beige with brown stripes
Ouro Negro Honduras III black
BRSMG Majestoso UFLA/UFV/EPAMIG/EMBRAPA III beige with brown stripes
1/ I- determinate growth , II- indeterminate growth with short vines, III- indeterminate growth with long vines Table 3. Main characteristics of the common bean lines used in the experiments
To apply the graphical method in each experiment the line means were standardized by the expression:
where:
Ziq: standardized value of the variable in line i in
experiment q; iq : mean of line i in experiment q; .q :
mean of the experiment q; s.q: phenotypic standard
deviation among the lines in experiment q.
Since the standardized variable can have positive or negative values, a constant was added to ensure that the Ziq values are always positive to facilitate the
Chemical properties Wet 2006/2007 Dry 2007 Winter2007 Wet 2007/2008 LAVRAS LAVRAS LAVRAS IJACI LAVRAS LAVRAS
MG DBI MG FAEPE MG DBI MG MG DBI MG DBI
pH H2O 5.0 6.2 5.5 5.2 6.0 5.4
P (mg dm-3) 38.9 2.5 20.0 24.9 11.5 30.9
K (mg dm-3) 67.0 184.0 86.0 108.0 56.0 78.0
Ca2+ (cmol c dm
-3) 1.0 1.6 1.8 1.3 3.0 1.9
Mg2+ (cmol c dm
-3) 0.3 0.6 0.7 0.4 0.9 0.7
Al3+ (cmol c dm
-3) 0.7 0.1 0.0 0.3 0.0 0.1
H + Al (cmolc dm-3) 7.0 3.2 3.6 4.5 2.3 4.0
SB (cmolc dm-3) 1.5 2.7 2.7 2.0 4.0 2.8
t (cmolc dm-3) 2.2 2.8 2.7 2.3 4.0 2.9
T (cmolc dm-3) 8.5 5.9 6.3 6.5 6.3 6.8
V (%) 17.4 45.5 43.0 30.6 63.7 41.2
m (%) 32.0 4.0 0.0 13.0 0.0 3.0
OM (dag kg-1) 3.1 2.6 2.4 1.9 2.2 2.5
P-rem (mg L-1) 12.2 15.1 16.4 20.5 13.2 9.9
Zn (mg dm-3) -2/ - 7.6 5.0 8.8 7.9
B (mg dm-3) - - 0.2 0.3 0.2 0.3
graphical interpretation. The mean Ziq values for line i in the experiments considered ( ) produce the measure of adaptation of line i. Estimates for Ziq were subjected
to analysis of variance and the mean values were grouped by the Scott-Knott cluster analysis (1974). Based on the standardized values (Ziq) graphs were
constructed for each line i. The dimensions of the axes (experiments) were equivalent to the Ziq values of line i in
experiment q. The coefficients of variation of Ziq were computed for line i in the different experiments (CViq) and
the confidence intervals of CViq estimated using the
modified McKay expression suggested by Vangel (1996). The confidence index in the adoption of the lines was estimated, i.e., the risk of planting a particular line was assessed. For this purpose the method proposed by Annichiarico (1992) was used, based on the mean line yield in the different experiments.
RESULTS AND DISCUSSION
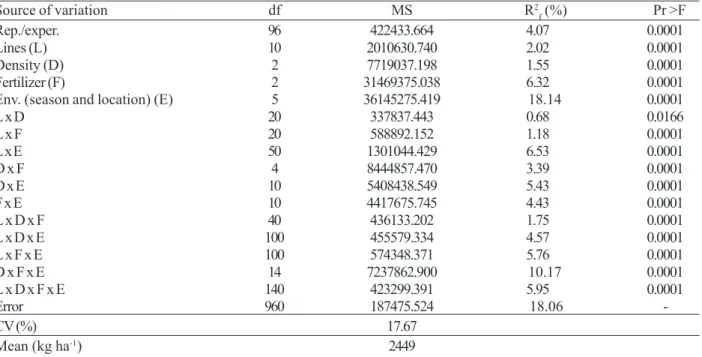
Heterogeneity was observed in the variance of errors by the Hartley test. Six experiments were therefore excluded from the joint analysis. According to the combined analysis of variance, considering the 48 experiments, the experimental precision evaluated by the coefficient of variation (CV =17.7%) was satisfactory
and the effect for all sources of variation was highly significant (P<0. 01) (Table 4).
The source of variation that contributed most to the total variation was the environment (growing season and location) with an estimated R2
f of 18.14%.
This marked contribution of the environment to total variation was expected, since it comprised, as mentioned before, the effects of locations and growing seasons. In regional studies of the last 30 years with common bean, a marked variation in grain yield was observed in different growing seasons and at different locations (Ramalho et al. 1998, Bruzi et al. 2007, Matos et al. 2007, Sena et al. 2008).
In the different growing seasons and locations where the experiments were conducted there was great variation in the conditions of temperature and rainfall, in the “wet”, “dry” and winter / spring growing seasons. Of the environmental effect, one of the most important factors is temperature, which influences the duration of the phenological phases, as well as determining grain yield since it influences the abortion of flowers, pods and grains (Didonet and Silva 2004). Water is also a limiting factor for the crop. Therefore, all experiments in the dry and winter/ spring growing seasons were irrigated. Another noteworthy factor is soil fertility. The fertility of the soils of the different experiments differed (Table 2).
Source of variation df MS R2
f (%) Pr >F
Rep./exper. 96 422433.664 4.07 0.0001
Lines (L) 10 2010630.740 2.02 0.0001
Density (D) 2 7719037.198 1.55 0.0001
Fertilizer (F) 2 31469375.038 6.32 0.0001
Env. (season and location) (E) 5 36145275.419 18.14 0.0001
L x D 20 337837.443 0.68 0.0166
L x F 20 588892.152 1.18 0.0001
L x E 50 1301044.429 6.53 0.0001
D x F 4 8444857.470 3.39 0.0001
D x E 10 5408438.549 5.43 0.0001
F x E 10 4417675.745 4.43 0.0001
L x D x F 40 436133.202 1.75 0.0001
L x D x E 100 455579.334 4.57 0.0001
L x F x E 100 574348.371 5.76 0.0001
D x F x E 14 7237862.900 10.17 0.0001
L x D x F x E 140 423299.391 5.95 0.0001
Error 960 187475.524 18.06
-CV (%) 17.67
Mean (kg ha-1) 2449
Table 4. Combined analysis of variance of grain yield (Kg ha-1) of 11 common bean lines with different growth habits, in six environments (locations and growing seasons), three fertilizer rates and three sowing densities and the estimated relative contribution to the total sum of squares (R2
The contribution of the source plant densities (D) to the total sum of squares was only 1.55% and the interaction density x lines was 0.68% (Table 4). However, the contribution to the total sum of squares of the source of variation of fertilizer rates (F) was four times higher than of plant densities, indicating that in the mean, variations in fertilizer rates affect the grain yield of lines more than variations in sowing densities.
The interactions involving both the fertilizer rates as well as sowing densities were significant, indicating that the performances of lines in different densities or under different fertilizer rates were not coincident (Table 4). This information is essential for research of this nature. It shows that prior to the recommendation of a cultivar, it would be important to test different management systems (sowing densities and fertilizer rates) in the VCU trials, aside from the locations and growing seasons already required by the MAPA (Brazil 1998).
When choosing the lines to be used here, the most relevant trait was the growth habit. The objective was to compare cultivars with type I, II and III growth habit in different management systems and environments. The reason is that improvement programs have focused on the breeding of cultivars with erect, type I or type II growth habit, in view of to the numerous benefits, particularly compared to type III, such as: greater ease in cultural treatments; lower losses in case of rain during the harvest, lower disease incidence due to an improved aeration of the crop, and others (Collicchio et al. 1997, Cunha et al. 2005, Menezes Junior et al. 2008). However, it has been found that the yield potential cultivars of plants with this architecture may be lower (Didonet and Silva 2004). An alternative to improve this performance could be to increase the plant population and/or quantity of fertilizers, as verified by some authors in other conditions (Souza et al. 2003, Souza et al. 2008). However, the results showed that it is not possible to generalize recommendations, in other words, the response of the lines to higher planting densities and fertilizer rates varies according to the environment and is independent of the growth habit. This is most likely due to the marked interaction of lines with all other sources of variation, as pointed out above.
In the combined analysis (Table 4), considering all interactions, R2
f was 49.84%, evidencing a high
contribution to the total sum of squares. In view of the
foregoing, it is clear that the line response is influenced by the environment (growing season and location), apart from the fertilizer rates and sowing densities. As mentioned above, this makes the interpretation of results and, consequently, the identification of the lines most adapted to the different conditions rather difficult. One way to mitigate the genotype-environment interaction to increase the reliability in cultivar recommendations, is the identification of most adapted and stable lines. Several methods have been proposed (Cruz and Carneiro 2003) for this purpose and have been widely used in the cultivation of common bean (Nunes et al. 2005, Bruzi et al. 2007, Matos et al. 2007, Sena et al. 2008). In principle, the methodology to be used should be the most easily analyzable and, particularly, most easily interpretable. For these reasons, the graphical method was chosen (Nunes et al. 2005). This method uses the coefficient of variation to identify the most stable line, although in the original study the CVzi values
had not been compared. The confidence interval of CVzi
was therefore estimated to compare these estimates in this study.
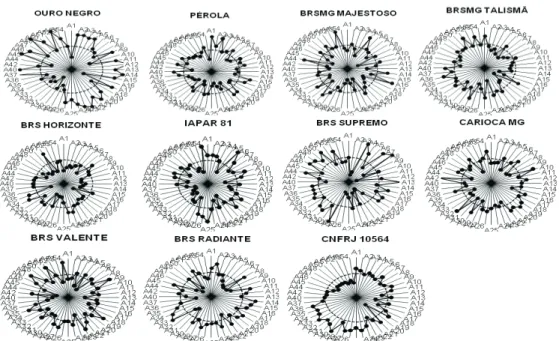
The line Ouro Negro, with the highest estimate, was the most adapted (Table 5). In terms of stability, due to the overlapping estimates of confidence intervals of CVzi it was not possible to detect differences
between lines. However, in 32 of the 48 experiments the yield of ‘Ouro Negro ‘ was equal to or above the mean, and even in the 16 experiments in which the performance was lower, the cultivar was more productive than others with worse performance (Figure 1). The CVzi should therefore be interpreted with caution and along with the graphical analysis, since the reason for a high CVzi
or instability of a line could be the fact that the yield is far above the mean in some environments.
Another criterion that has also been widely used by breeders to identify the most promising lines is the estimated risk of use, based on the methodology proposed by Annicchiarico (1992). To study the adaptability and stability of the lines in 48 experiments, in addition to the methodology proposed by Nunes et al. (2005), the risk of use of lines was therefore also estimated. This methodology showed that the risk use was lowest for Ouro Negro, since in the worst case, with 75% probability, the yield would be 3.97% below the mean of the environment. The low risk of use of line CNFRJ 10564, Ii= 92.92%, is also emphasized. A
Negro and CNFRJ 10564 shows that in 32 and 29 of the 48 experiments, respectively, these lines had yields above the environmental mean (Figure 1), in agreement with the confidence index.
All lines, except CNFRJ 10564 with striped grains, are already recommended for planting (Ramalho and Abreu 2006). The good performance of cultivar Ouro Negro observed by other authors was confirmed (Borges et al. 2000, Nunes et al. 2005), although it has the disadvantage of a very prostrate growth habit. The
analysis in 48 trials (Table 5) indicated the lines BRSMG Talismã and Carioca MG with carioca grain as high-performing. The growth of Carioca MG is upright, but the grain size below consumer standards and the beige color is darker (Ramalho and Abreu 2006). On the other hand, the market acceptance of color and grain size of BRSMG Talismã is satisfactory, despite the prostrate growth habit. Besides, it also stood out with good grain yields in the VCU trials in the state of Minas Gerais (Abreu et al. 2004).
Lines Mean Ii CVzi(%)
Ouro Negro 2740a* 96.03 3.67a* 33.2 (27.2;42.8)1/
Pérola 2407c 88.36 2.91c 27.8 (22.9;35.5)
BRSMG Majestoso 2333c 82.19 2.76c 33.0 (27.0;42.5)
BRSMG Talismã 2373c 88.19 2.86c 25.4 (20.9;32.3)
BRS Horizonte 2247d 82.47 2.56d 29.5 (24.2;37.8)
IAPAR 81 2407c 86.12 2.89c 33.1 (27.1;42.7)
BRS Supremo 2507b 86.31 3.10b 40.1 (32.6;52.5)
Carioca MG 2473b 89.23 3.06b 26.7 (22.0;34.1)
BRS Valente 2473b 88.11 3.04b 28.9 (23.8;37.0)
BRS Radiante 2467b 88.50 3.00b 29.5 (24.2;37.8)
CNFRJ 10564 2520b 92.92 3.15b 26.0(21.4;33.1)
*Means followed by the same letter in a column belong to the same group in the test of Scott-Knott at 5% error probability 1/In brackets, the confidence interval of CV
zi
Table 5. Mean grain yield (Kg ha-1) of 11 common bean lines evaluated in 48 experiments, estimates of the standardized means ( ) and
of the coefficients of variation (CVzi) by the graphical method (Nunes et al. 2005) and the confidence index (Ii) as proposed by
Annichiarico (1992)
ACKNOWLEDGEMENTS
The authors wish to thank the staff of the b r e e d i n g p r o g r a m o f c o m m o n b e a n o f t h e
U n i v e r s i d a d e F e d e r a l d e L a v r a s ( U F L A ) , f o r assistance in the practical performance of the experiments and the Coordenação e Aperfeiçoamento de Pessoal de Nível Superior (CAPES) for funding.
Estratégias para recomendação de linhagens de
feijoeiro provenientes de VCU em diferentes ambientes
RESUMO - O presente trabalho foi conduzido visando desenvolver estratégias para a recomendação de cultivares de feijoeiro provenientes do VCU a partir da avaliação do desempenho de linhagens de diferentes hábitos de crescimento, em diferentes doses de fertilizantes e densidades de semeadura. Verificou-se que: a variação nas doses de fertilizantes afeta mais a produtividade de grãos das linhagens que a variação nas densidades de semeadura; a resposta das linhagens ao aumento da densidade de semeadura e doses de fertilizantes varia com o ambiente em que são avaliadas e independem do hábito de crescimento das mesmas; as interações envolvendo as doses de fertilizantes e densidades de semeadura foram expressivas, mostrando que é importante realizar os VCU em diferentes doses de fertilizantes e densidades de semeadura.
Palavras-chave: Phaseolus vulgaris L., interação genótipos x ambientes, estabilidade, doses de fertilizante, densidades de semeadura.
REFERENCES
Abreu AFB, Ramalho MAP, Carneiro JES, Gonçalves FMA, San-tos JB, Peloso MJD, Faria LC, Carneiro GES and Pereira Filho IA (2004) BRSMG talismã: common bean cultivar with c a r i o c a g r a i n t y p e . A n n u a l R e p o rt o f t h e B e a n
Improvement Cooperative 47: 319-320.
A n n i c c h i a r i c o P ( 1 9 9 2 ) C u l t i v a r a d a p t a t i o n a n d r e c o m m e n d a t i o n f r o m a l f a l f a t r i a l s i n N o r t h e r n I t a l y.
Journal of Genetics and Breeding 1: 269-278.
Borges LC, Ferreira DF, Abreu AFB and Ramalho MAP (2000) Emprego de metodologias de avaliação de estabilidade
fenotípica na cultura do feijoeiro. Revista Ceres 269:
89-1 0 2 .
Brasil. Ministério da Agricultura e do Abastecimento (2008)
Formulários para registro de cultivares e requisitos para VCU. Availables at http://www.agricultura.gov.br. Accessed in July 20, 2009.
Bruzi AT, Ramalho MAP and Ferreira DF (2007) Homeostasis o f c o m m o n b e a n p o p u l a t i o n s w i t h d i f f e r e n t g e n e t i c
structures. Crop Breeding and Applied Biotechnology
2: 111-116.
Collicchio E, Ramalho MAP and Abreu AFB (1997) Associação entre o porte da planta do feijoeiro e o tamanho dos grãos.
Pesquisa Agropecuária Brasileira 3: 297-304.
Cruz CD and Carneiro PCS (2003) Modelos biométricos
apli-cados ao melhoramento genético. UFV, Viçosa, 585p.
Cunha WG, Ramalho MAP and Abreu AFB (2005) Selection aiming at upright growth habit common bean with carioca
type grains. Crop Breeding and Applied Biotechnology
4: 379-386.
Didonet AD and Silva SC (2004) Elementos climáticos e
produ-tividade do feijoeiro. Informe Agropecuário 223: 13-20.
Matos JW, Ramalho MAP and Abreu AFB (2007) Trinta e dois anos do programa de melhoramento do feijoeiro em Minas
Gerais. Ciência e Agrotecnologia 6: 1749-1754.
Menezes Junior JAN, Ramalho MAP and Abreu AFB (2008) S e l e ç ã o r e c o r r e n t e p a r a t r ê s c a r a c t e r e s d o f e i j o e i r o .
Bragantia 67: 833-838.
Nunes JAR, Ramalho MAP and Abreu AFB (2005) Graphical method in studies of adaptability and stability of cultivars.
Annual Report of the Bean Improvement Cooperative
48: 182-183.
Ramalho MAP and Abreu AFB (2006) Cultivares. In Vieira C,
Paula Junior TJ and Borem A (Eds.) Feijão. 2. ed., Viçosa,
UFV, p. 415-436.
Ramalho MAP, Abreu AFB and Santos PSJ (1998) Interações genótipos x épocas de semeadura, anos e locais na avaliação de cultivares de feijão nas regiões sul e alto Paranaíba em
Minas Gerais. Ciência e Agrotecnologia 2: 176-181.
Scott AJ and Knott MAA (1974) cluster analyses method for
grouping means in the analyses of variance. Biometrics 3:
Sen a MR, Abreu AFB, Bruzi AT and Ramalho MAP (2008) Envolvimento de agricultores no processo seletivo de novas
li-nhagens de feijoeiro. Ciência e Agrotecnologia 2: 407-412.
Shimada M, Sá ME and Arf O (2000) Componentes do rendi-mento e desenvolvirendi-mento do feijoeiro comum de porte
ere-to sob diferentes densidades populacionais. Bragantia 59:
181-187.
Souza AB, Andrade MJB and Muniz RP (2003) Altura de planta e componentes do rendimento do feijoeiro em função de
populações de plantas, adubação e calagem. Ciência e
Agrotecnologia 6: 1205-1213.
Souza AB, Andrade MJB, Vieira NMB and Albuquerque A (2008) Densidades de semeadura e níveis de NPK e calagem na produção do feijoeiro sob plantio convencional, em P o n t a G r o s s a , P a r a n á . P e s q u i s a A g ro p e c u á r i a Tro p i -cal 1: 39-43.
Stone LF and Pereira AL (1994) Sucessão arroz-feijão irrigados por aspersão. Efeitos de espaçamentos entre linhas, aduba-ção e cultivar na produtividade e nutriaduba-ção do feijoeiro
co-mum. Pesquisa Agropecuária Brasileira 29: 521-533.
Vangel MG (1996) Confidence intervals for a normal coefficient