Article
J. Braz. Chem. Soc., Vol. 27, No. 2, 363-371, 2016. Printed in Brazil - ©2016 Sociedade Brasileira de Química 0103 - 5053 $6.00+0.00
A
*e-mail: [email protected]
Cellulose Nanocrystals Assembled on the Fe
3O
4Surface as Precursor to Prepare
Interfaced C/Fe
3O
4Composites for the Oxidation of Aqueous Sulfide
Igor T. Cunha,a Ivo F. Teixeira,b João P. Mesquita,c José D. Ardisson,d Ildefonso Binatti,e
Fabiano V. Pereiraa and Rochel M. Lago*,a
aDepartamento de Química, Universidade Federal de Minas Gerais,
31270-901 Belo Horizonte-MG, Brazil
bDepartment of Chemistry, University of Oxford, OX12JA Oxford, United Kingdom
cDepartamento de Química, Campus II, Universidade Federal dos Vales do Jequitinhonha e Mucuri,
39100-000 Diamantina-MG, Brazil
dLaboratório de Física Aplicada, CDTN, 31270-901 Belo Horizonte-MG, Brazil
eCentro Federal de Educação Tecnológica de Minas Gerais, 30421-169 Belo Horizonte-MG, Brazil
In this work, composites based on carbon (1, 10 and 20 wt.%) interfaced with Fe3O4
(magnetite) have been studied as catalysts for the oxidation of aqueous sulfide. The composites were prepared by assembling cellulose nanocrystals surrounding Fe3O4 followed by a controlled
thermal decomposition at 400, 600 and 800 oC. Mössbauer, X-ray diffractometry (XRD), Raman,
thermogravimetry (TG), elemental analysis CHN, scanning electron microscopy (SEM/EDS), Fourier transform infrared spectroscopy (FTIR) and potentiometric titration indicated that at 400 and 600 oC the cellulose nanocrystals decompose to different carbon forms, i.e., films, filaments
and particles attached to the Fe3O4 crystals. At higher temperature, i.e., 800 oC, this carbon on
the magnetite surface further reacted to produce Fe0. UV-Vis, Raman and electrospray ionization
mass spectrometry (ESI-MS) measurements showed that these composites catalyze the oxidation of aqueous sulfide to convert S2−
aq to polysulfides Sn2− (where n = 2-9) and also oxygen containing
polysulfides HOSn−. Simple kinetic experiments showed very low sulfide oxidation activities for
pure Fe3O4 and pure carbon. On the other hand, the composites, especially with 10% C obtained
at 600 oC, were remarkably active. These results are discussed in terms of a possible participation
of oxygen based redox groups present on the carbon surface and an electron transfer from the carbon to the Fe3O4 phase.
Keywords: magnetite, cellulose nanocrystal, whisker, sulfide oxidation, polysulfide
Introduction
Sulfide in industry is commonly found as H2S and
for a variety of reasons, e.g., aesthetics (odor control),1
health (toxicity), ecological (oxygen depletion in receiving waters),2,3 and economic (corrosion of equipment and
infrastructure),4 there is a considerable interest to eliminate
sulfide from wastewaters.5
The removal of hydrogen sulfide has been studied by different processes, among them sulfide oxidation is one of the most explored. Catalytic oxidation of H2S using air
is applied using different catalysts, i.e., vanadium,6 iron
oxides.7 The oxidation of H
2S is also being investigated
using hydrogen peroxide and MoVI based catalysts.8
Regarding the oxidation of aqueous sulfide, studies have been exploring the utilization of activated carbons9 and
modified carbon based materials such as graphite and graphene.10
Microorganisms showed potential to oxidize sulfide into different sulfur-containing species, e.g., elemental sulfur, polysulfides, thiosulfate, thionates and sulfate in aqueous medium.11-13 Some of these bacteria were
Wolinella succinogenes,14 Rhodobacter capsulatus,
Pelodictyon luteolum, and Chlorobium.15 The ability of
reductase enzyme.16,17 The activity of this enzyme is due to
the presence of quinone redox groups and a facile electron transportation system.
Based on these features a new family of more active and robust catalysts was developed using different forms of carbon such as activated carbon,9 graphite and graphene.10
These carbons possess relatively high area and chemically stable surface, which can be functionalized with redox quinone groups. Moreover, the graphene like structures present in these carbons play an important role due to the electron conduction during sulfide oxidation.9,10
It has also been developed active inorganic catalysts based on ferrites MFe2O4 (M = Cu, Co) which combines
surface redox groups (Cu2+/Cu+, Fe3+/Fe2+, Co3+/Co2+)18 and
an electron conducting structure.18
In this work, it was developed a novel catalyst based on the combination of carbon structures containing active oxygen surface redox groups interfaced with Fe3O4, which
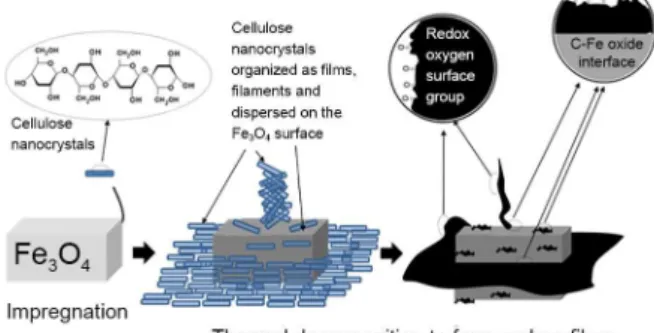
is an excellent electron conducting oxide. These composite catalysts have been prepared by the impregnation of cellulose nanocrystals (CNC) on the magnetite surface. Some of the potential features of this system are: (i) the
cellulose nanocrystals should interact well with the Fe3O4
surface via H-bonding to produce a good dispersion and interface; (ii) the cellulose nanocrystals can assemble
around the Fe3O4 particles to form sheets, filaments and
isolated particles which upon thermal decomposition will produce different forms of carbons, i.e., films, filaments and nanoparticles; (iii) these carbon structures should have
a high exposed surface with high concentration of oxygen surface groups (Figure 1).
This composite has several physico-chemical properties that can potentially promote aqueous sulfide oxidation, especially the carbon structures with high exposed surface, which can act as catalytic sites where quinone redox groups remove electrons from aqueous sulfide (S2−
aq). These
electrons can be transferred to Fe3O4 that has an excellent
redox couple based on Fe3+/Fe2+ especially at the octahedral
sites of the spinel structure. Moreover, Fe3O4 is a conductive
solid structure able to disperse the electrons received and finally the magnetic property of these composites allows a facile removal from the reaction medium by a simple magnetic process.
Experimental
The sulfuric acid hydrolysis reaction of eucalyptus kraft wood pulp was performed according to a procedure described elsewhere, with minor modifications.19,20
Briefly, 10 g of bleached cellulose pulp was added to 160 mL of 64 wt.% sulfuric acid under strong mechanical stirring. Hydrolysis reaction was performed at 55 °C for approximately 25 min.
After hydrolysis, the dispersion was diluted two-fold in water, and the dispersions were washed three times with deionized water by centrifugation. The last washing was conducted using dialysis against deionized water until the dispersion reached a pH of ca. 7. The dispersions were ultrasonicated with an Ultrasonic Processor Cole Parmer CPX750 equipped with a microtip and a stable suspension of CNC was obtained after sonication for approximately 1 min. The obtained aqueous suspension of CNC (ca. 1%, m/v) was freeze-dried to obtain a powder of the cellulose nanoparticles.
The compounds were synthesized by mixing 500 mg of a commercial magnetite (Synth, pretreated under N2
atmosphere at 900 ºC for 1 h) with different volumes (i.e., 5, 30 and 60 mL) of a cellulose nanocrystals suspension (10 g L-1) followed by evaporation under stirring. The
obtained solid was dried in an oven at 80 ºC for 6 h. The samples were then submitted to the following treatment: heating up to 400 ºC at 10 ºC min-1 under an atmosphere
of H2/N2 and after this temperature, the atmosphere was
changed to N2 and the temperature elevated up to 400,
600 or 800 ºC for 1 hour. The catalysts were characterized by X-ray diffraction (Geigerflex Rigaku diffractometer (Cu Kα radiation)), transmission 57Fe Mössbauer (at 25 K
on a constant acceleration transducer with a 57Co/Rh source,
the Normos least-square fits was employed to calculate the spectral hyperfine parameters), thermogravimetry (TG, DTG-60 Shimadzu in atmosphere of air), Raman (Bruker 100 FT-FRS-Raman, 785 nm, 2 mW laser), Fourier transform infrared spectroscopy (FTIR) spectra of materials were obtained in a Nicolet 380 FT-IR spectrometer (Nicolet, MN), potentiometric titration curves were obtained with a Metrohm 670 automatic titrator, and scanning electron microscopy with energy-dispersive X-ray spectroscopy
Figure 1. Schematic representation of the preparation of carbon structures by the impregnation and assembling of cellulose nanocrystals in Fe3O4
SEM/EDS (Jeol JSM 840A and a Quanta 200 ESEM FEG from FEI).
The sulfide oxidation studies were performed using 20 mg of sample in 3 mL of Na2S.9H2O (8 g L-1)
solution in water. The reaction was carried out at room temperature (25 ºC) under manual homogenization. During the experiments, the reaction solution was collected at different times and the formation of polysulfides was monitored by measuring the absorbance of the aqueous solution at different wavelengths using a Shimadzu UV-2550 Spectrometer. The final solution obtained after oxidation was also characterized by Raman (Bruker 100 FT-FRS-Raman, 785 nm, 2 mW laser) and paper spray mass spectrometry (ThermoElectron LCQFleet operating in the negative ion mode).
Results and Discussion
The catalysts have been prepared by the impregnation of Fe3O4 (magnetite) with different cellulose nanocrystal
contents. The CNCs/Fe3O4 composites were then thermally
treated to decompose the CNC to carbon on the Fe3O4
surface.21 The CNC contents were adjusted to produce carbon
concentrations of approximately 1, 10 and 20 wt.%. All the composites were treated at 600 oC and only the composite
with 10% carbon was treated at 400, 600 and 800 oC.
Raman spectra (Supplementary Information) of these samples showed the typical carbon D and G bands, related to defective less organized carbon (at ca. 1300 cm-1)
and more organized graphitic carbon (at ca. 1550 cm-1),
respectively.
The disorganized structure of the carbon in the surface of the composites is evident by the comparison of the band D (1350 cm-1) and band G (1500-1600 cm-1), where the
relative intensity of the band D is higher than the band G. Most of the materials presented bands related to magnetite, but the composite MW6001 showed bands of maghemite,
likely due to oxidation processes promoted by the laser during Raman analysis.22 In addition, in the material
MW80010 the magnetite bands are not present, considering
that Fe0 constitutes most of this material.
FTIR analyses of pure CNC treated at different temperatures (see Supplementary Information section) suggest that up to 400 °C, the obtained carbons have relatively large concentrations of oxygenated functional groups, e.g., intense bands at ca. 1100, 1700 and 3400 cm-1 characteristics of νC−O, νC=O and νO−H.23,24
At temperatures higher than 600 °C these bands strongly decreased in intensity indicating a significant decrease in the concentration of the oxygen containing groups. Potentiometric titration of these carbons (see Supplementary
Information section) confirmed that oxygen surface groups with different pKa are decomposed, especially when the treatment temperature increased above 600 oC.
In Table S1 are shown the concentration of oxygenated functional acid groups determined with potentiometric titration. In general the results are in agreement with the FTIR spectra. The increase in pyrolysis temperature significantly decreases the total acidic functional groups. In addition from 400 ºC occurs the removal of the functional groups with pKa < 5 mainly attributed to the carboxylic functional groups.25,26
The C contents were determined by TG (Supplementary Information) in air and also elemental analyses CHN with the obtained values in the range 0.5-1, 9-10 and 20-22 wt.%. These catalysts are named hereon as, e.g., MW80010
(M = magnetite, W = whysker, temperature = 800 oC,
10 wt.% of carbon content).
The samples MW6001, MW60010 and MW60020 showed a
similar decomposition pattern, showing a slightly increase in their mass between 300 and 400 ºC due to the oxidation the Fe3O4 to γ-Fe2O3, and between 400 and 550 ºC a weight
loss which is related to the oxidation of carbon.27 In the
sample MW40010, the carbon oxidation was observed in lower
temperature, between 300 and 400 ºC. On the other hand, for the sample MW80010, it was not observed mass loss, possibly
because the small amount of remaining carbon, as evidenced by CHN elemental analysis. In addition, the results obtained in the thermogravimetry were also relevant to estimate the amount of carbon in the samples.
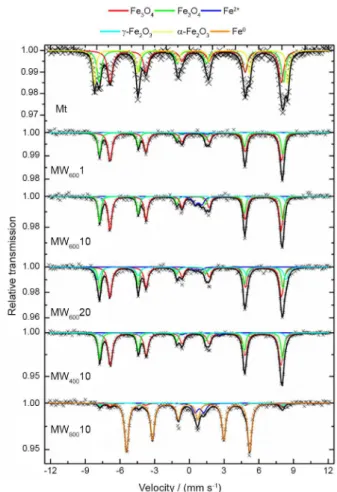
The effect of composite with 10% carbon was used to investigate the effect of temperature treated obtained composite were analyzed by Mössbauer spectroscopy at 25 K in order to identify the Fe phases (Figure 2) (see also Supplementary Information section for the hyperfine parameters).
The commercial sample Mt treated at 900 ºC in N2
showed the typical hyperfine parameters of magnetite, but with the presence of significant amounts of hematite
α-Fe2O3 contamination (approximately 25% spectral area)
due to the natural oxidation of the magnetite in air. For this reason all the materials were prepared by an initial treatment with H2/N2 at 400 ºC which reduces all the Fe2O3
phases (hematite and maghemite) to magnetite.28
The iron phase compositions obtained by Mössbauer are presented in Figures 3 and 4.
The obtained results showed that the treatment at 400 oC produced 95% Fe
3O4 and a new phase ca. 5%
γ-Fe2O3 (maghemite). Several previous works showed
that the formation of maghemite typically takes place by the reduction of hematite α-Fe2O3 to Fe3O4 and/or
FeO by H2, or the volatile reducing molecules (e.g., CO,
At 800 oC, the Fe oxides are further reduced mainly
to Fe0, likely by the simplified reaction with carbon or H 2
(equation 2).
Fe3O4/FeO + C/H2→ Fe0 + COx/H2O (2)
All these reactions are well known and they have been observed in different systems based on iron oxides with several organic matrices and reducing agents, such as carbon,28 ethanol,33 methane,31 tar pitch,29 bio-oil,30 using
techniques such as Mössbauer, XRD and magnetization measurementes.34
Mössbauer spectra for the samples MW600 with 1, 10 and
20% carbon showed that as the carbon content increased in the composite, the relative concentration of the oxidized phase γ-Fe2O3 also increased. Although the reason for this
effect is not clear, it could be related to the oxidation of Fe3O4 by CO2 and H2O formed during the decomposition of
cellulose. As the cellulose content increased in the samples MW6001, MW60010 and MW60020, the amount of CO2 and
H2O formed during pyrolysis also increased oxidizing Fe3O4
in larger extension as shown in Figure 4.
This is likely related to more extensive reaction of Fe2O3. The XRD results confirm the data obtained by
Mössbauer spectroscopy (Figure 5).
The prevalence of the spinel phase of Fe3O4
(JCPDF 19-629) is observed in the diffraction patterns obtained for the samples Mt, MW6001, MW40010, MW60010
and MW60020. The presence of Fe0 (JCPDF 1-1267) in
MW80010 sample was also confirmed with the obtained
diffraction pattern. The samples presented intense and well-defined peaks, indicating a higher crystallinity.
SEM images showed that the magnetite phase is present as fairly well defined crystal with flat surface (Figure 6). When carbon is present at 1 and especially 10%, the magnetite particles can still be identified, however, completely surrounded by new forms similar to thin films and nanofilaments, likely due to the carbon formed from the cellulose nanocrystals. This morphology
Figure 2. Mössbauer spectra (at 25 K) for Mt (magnetite), MW6001,
MW40010, MW60010, MW80010 and MW60020. In red the octahedral sites
and in green the tetrahedral sites.
Figure 3. Iron phase compositions determined by Mössbauer spectroscopy for the Fe3O4 precursor and for the composites MW with 10% carbon
treated at 400, 600 and 800 oC.
Figure 4. Iron phase compositions determined by Mössbauer spectroscopy for the composites MW6001, MW60010 and MW60020.
decomposition of cellulose.28-33 The more reactive phases
Fe3O4 and/or FeO are oxidized by air at room temperature
to produce γ-Fe2O3.
Upon treatment at 600 oC, a significant concentration of
Fe2+ is observed likely due to the partial reduction of Fe 3O4
by superficial carbon or H2, equation 1.
Fe3O4 + C/H2→ Fe2+ (e.g., FeO highly dispersed) +
is typically observed in carbon CNC prepared at 600 °C (Supplementary Information).
On the other hand, at 20% carbon many magnetite particles seem to be encapsulated and the presence of bulky carbon can be clearly observed.
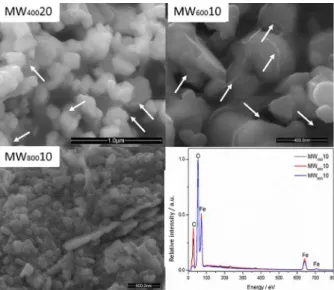
Figure 7 shows that treatments of the composites at 400 and 600 ºC did not cause significant modification of the magnetite particle morphology. On the other hand, treatment at 800 ºC completely changed the magnetite crystals into a more compacted sintered agglomerated particles due to the reduction to Fe0. EDS spectra
obtained for these samples showed the expected signals for Fe, O and C. It is interesting to see that the relatively intensity of the carbon signal strongly decreased for the composite MW80010 suggesting that the relative
concentration of carbon in this sample decreased. In fact,
CHN and TG results showed carbon contents of 9-11% for the composites MW40010 and MW60010 whereas
only < 1% carbon was detected for MW80010. This result
confirms the Mössbauer and XRD data, which showed that Fe3O4 is reduced to Fe0 by the carbon present in the
composite.
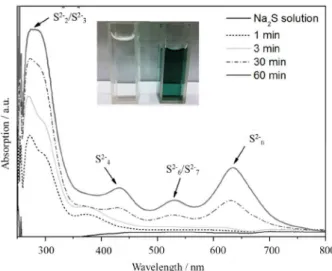
The obtained compounds were tested for oxidation of aqueous sulfide. The non-colored sulfide solution became blue in the presence of the catalysts. The UV-Vis spectra (Figure 8) of the sulfide solution gradually showed characteristic bands for small polysulfides species, such as S22− (270 nm), S32− (300 nm), S42− (370 nm),35
and other polysulfides with chains reaching S92−.36-38
These polysulfides with longer chains are likely responsible for the green/blue color of the solution (detail Figure 8).39
These different polysulfides were also identified in a typical Raman spectrum obtained in aqueous medium (Figure 9).
The obtained spectra obtained in aqueous medium showed in general bands with low intensity related to disulfides (S22−) at 117 and 164 cm-1,40,41 trisulfides 322 cm-1
(S−S−S−H),42 578 and 646 cm-1.43 It was also identified the
presence of S42− at 78 cm-1 42 and 360 cm-1.43 Moreover, the
band at 78 cm-1 may also be related to S
62− and the bands
at 58 and 288 cm-1 to S 72−.43
The identification of the products during the oxidation of the sodium sulfide was also carried out using paper spray mass spectrometry (PS-MS) in the negative mode.44 The
spectrum obtained (Figure 10) suggests the presence of polysulfides and other oxygenated sulfur species.
Figure 5. XRD for the samples Mt, and the composites MW6001, MW40010,
MW60010, MW80010 and MW60020.
Figure 6. SEM images of pure magnetite and the composites MW600 with
10 and 20% carbon.
Figure 7. SEM images for the composites MW40010, MW60010 and
MW80010 and a comparison of the EDS spectra obtained for each
These results corroborate the UV-Vis and Raman spectra with the presence of ions with 2 to 7 sulfur atoms compounds. In addition, different oxidized polysulfides species were observed associated with Na+.
Additional optimizations are under investigation, aiming
to obtain best conditions for data acquisition and ion’s identification.
UV monitoring of the most intense band at 270 nm related to the first specie formed S22− was used to investigate
the kinetic and catalysts efficiency. Figure 11 shows that pure magnetite does not have a significant activity for sulfide oxidation.
It can also be observed that the pure carbon obtained by pyrolysis of the cellulose nanocrystals (without Fe3O4)
at 600 oC showed a very low catalytic activity. On the
other hand, the use of the composites based on Fe3O4 with
10% carbon showed much higher activities. Treatment at 400 oC (MW
40010) produced a significant increase in
the activity for sulfide oxidation. However, treatment at 600 oC showed a remarkable increase on the sulfide
oxidation whereas at 800 oC a strong loss of activity was
observed.
The effect of the carbon content was investigated for the series obtained at 600 oC, i.e., MW
6001, MW60010 and
MW60020 (Figure 12).
It can be observed again that all the composites are more active than the pure Fe3O4 and pure carbon obtained
at 600 oC. As the carbon content increased from 1 to 10%
the oxidation activity strongly increased. On the other hand, when the carbon content increased from 10 to 20% a strong decrease in the catalytic activity was observed, likely due to an extensive coating and even encapsulation of the Fe3O4
particles as it was observed by SEM.
It was monitored the UV-Vis band intensities for the different Sn2− species (see Supplementary Information
section). It was observed that the species S22− and S32−
with higher intensities gradually increased and tending to remain constant after 30 min of reaction. The specie S42−
with a less intense absorption showed similar behavior.
Figure 8. UV-Vis spectra evolution during the sulfide oxidation in the
presence of MW6001 (UV-Vis spectra for the other catalysts not shown).
Figure 9. Raman spectrum obtained for the solution from after sulfide
oxidation.
Figure 10. Mass spectrum of the resulting solution of the reaction between the composite MW6001 and sodium sulfide solution obtained in negative
mode of PS-MS.
The higher polysulfides together showed a continuous increase in intensity. These results do not indicate that the polysulfides are formed sequentially, e.g., S32− is formed
from S22−. Apparently, these polysulfides are formed
simultaneously on the catalyst surface and once released to the surface they are not converted significantly to the higher polysulfides.
These results clearly showed that the composite combining carbon and Fe3O4, especially MW60010, is
much more active for sulfide oxidation compared to the isolated phases.
Although the nature of this higher activity is not clear, previous works indicated that for the sulfide oxidation two features are very important in the catalyst, i.e., the presence of surface redox groups and electron transfer properties.9,10
The high activity observed for carbon based materials, i.e., activated carbon, graphite and graphene,9,10 was related
to the presence of redox groups, e.g., quinone, that can easily oxidize sulfide. Moreover, it was also suggested that the electron conductivity was important for the sulfide oxidation activity. These effects of redox surface groups and electron conductivity were also discussed in recent work on ferrites (MFe2O4 where M = Co, Cu) as catalyst
for sulfide oxidation.18
The higher activity observed for the composite MW60010
could be related to a synergic combination of the properties of carbon and magnetite, which are described below.
The carbon surface obtained at 600 oC should have
oxygen based redox groups, e.g., quinone, since these groups have been observed in previous work and indicated by FTIR and potentiometric titration in this work. These redox groups can be reduced by sulfide according to a simplified reaction, equation 3.
Carbon−C=Osurf + S2−aq→ Carbon−C−O−/S−surf (3)
These reduced groups, e.g., hydroquinones, should transfer electrons to regenerate and continue the catalytic cycle. One possible pathway is to transfer these electrons to magnetite, which can be easily accommodated by structural Fe3+ species producing Fe2+, equation 4.
(Fe2+) (Fe3+)
2O4 + e− → (Fe2+)1 + x (Fe3+)2 - xO4 (4)
Considering this electron transfer process, the interface carbon/Fe3O4 is very important for the reaction. Although
there is no direct evidence of the carbon/Fe3O4 interface,
the data shown in this work suggest that after the cellulose decomposition, the carbon formed will react with the Fe3O4
surface at 600 oC likely to form an interface.
After the electron is transferred to magnetite, the Fe2+
species produced should then transfer those electrons to the reaction medium. Although the destination of these electrons is not clear, some possible reactions are the reduction of H2O
or O2 which are well known to take place by Fe2+ present in
the oxide structures (equations 5 and 6).45-48
2 H2O + 2e−→ H2 + 2 OH− (5)
½ O2 + H2O + 2 e−→ 2 OH− (6)
It is interesting to observe that the composite treated at 800 oC showed low activity for sulfide oxidation. This
decrease on the activity is likely due to the conversion of the Fe3O4 to the metallic phase and also to the decomposition
of the oxygen surface groups present in the carbon structure (see FTIR and titration data on Table S1 in Supplementary Information section).
A hypothetical mechanism taking into account all these effects can be proposed (Figure 13).
In this mechanism, the sulfide reacts with oxygen redox groups on the carbon surface and the electrons are transferred
Figure 12. Sulfide oxidation monitored by the band at 270 nm with the catalysts with different carbon contents.
Figure 13. Schematic representation of a mechanism proposal for the
via an interface to the magnetite structure reducing a Fe3+
species to Fe2+. Details of the reaction mechanism are
under investigation using X-ray photoelectron spectroscopy (XPS), cyclic voltammetry and electron paramagnetic resonance (EPR) measurements in different systems based on graphene and carbon nanotubes with iron oxides films.
Conclusions
Cellulose nanocrystal can be combined by assembling cellulose nanocrystals surrounding Fe3O4 followed by a
controlled thermal decomposition. The obtained results indicated that at 400 and 600 oC the cellulose nanocrystals
decompose to form carbon films, filaments and particles attached to the Fe3O4 crystals. These C interfaced with
Fe3O4 composites catalyze the oxidation of aqueous
sulfide to convert S2−
aq to polysulfides Sn2− (where n = 2-9)
and also oxygen containing polysulfides HOSn−. Simple
kinetic experiments showed that the composites, especially with 10% C obtained at 600 oC, were remarkably active.
Although the nature of this synergic effect is not clear, a possible operational mechanism involves the participation of oxygen based redox groups present on the carbon surface and an electron transfer from the carbon to the Fe3O4 phase.
Moreover, these magnetic materials can be easily separated from the reaction medium by a simple magnetic process, which is a very interesting technological advantage.
Supplementary Information
The Supplementary Information (hyperfine parameters, Raman spectra and thermal decomposition of the catalysts) is available free of charge at http://jbcs.sbq.org.br as a PDF file.
Acknowledgements
The authors acknowledge the support of Petrobras, FAPEMIG, PRPq/UFMG, CNPq and CAPES. Thanks for the SEM/EDS provided by the UFMG Microscopy Center.
References
1. Burgess, J. E.; Parsons, S. A.; Stuetz, R. M.; Biotechnol. Adv.
2001, 19, 35.
2. Tchobanoglous, G.; Burton, F. L.; Stensel, H. D.; Wastewater Engineering: Treatment and Reuse; McGraw-Hill Science/ Engineering/Math: New York, 2003.
3. Llansó, R. J.; J. Exp. Mar. Biol. Ecol. 1991, 153, 165. 4. Wiener, M. S.; Salas, B. V.; Quintero-Núñez, M.; Zlatev, R.;
Corros. Eng., Sci. Technol. 2006, 41, 221.
5. Zhang, L.; de Schryver, P.; de Gusseme, B.; de Muynck, W.; Boon, N.; Verstraete, W.; Water Res. 2008, 42, 1.
6. León, M.; Jiménez-Jiménez, J.; Jiménez-López, A.; Rodríguez-Castellón, E.; Soriano, D.; López Nieto, J. M.; Solid State Sci.
2010, 12, 996.
7. Kapse, V. D.; Ghosh, S. A.; Raghuwanshi, F. C.; Kapse, S. D.;
Mater. Chem. Phys. 2009, 113, 638.
8. Jeyakumar, K.; Chakravarthy, R. D.; Chand, D. K.; Catal. Commun. 2009, 10, 1948.
9. Lemos, B. R. S.; Teixeira, I. F.; de Mesquita, J. P.; Ribeiro, R. R.; Donnici, C. L.; Lago, R. M.; Carbon 2012, 50, 1386. 10. Lemos, B. R. S.; Teixeira, I. F.; Machado, B. F.; Alves, M. R. A.;
de Mesquita, J. P.; Ribeiro, R. R.; Bacsa, R. R.; Serp, P.; Lago, R. M.; J. Mater. Chem. A 2013, 1, 9491.
11. Vairavamurthy, A.; Manowitz, B.; Zhou, W. Q.; Jeon, Y. S. In Environmental Geochemistry of Sulfide Oxidation (Determination of Hydrogen-Sulfide Oxidation-Products
by Sulfur K-Edge X-ray-Absorption Near-Edge Structure
spectroscopy); Alpers, C. N.; Blowes, D. W., eds.; Wiley-VCH: Weinheim, Germany, 1994, ch. 7, pp. 412.
12. Hoffmann, M. R.; Lim, B. C.; Environ. Sci. Technol. 1979, 13, 1406.
13. Weres, O.; Tsao, L.; Chhatre, R. M.; Corrosion 1985, 41, 307. 14. Macy, J.; Schröder, I.; Thauer, R.; Kröger, A.; Arch. Microbiol.
1986, 144, 147.
15. Henshaw, P. F.; Zhu, W.; Water Res. 2001, 35, 3605.
16. Friedrich, C. G.; Rother, D.; Bardischewsky, F.; Quentmeier, A.; Fischer, J.; Appl. Environ. Microbiol. 2001, 67, 2873.
17. Schutz, M.; Klughammer, C.; Griesbeck, C.; Quentmeier, A.; Friedrich, C. G.; Hauska, G.; Arch. Microbiol. 1998, 170, 353.
18. Cunha, I. T.; Teixeira, I. F.; Albuquerque, A. S.; Ardisson, J. D.; Macedo, W. A. A.; Oliveira, H. S.; Tristao, J. C.; Sapag, K.; Lago, R. M.; Catal. Today, in press,DOI: 10.1016/j. cattod.2015.07.023.
19. de Rodriguez, N. L. G.; Thielemans, W.; Dufresne, A.; Cellulose
2006, 13, 261.
20. Brito, B. L.; Pereira, F.; Putaux, J.-L.; Jean, B.; Cellulose 2012,
19, 1527.
21. de Mesquita, J. P.; Reis, L. S.; Purceno, A. D.; Donnici, C. L.; Lago, R. M.; Pereira, F. V.; J. Chem. Technol. Biotechnol. 2013,
88, 1130.
22. Shebanova, O. N.; Lazor, P.; J. Raman Spectrosc. 2003, 34, 845.
23. Kundu, S.; Wang, Y.; Xia, W.; Muhler, M.; J. Phys. Chem. C
2008, 112, 16869.
24. Haydar, S.; Moreno-Castilla, C.; Ferro-García, M. A.; Carrasco-Marín, F.; Rivera-Utrilla, J.; Perrard, A.; Joly, J. P.; Carbon
2000, 38, 1297.
25. Gorgulho, H. F.; Mesquita, J. P.; Gonçalves, F.; Pereira, M. F. R.; Figueiredo, J. L.; Carbon 2008, 46, 1544.
27. Teixeira, I. F.; Medeiros, T. P. V.; Freitas, P. E.; Rosmaninho, M. G.; Ardisson, J. D.; Lago, R. M.; Fuel 2014, 124, 7.
28. Pereira, M. C.; Coelho, F. S.; Nascentes, C. C.; Fabris, J. D.; Araújo, M. H.; Sapag, K.; Oliveira, L. C. A.; Lago, R. M.;
Chemosphere 2010, 81, 7.
29. Amorim, C. C.; Leão, M. M. D.; Dutra, P. R.; Tristão, J. C.; Magalhães, F.; Lago, R. M.; Chemosphere 2014, 109, 143. 30. Karimi, E.; Teixeira, I. F.; Gomez, A.; de Resende, E.;
Gissane, C.; Leitch, J.; Jollet, V.; Aigner, I.; Berruti, F.; Briens, C.; Fransham, P.; Hoff, B.; Schrier, N.; Lago, R. M.; Kycia, S. W.; Heck, R.; Schlaf, M.; Appl. Catal., B 2014, 145, 187.
31. Oliveira, P. E. F.; Ribeiro, L. P.; Rosmaninho, M. G.; Ardisson, J. D.; Dias, A.; Oliveira, L. C. A.; Lago, R. M.; Catal. Commun.
2013, 32, 58.
32. Amorim, C. C.; Dutra, P. R.; Leão, M. M. D.; Pereira, M. C.; Henriques, A. B.; Fabris, J. D.; Lago, R. M.; Chem. Eng. J.
2012, 209, 645.
33. Rosmaninho, M. G.; Moura, F. C. C.; Souza, L. R.; Nogueira, R. K.; Gomes, G. M.; Nascimento, J. S.; Pereira, M. C.; Fabris, J. D.; Ardisson, J. D.; Nazzarro, M. S.; Sapag, K.; Araújo, M. H.; Lago, R. M.; Appl. Catal., B 2012, 115-116, 45.
34. Teixeira, A. P. C.; Tristao, J. C.; Araujo, M. H.; Oliveira, L. C. A.; Moura, F. C. C.; Ardisson, J. D.; Amorim, C. C.; Lago, R. M.; J. Braz. Chem. Soc. 2012, 23, 1579.
35. Linkous, C. A.; Huang, C.; Fowler, J. R.; J. Photochem. Photobiol., A 2004, 168, 153.
36. Steudel, R.; Holdt, G.; Gobel, T.; J. Chromatogr. 1989, 475,
442.
37. Fleet, M. E.; Liu, X.; Spectrochim. Acta, Part B 2010, 65, 75. 38. Scheers, J.; Fantini, S.; Johansson, P.; J. Power Sources 2014,
255, 204.
39. Müller, A.; Krebs, B.; Sulfur: Its Significance for Chemistry, for the Geo-, Bio-, and Cosmosphere and Technology; Elsevier Science: Amsterdam, 2013.
40. Janz, G. J.; Downey, J. R.; Roduner, E.; Wasilczyk, G. J.; Coutts, J. W.; Eluard, A.; Inorg. Chem. 1976, 15, 1759.
41. el Jaroudi, O.; Picquenard, E.; Gobeltz, N.; Demortier, A.; Corset, J.; Inorg. Chem. 1999, 38, 2917.
42. Steudel, R. In Elemental Sulfur und Sulfur-Rich Compounds II (Inorganic Polysulfanes H2S n with n > 1); Steudel, R., ed.;
Springer Berlin Heidelberg: Berlin, 2003.
43. Trofimov, B. A.; Sinegovskaya, L. M.; Gusarova, N. K.; J. Sulfur Chem. 2009, 30, 518.
44. Gun, J.; Modestov, A. D.; Kamyshny Jr., A.; Ryzkov, D.; Gitis, V.; Goifman, A.; Lev, O.; Hultsch, V.; Grischek, T.; Worch, E.; Microchim. Acta 2004, 146, 229.
45. Nippe, M.; Khnayzer, R. S.; Panetier, J. A.; Zee, D. Z.; Olaiya, B. S.; Head-Gordon, M.; Chang, C. J.; Castellano, F. N.; Long, J. R.; Chem. Sci. 2013, 4, 3934.
46. Navarro-Solís, I.; Villalba-Almendra, L.; Alvarez-Gallegos, A.;
Int. J. Hydrogen Energy 2010, 35, 10833.
47. Nemes, Á.; Inzelt, G.; J. Solid State Electrochem. 2014, 18,
3327.
48. Zhang, J.; Wang, X.; Qin, D.; Xue, Z.; Lu, X.; Appl. Surf. Sci.
2014, 320, 73.
Submitted:August 10, 2015