Article
J. Braz. Chem. Soc., Vol. 27, No. 2, 278-284, 2016. Printed in Brazil - ©2016 Sociedade Brasileira de Química 0103 - 5053 $6.00+0.00
A
*e-mail: [email protected]
Thermal Decomposition of Polymer/Montmorillonite Nanocomposites Synthesized
in situ
on a Clay Surface
Bruno D. Fecchio, Silvano R. Valandro, Miguel G. Neumann and Carla C. S. Cavalheiro*
Instituto de Química de São Carlos, Universidade de São Paulo, CP 780, 13560-970 São Carlos-SP, Brazil
This paper reports the effect of the SWy-1 montmorillonite content on the kinetic thermal degradation of poly(2-hydroxyethyl methacrylate) (PHEMA)/SWy-1 nanocomposites prepared by
in situ photopolymerization, using thermogravimetry analysis (TGA). 2-Hydroxyethyl methacrylate
was photopolymerized in the presence of SWy-1 clay mineral using 2-hydroxy-3- (3,4-dimethyl-9-oxo-9H-thioxanthen-2-yloxy)-N,N,N-trimethyl-1-propanium chloride (QTX) and triethanolamine
as the photoinitiating system. X-Ray diffraction analysis indicates that the PHEMA/SWy-1 nanocomposites present an intercalated structure. The isoconversional Flynn-Wall-Ozawa method was used to estimate activation energies and pre-exponential factors for the thermal decomposition. All nanocomposites exhibited improvement in their thermal stability, mainly due to the large interaction between the PHEMA intercalated in the SWy-1 structure. The activation energies for PHEMA/SWy-1 nanocomposites increased when increasing the clay content. The SWy-1 clay mineral acts as a better insulator, mass transport barrier and as a “crosslinking agent”, increasing the activation energies for the decomposition of the polymer present in the nanocomposites.
Keywords: polymer-clay nanocomposites, thermal degradation, photopolymerization
Introduction
The interest of industry, as well as academic institutes in polymer-layered clay nanocomposites, has increased in recent years because of their improved characteristics, including enhanced thermal stability,1,2 mechanical
properties,3 barrier properties4 and photooxidative stability,5
even at very low clay content (< 5%), when compared with conventionally filled polymer composites. To achieve these properties, layered silicates, such as montmorillonite (Mt), hectorite and saponite, have been the most commonly used to prepare polymer-clay nanocomposites.6
Mt is a clay that is classified as a smectite. These silicates are composed of two tetrahedral silica sheets and one central octahedral sheet of magnesia or alumina. The layers organize themselves in a parallel way resulting in stacks with regular interlayer spaces.7
The association of the layered clay with the polymer can produce traditional microcomposites, as well as intercalated and exfoliated nanocomposites. In microcomposites, the polymer chains are unable to intercalate between the silicate
sheets. However, intercalated nanocomposites are formed when polymeric chains are inserted in the silicate layers. On the other hand, when the silicate layers are completely dispersed in the polymer matrix, an exfoliated structure is obtained.
Factors such as nature of the components (layered silicate, polymer, plasticizer and solvent) and the method of preparation are responsible for the interactions of clay particles with polymeric matrix.8 In general, intercalated
or exfoliated polymer-layered clay nanocomposites can be prepared, mainly by in situ polymerization,3
solution intercalation9 and melt mixing.10 The properties
of nanocomposites prepared by in situ polymerization
can be somewhat superior to those prepared by solution intercalation and melt intercalation methods, since the polymer chains grow inside the interlayer spaces of clay, resulting in clay exfoliation and nanocomposite formation.11,12
Poly(2-hydroxy ethyl methacrylate) (PHEMA) is a poly(n-alkyl methacrylate), a class of polymers consisting
due to its similarity with living tissues, and can be used in applications such as soft contact and intraocular lenses.14
Thermal analysis studies involving PHEMA have been performed on several nanocomposites involving modified sepiolite,15 montmorillonite,16 and hydrous
Na-montmorillonite.17 These studies revealed that thermal
stability of the nanocomposites increases in relation to pure polymers. However, Çaykara and Güven18 observed that in
presence of alumina and silica fillers the thermal stability of PHEMA composites decreases.
In this work, nanocomposites of PHEMA and montmorillonite with different clay mineral contents (0.5, 1.0 and 2.5% m/m) were prepared by in situ
photoinitiated polymerization to examine the effect of clay content on the kinetics of their thermal degradation using thermogravimetric analysis (TGA) techniques.
Experimental
Materials
The SWy-1 montmorillonite was supplied by Source Clays Repository of the Clay Minerals Society, University of Missouri, Columbia, Missouri. The clay was purified as described earlier.19 The synthesis of the polymer was
performed with 2-hydroxyethyl methacrylate (HEMA, Sigma-Aldrich) monomer. 2-Hydroxy-3-(3,4-dimethyl-9-oxo-9H-thioxanthen-2-yloxy)-N,N,N
-trimethyl-1-propanium chloride (QTX, Nippon Ink) and triethanolamine (Sigma) were used as initiator and co-initiator, respectively. These chemicals were of analytical grade and used without further purification. N,N-Dimethylformamide (HPLC
grade, Tedia) was used as solvent.
Photopolymerization
The SWy-1 clay mineral was initially dispersed into Millipore water (Milli Q) by overnight stirring. A 10 mL aliquot of a solution containing HEMA monomer (4.1 mol L-1), QTX (1.0 × 10⁻⁵ mol L-1), triethanolamine
(2.0 × 10⁻² mol L-1) and dispersed clays (0.50, 1.0 or
2.5 wt.%, regarding the monomer) were stirred for 30 min under a nitrogen atmosphere. Afterwards, the samples were irradiated for 1 h using four 100 W Philips Daylight lamps, at room temperature. The resulting nanocomposites were precipitated with cold water. The precipitate was filtered, washed with cold water and dried overnight at 50 ºC under reduced pressure in a vacuum oven. Thin material films were cast from dimethylformamide solutions (3 wt.%) and dried overnight at 50 ºC under reduced pressure in a vacuum oven.
Measurements
The X-ray diffraction (XRD) spectra of the clay and the nanocomposites were recorded on a Rigaku Rotaflex RU-200B diffractometer (Cu, radiation λ = 0.154 nm) at 50 kV, 100 mA. The basal spacing of the samples was calculated using Bragg’s equation.20 The evaluation of the
superficial morphology of the compounds was performed by scanning electron microscopy (SEM) using a secondary electron detector of a ZEISS model LEO-440 applying 20 keV energy and a magnification of 10000×. The samples were deposited on an aluminium holder and coated with a gold film of approximately 10 nm.
The TGA curves for PHEMA and the nanocomposites were obtained in an SDT-Q 600 TG/DTA simultaneous module, controlled by an Advantage 4.8 software (both from TA Instruments). The curves were obtained under a dynamic nitrogen atmosphere flowing at 50 mL min-1.
Samples were placed in open α-alumina crucibles and heated up to 600 oC at rates changing from 1.0 up to
7.5 ºC min-1. Sample masses of ca. 10 mg (± 0.1 mg)
were used. Kinetic parameters, such as activation energies and pre-exponential factors, were determined using the Flynn-Wall-Ozawa method (equation 1)21
0.475
log(β) = log AE 2.315
g(α)R RT
− +
(1)
where A is the pre-exponential factor; E is the apparent
activation energy of the degradation process, R is the
universal gas constant, β is the heating rate and g(α)
is the integrated form of α, the conversion dependence function.
Results and Discussion
Morphology of the PHEMA/clay nanocomposites
The XRD patterns of pure SWy-1 and PHEMA/SWy-1 nanocomposites with 0.5, 1.0 and 2.5 wt.% SWy-1 are shown in Figure 1. The interlayer spacing can be calculated from the reflection peaks. Pure SWy-1 clay mineral exhibits a reflection at 2θ = 7.8º, which corresponds to a basal spacing of about 11.2 Å.
For the nanocomposites containing 0.5, 1.0, and 2.5 wt.% SWy-1 clay mineral, the reflections appear at 2θ ca. 5º (basal spacing of about 17 Å). These results imply that the silicate layers were separated during the
in situ photopolymerization, resulting in an intercalated
suggesting that clay is homogeneously dispersed in the polymeric matrix.22
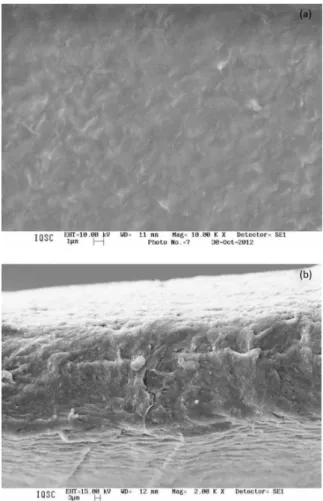
Figure 2 shows SEM images obtained for the PHEMA/SWy-1 (2.5%) nanocomposite. The images suggest that the nanocomposite is homogeneous, indicating efficient dispersion of the clay before polymerization, thus
confirming the results obtained by XRD. The thickness of the films, calculated from Figure 2b, is 55 µm.
Ther mal stability of PHEMA and PHEMA/SWy-1 nanocomposites
Figure 3 shows the TGA and differential thermo-gravimetry (DTG) curves of PHEMA and PHEMA/SWy-1 nanocomposites at a heating rate of 7.5 ºC min-1. Similar
curves were obtained for all different heating rates. It can be seen that the PHEMA mass loss process takes place in three steps.
The first step, in the 70-160 ºC range, is due to water loss.23 The second stage, between 160-270 ºC, is attributed to
the release of residual not polymerized HEMA monomers. The third stage, above 270 ºC, is related to the thermal degradation of PHEMA. This stage involves three different steps at approximately 300-325, 360 and 400-420 ºC, as can be noticed in the inset of Figure 3b. These steps (Scheme 1) can be correlated with the three main reactions proposed for the thermal degradation of PHEMA, namely,
5 10 15 20 25 30
2 / degreeθ
SWy-1
PHEMA/SWy-1 (0.5%) PHEMA/SWy-1 (1.0%) PHEMA/SWy-1 (2.5%)
Figure 1. X-Ray diffraction patterns for SWy-1 clay and PHEMA/SWy-1
nanocomposites.
Figure 2. SEM images of PHEMA/SWy-1 (2.5%).
100 200 300 400 500 600
0 20 40 60 80 100
PHEMA
PHEMA/SWy-1 (0.5%) PHEMA/SWy-1 (1.0%)
PHEMA/SWy-1 (2.5%)
Mass / %
(a)
100 200 300 400 500 600
0.0 0.4 0.8 1.2
300 400
PHEMA
PHEMA/SWy-1 (0.5%) PHEMA/SWy-1 (1.0%) PHEMA/SWy-1 (2.5%)
Der
iv
ativ
e weight / (% °C
-1 )
Temperature / °C Temperature / °C
(b)
Figure 3. (a) TGA and (b) DTG curves for pure PHEMA and the
nanocomposites. Inset: blow-up of the 275-475 ºC region.
5 10 15 20 25 30
2 / degreeθ
SWy-1
PHEMA/SWy-1 (0.5%) PHEMA/SWy-1 (1.0%) PHEMA/SWy-1 (2.5%)
100 200 300 400 500 600
0 20 40 60 80 100
PHEMA
PHEMA/SWy-1 (0.5%) PHEMA/SWy-1 (1.0%) PHEMA/SWy-1 (2.5%)
Mass / %
(a)
100 200 300 400 500 600
0.0 0.4 0.8 1.2
300 400
PHEMA
PHEMA/SWy-1 (0.5%) PHEMA/SWy-1 (1.0%) PHEMA/SWy-1 (2.5%)
Der
iv
ativ
e weight / (% °C
-1 )
Temperature / °C Temperature / °C
depolymerization with elimination of chain-end monomers, which is the major product of thermal degradation of PHEMA (a), reactions on the ester side-chain involving chain scissions and water elimination (b), and bond scission to form free radicals (c).24-26
The onset of the decomposition of the nanocomposites was found at temperatures up to 28 ºC higher than for pure PHEMA, indicating the production of a material with improved thermal stability. This can be attributed to two reasons: SWy-1 may avoid the mass transport of volatile products generated during decomposition, and also act as a “crosslinking agent”, hindering the motion of the polymer chains.6,27
Furthermore, the DTG curves also show that the depolymerization stage becomes less important with higher clay loadings, confirming the higher stability conferred to the nanocomposites by the presence of clay.
Kinetic analysis
The thermal degradation of PHEMA and the 2.5% Mt nanocomposite as a function of the heating rate is presented
in Figure 4 (the plots corresponding to the 0.5 and 1.0% Mt nanocomposites are in the Supplementary Information). The thermograms show that, after an initial loss of 20% of the original weight, there is an almost total rapid degradation of the pure PHEMA and the nanocomposites in the range 300-400 ºC. For the decomposition of the nanocomposites around 15-30% is left, probably corresponding to the remaining clay and polymer ashes.
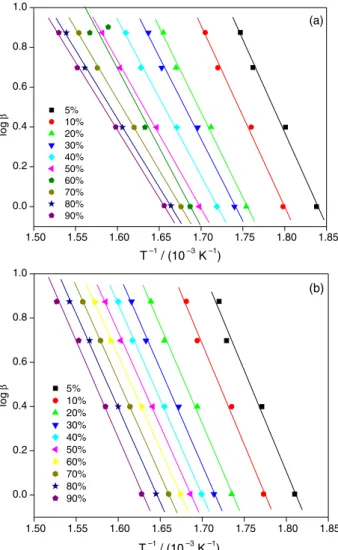
Activation energies (E) and pre-exponential factors (A)
of the reactions were determined from the linear fits of (log β) vs. T-1 (taken from Figure 4) for 0.05 ≤α≤ 0.9 at
0.05 steps. These plots, for pure PHEMA and the 2.5% Mt-containing nanocomposite are shown in Figure 5 (the plots corresponding to the 0.5 and 1.0% Mt nanocomposites are in the Supplementary Information).
As can be seen in Figure 5, the best fitting straight lines for the Flynn-Wall-Ozawa analysis are parallel, indicating the same activation energies for the depolymerization reactions at different heating rates.
Whereas the activation energy of the decomposition process remains constant when changing the heating rate, this parameter changes during the course of the
Scheme 1. Reactions proposed for the thermal degradation of PHEMA.
CH3
C
CH2
C
OCH2CH2OH
O
CH3
C CH2
CH2
C
OCH2CH2OH
O
CH3
C CH2
C
OCH2CH2OH
O
CH3
C
CH2
C
OCH2CH2OH
O
CH3
C CH2
CH2
C
OCH2CH2OH
O
CH3
C CH2
C O
OCH CH2
+ H2O
CH3
C
CH2
C
OCH2CH2OH
O
CH3
C CH2
CH2
C
OCH2CH2OH
O
CH3
C
CH2
C
OCH2CH2OH
O +
Depolymerization
Chain scission + water release
Bond scisision + free radical formation
(a)
degradation. This dependence was determined by applying the Flynn-Wall-Ozawa method on the entire variation field of the conversion level and using the recorded TGA curves of the samples at different heating rates. Figure 6 shows the activation energy (E) for the thermal decomposition of the
samples as a function of the conversion level.
As can be seen from Figure 6 the behavior of the overall activation energy as a function of the degree of decomposition of PHEMA and the nanocomposites seem to follow different trends. Nevertheless, a distinct pattern becomes apparent for the various clay contents. Whereas for pure PHEMA there is a continuous decrease over the whole range of conversion, for the 0.5% Mt nanocomposite, a plateau starts at about α
ca. 0.5. When analysing the other two nanocomposites, it can be seen that this plateau starts at α ca. 0.1 and ca. 0.2 (for PHEMA-SWy-1 1.0% and PHEMA-SWy-1 2.5%, respectively) and is followed by a new decrease starting at
α ca. 0.6. These three stages could be correlated with the three main reactions (Scheme 1) proposed by Demirelli et al.24
According to Vyazovkin and Wight,28 the activation
energy dependence observed for pure PHEMA corresponds
100 200 300 400 500 600
0 20 40 60 80 100
1.0 °C min
1.0 °C min
-1
-1
2.5 °C min
2.5 °C min
-1
-1
5.0 °C min
5.0 °C min
-1
-1
7.5 °C min
7.5 °C min
-1
-1
(a)
100 200 300 400 500 600
0 20 40 60 80 100 (b)
Temperature / °C Temperature / °C
Mass / %
Mass / %
Figure 4. TGA curves for (a) pure PHEMA and (b) PHEMA/SWy-1
(2.5%) nanocomposite in N2 atmosphere at various heating rates.
1.50 1.55 1.60 1.65 1.70 1.75 1.80 1.85
0.0 0.2 0.4 0.6 0.8 1.0 log β log β
T–1/ (10–3K )–1
5% 10% 20% 30% 40% 50% 60% 70% 80% 90% (a) 0.0 0.2 0.4 0.6 0.8 1.0
T–1/ (10–3K )–1
1.50 1.55 1.60 1.65 1.70 1.75 1.80 1.85
5% 10% 20% 30% 40% 50% 60% 70% 80% 90% (b)
Figure 5. Flynn-Wall plots of log β as function of T-1 at several conversions
for α between 0.05 and 0.90 for: (a) pure PHEMA and (b) the PHEMA/ SWy-1 (2.5%) nanocomposite.
0.0 0.2 0.4 0.6 0.8 1.0
100 120 140 160 180 200 PHEMA PHEMA/SWy-1 (0.5%) PHEMA/SWy-1 (1.0%) PHEMA/SWy-1 (2.5%) Activ
ation energy / (kJ mol
)
-1
α
Figure 6. Activation energies of PHEMA and PHEMA/SWy-1
nanocomposites vs. fractional mass loss obtained from
Flynn-Wall-Ozawa analysis.
100 200 300 400 500 600
0 20 40 60 80 100
1.0 °C min
1.0 °C min -1
-1 2.5 °C min
2.5 °C min -1
-1 5.0 °C min
5.0 °C min -1
-1 7.5 °C min
7.5 °C min -1
-1
(a)
100 200 300 400 500 600
0 20 40 60 80 100 (b)
Temperature / °C Temperature / °C
Mass / %
Mass / %
1.50 1.55 1.60 1.65 1.70 1.75 1.80 1.85 0.0 0.2 0.4 0.6 0.8 1.0 log β log β
T–1/ (10–3K )–1
5% 10% 20% 30% 40% 50% 60% 70% 80% 90% (a) 0.0 0.2 0.4 0.6 0.8 1.0
T–1/ (10–3K )–1
1.50 1.55 1.60 1.65 1.70 1.75 1.80 1.85 5% 10% 20% 30% 40% 50% 60% 70% 80% 90% (b)
0.0 0.2 0.4 0.6 0.8 1.0
100 120 140 160 180 200 PHEMA PHEMA/SWy-1 (0.5%) PHEMA/SWy-1 (1.0%) PHEMA/SWy-1 (2.5%) Activ
ation energy / (kJ mol
)
-1
to the occurrence of two consecutive reactions: a reversible endothermic process followed by the main chain scission involving the loss of water.20 For the nanocomposites the
more complex behavior will involve a combination of various different processes and it can be assumed that the diffusion of gaseous products through the polymer-clay matrix gradually becomes the rate-limiting step of the decomposition.29
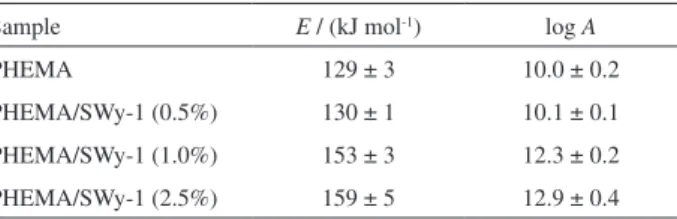
The average activation energies for PHEMA and the nanocomposites were calculated in the range where E is
roughly constant and the values are listed in Table 1. All the correlation coefficients for the calculations of E and A were larger than 0.98. The activation energies for the
depolymerization reaction in the presence of clay were higher than that for pure PHEMA. The effect of SWy-1 clay on the thermal stability and the activation energy in the nanocomposites is attributed to the intercalation of the polymer chains into the interlayer spaces of the clay.25
Conclusions
This study shows that intercalated nanocomposites based on poly(2-hydroxyethyl methacrylate)/montmorillonite were successfully prepared by in situ photopolymerization,
using a SWy-1 clay mineral. XRD and SEM analyses showed that the clay mineral was homogeneously dispersed in the polymer matrix.
The nanocomposites exhibited improvement in thermal stability as determined by TGA, mainly due to its intercalated structure. DTG curves showed that the depolymerization stage becomes less important with higher clay loadings, suggesting that the clay affects the mechanism of thermal degradation.
In comparison with pure PHEMA, activation energies of nanocomposites are notably higher by the presence of the clay. The E values for nanocomposites increased with
the clay content, suggesting an improved thermal stability. The significant increase of activation energies, observed for PHEMA/montmorillonite nanocomposites compared with pure PHEMA, confirms the change in the degradation mechanism with the clay loading.
Supplementary Information
Supplementary information is available free of charge at http://jbcs.sbq.org.br as PDF file.
Acknowledgments
This is a contribution from the USP Research Consortium for Photochemical Technology. The authors would like to thank São Paulo Research Foundation (FAPESP) for financial support (grants 2009/15998-1 and 2012/19656-0) and the LATEQS group for providing the thermal analysis instrumentation.
References
1. Lecouvet, B.; Bourbigot, S.; Sclavos, M.; Bailly, C.; Polym. Degrad. Stab.2012, 97, 1745.
2. Bourbigot, S.; Gilman, J. W.; Wilkie, C. A.; Polym. Degrad. Stab.2004, 84,483.
3. Valandro, S. R.; Lombardo, P. C.; Poli, A. L.; Horn Jr., M. A; Neumann, M. G.; Cavalheiro, C. C. S.; Mat. Res.2014,17,265.
4. Tsai, T. Y.; Lin, M. J.; Chang, H. J.; Li, C. C.; J. Phys. Chem. Solids2010,71,590.
5. Valandro, S. R.; Poli, A. L.; Neumann, M. G.; Schmitt, C. C.;
Appl. Clay Sci.2013,85,19.
6. Ray, S. S.; Okamoto, M.; Prog. Polym. Sci.2003,28,1539. 7. Brigatti, M. F.; Galan, E.; Theng, B. K. G. In Handbook of
Clay Science; Bergaya, F.; Theng, B. K. G.; Lagaly, G., eds.; Elsevier: New York, 2006, pp. 19.
8. Alexandre, M.; Dubois, P.; Mater. Sci. Eng., R.2000,28,1. 9. Lombardo, P. C.; Poli, A. L.; Horn Jr., M. A.; Neumann, M. G.;
Schmitt, C. C.; J.Appl. Polym. Sci. 2013,127,3687. 10. Cho, J. W.; Paul, D. R.; Polymer2001, 42, 1083.
11. Kadi, S.; Djadoun, S. S.; Sbirrazzuoli, N.; Thermochim. Acta
2013,569, 127.
12. Akat, H.; Tasdelen, M. A.; Prez, F. D.; Yagci, Y.; Eur. Polym. J.
2008,44,1949.
13. Mark, H. F.; Bikales, N. M.; Overberger, C. G.; Menges, G.;
Encyclopedia of Polymer Science and Engineering, vol. 4,
2nd ed.; Wiley-Interscience: New York, 1985.
14. Vargün, E.; Sankir, M.; Aran, B.; Sankir, D. N.; Usanmaz, A.;
J. Macromol. Sci., Part A: Pure Appl. Chem.2010,47, 235. 15. Benlikaya, R.; Alkan, M.; Kaya, I.; Polym Compos.2009, 30,
1585.
16. Oral, A.; Shahwan, T.; Güler, Ç.; J. Mater. Res.2008, 23, 16.
17. Koç, Z.; Çelik, M.; Önal, M.; Sarıkaya, Y.; Mogulkoc, Y.;
J. Polym. Eng.2013, 33, 27.
18. Çaykara, T.; Güven, O.; Polym. Degrad. Stab. 1998, 62, 267. 19. Gessner, F.; Schmitt, C. C.; Neumann, M. G.; Langmuir1994,
10,3749.
Table 1. Kinetic parameters for the thermodegradation of pure PHEMA
and PHEMA/SWy-1 nanocomposites
Sample E / (kJ mol-1) log A
PHEMA 129 ± 3 10.0 ± 0.2
PHEMA/SWy-1 (0.5%) 130 ± 1 10.1 ± 0.1
PHEMA/SWy-1 (1.0%) 153 ± 3 12.3 ± 0.2 PHEMA/SWy-1 (2.5%) 159 ± 5 12.9 ± 0.4
20. Callister Jr, W. D.; Rethwisch, D. G.; Materials Science and Engineering: An Introduction, 8th ed.; Wiley: New York, 2010. 21. Flynn, J. H.; Wall, L. A.; J. Polym. Sci., Polym. Lett. Ed.1966,
4,323.
22. Aranda, P.; Hitzky-Ruiz, E.; Chem. Mater.1992,4,1395. 23. Meakin, J. R.; Hukins, D. W.; Imrie, C. T.; Aspden, R. M.;
J. Mater. Sci.: Mater. Med.2003,14, 9.
24. Demirelli, K.; Koskun, M.; Kaya, E.; Polym. Degrad. Stab.
2001,72,75.
25. Vargün, E.; Usanmaz, A.; J. Macromol. Sci., Part A: Pure Appl. Chem.2010,47,882.
26. Razga, J.; Penatrek, J.; Eur. Polym. J.1975,11,805.
27. Chen, H.; Zheng, M.; Sun, H.; Jia, Q.; Mater. Sci. Eng., A2007,
15,725.
28. Vyazovkin, S.; Wight, C. A.; Annu. Rev. Phys. Chem.1997,48, 125.
29. Sikdar, D.; Katti, D. R.; Katti, K. S.; J. Appl. Polym. Sci.2008,
107, 3137.
Submitted: June 1, 2015 Published online: August 28, 2015