Article
Printed in Brazil - ©2016 Sociedade Brasileira de Química0103 - 5053 $6.00+0.00
*e-mail: [email protected]
Differentiation Among Brazilian Wine Regions Based on Lead Isotopic Data
Cibele M. S. Almeida,a Ana C. Almeida,b Maria Luíza D. P. Godoy,c
Tatiana D. Saint’Pierreb and José M. Godoy*,b
aLaboratório de Ciências Químicas, Centro de Ciência e Tecnologia, Universidade Estadual do
Norte Fluminense Darcy Ribeiro, Avenida Alberto Lamego, 2000 Parque Califórnia, 28013-602 Campos dos Goytacazes-RJ, Brazil
bDepartamento de Química, Pontifícia Universidade Católica do Rio de Janeiro,
Rua Marquês de São Vicente, 225 Gávea, 22451-900 Rio de Janeiro-RJ, Brazil
cInstituto de Radioproteção e Dosimetria, Avenida Salvador Allende, s/n Jacarepaguá,
22780-160 Rio de Janeiro-RJ, Brazil
For the first time, the isotope ratio of lead is reported in Brazilian red wines. The lead concentration and the ratios of 204Pb/206Pb, 207Pb/206Pb and 208Pb/206Pb were determined in 94 red
wines produced in Campanha Gaúcha, Serra Gaúcha, Vale dos Vinhedos in Southern Brazil and Vale do São Francisco in Northeastern Brazil. The values observed for the isotopic ratios were consistent with those reported in the literature for wines of South America. The lead isotopic ratios showed no statistically significant differences among the vineyards of the Southern region; on the other hand, the vineyard from the Northeastern region showed large variations in its ratios.
The 204Pb/206Pb ratio data demonstrated that the wines of the Southern region have radiogenic
features, whereas the wines of the Northeastern region ranged from slightly to very radiogenic. These results indicated that the lead concentrations in the wines from these Brazilian regions are influenced both by agricultural practices and by natural occurrences. Isotope ratios allowed for differentiation among the wines produced in these two important wine producing areas in Brazil and are emerging as a promising tool in the study of the geographical origin of Brazilian wines.
Keywords: Brazilian red wines, lead isotope ratios, ICP-MS, geographic origin
Introduction
The presence of lead in wine is associated with two major sources as follows: natural sources, which are due to the weathering of rocks, and human activity, which results from the use of fertilizers, pesticides and agricultural and food additives and environmental pollution.1-4
In nature, there are three radioactive decay series,
238U, 235U and 232Th. The parent element is a long lived
radioactive element, and the last member of the series is a stable lead isotope such as 206Pb, 207Pb or 208Pb, and
is known as a radiogenic lead isotope. The stable lead isotope, 204Pb, is non-radiogenic. The lead isotope ratio
depends on factors such as uranium and thorium content in the soil, weathering processes and original rock age, which provide a fingerprint used for different forensic and archeological purposes.2,5-7
Inductively coupled plasma mass spectrometry (ICP-MS) has been used for lead isotopic composition determination in several types of samples, including wine.1,3,7-11 This is a robust
and practical method of measuring lead isotope ratios, but it is necessary to correct for instrumental mass discrimination phenomena in order to improve the accuracies of isotopic ratio measurements. Several methodologies are used for mass bias correction such as isotope reference materials or external spiking with a non-interference element presenting a well-established isotope ratio that is invariant in nature and exhibits an atomic mass similar to that of the element of interest. A second source of uncertainty in the measurements that should be taken into account is the dead time of the detector equipment.3,12,13
bottled and sold under private labels, which makes quality control difficult and facilitates product counterfeiting and adulteration.14 Focusing on wine consumers, this study
applied the lead isotopic ratio for the first time to study the geographical origin of Brazilian red wines.
Experimental
Southern region (Rio Grande do Sul State)14
Campanha Gaúcha
Commercial vineyards in the Campanha Gaúcha region began in the 1980s. The topography of the region allowed for the establishment of extensive vineyards modules that can be widely mechanized. Sandy soil and a climate similar to that of the Mediterranean allowed for the expansion of cultivated areas with fine grapes and also expanded the potential for the production of fine wines in Brazil (Figure 1a).
Serra Gaúcha
Located in the northeastern state of Rio Grande do Sul, this is the largest wine-growing region of the country, with 30.373 ha of vineyards. The production of wine in this region is based on small familial winegrowing properties with an average size of 15 ha with little mechanization due to a steep topography. Most of the grape harvest is intended for the preparation of wines, juices and other derivatives (Figure 1a).
Vale dos Vinhedos
The Vale dos Vinhedos is a micro region nestled among the cities of Bento Gonçalves, Garibaldi and Monte Belo do Sul, in the Serra Gaúcha. This region constitutes the first geographical indication of Brazil: indication of origin of Vale dos Vinhedos (Figure 1a).
Northeastern region
Vale do São Francisco
In northeastern Brazil along the states of Pernambuco (PE) and Bahia is the wine region of the lower-middle Vale do
São Francisco. It is situated in a semi-arid tropical climate zone, between 09º and 10º latitude South. The viticultural climate of the region presents intra-annual variability, which enables the production of grapes and wine throughout the year. This region is one of the emerging wine-producing areas that began in 1980 and is now experiencing a period of expansion in the production of fine wines with a distinct typicity from the traditional production regions of the world of viticulture (Figure 1b).
Reagents and standard solutions
All employed reagents were of supra-pure grade. Solutions were prepared with Milli-Q® quality water
(minimum resistivity 18.3 MΩ cm). Lead and thallium standard solutions were prepared by gravimetric dilution with 2% HNO3 starting from PerkinElmer single element
standards (1,000 mg L-1). Stock-solutions of 15 mg L-1 and
10 mg L-1 of NIST-SRM (National Institute of Standards
and Technology - standard reference material) 981 and NIST-SRM 982, respectively, were preserved in 2% HNO3
and used for the verification of the accuracy and precision of the methods employed. All samples were refrigerated.
Samples pre-treatment
The present study involved 94 red wine samples, including 10 from Campanha Gaúcha, 38 from Serra Gaúcha, 10 from Vale do São Francisco and 36 from Vale dos Vinhedos. The wine samples were bought in specialized stores and supermarkets, since they represent better the product that reach the final consumer, on the other hand the chain of custody of the samples is broken and if any anomaly is detected further investigation is needed. The samples were coded following the information on the labels of the bottles. Thus, a sample coded as V1-1 corresponds to wine number 1, produced by vineyard number 1 from Vale dos Vinhedos; SG23-4 corresponds to wine number 4, produced by vineyard number 23 from the Serra Gaúcha region. An aliquot of 40 mL was stored in a polypropylene tube at room temperature after acidification with 1 mL of concentrated HNO3.
The wine sample treatment method was as follows: 1 g of wine and 1 g of concentrated HNO3 were weighed in
polypropylene tubes, closed and left to react for 24 h. After this time, the solutions were diluted with the addition of ultrapure water up to 10 g. Each wine sample was prepared in triplicate. Aliquots of this solution were diluted 20-fold for the determination of lead elements by ICP-MS.
Based on the measured lead concentration, the wine samples were diluted for subsequent isotopic analyses until the concentration of the element was approximately 15 µg L-1.
Lead isotope ratio determination
The isotopic ratios of 204Pb/206Pb, 207Pb/206Pb and 208Pb/206Pb were determined using ten sample batches. For
each batch, mass bias correction factors were determined using NIST-SRM 981 and applying NIST-SRM 982 as a validation sample. The mass bias correction factor (β) uncertainty and the combined uncertainty for the calculated atom ratio were derived as proposed by Godoy et al.15 Mass
bias was corrected by applying equation 1, where β was determined from NIST-SRM 981 analysis and equation 2:
β
x/y x/y x
corrected measured y mass
R = R
mass
(1)
a/b standard
a/b measured
a b R
ln R
β=
mass
ln mass
(2)
where Rx/y = intensity ratio between the isotopes X and Y;
Ra/b = intensity ratio between the isotopes a and b reported
on the SRM and massx = atomic mass of the isotope X.
Instrumentation
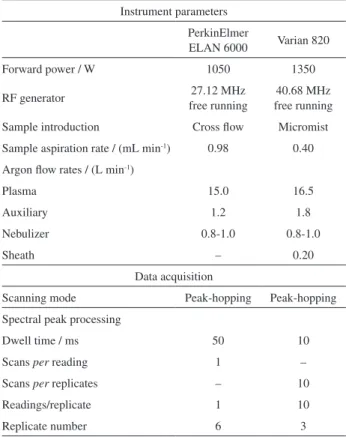
Based on their availability and the type of work carried out with each instrument, two different quadrupole ICP-MS were used during the present work, a PerkinElmer ELAN 6000 (Toronto, Canada) and a Varian 820-MS (Mulgrave, Australia). The first instrument was applied for elemental concentration determination, whereas the second instrument was used for lead isotopic composition determination. The relevant operational conditions of both instruments are summarized in Table 1.
Data analysis
The lead isotope ratio results were analyzed using
one-way analysis of variance (ANOVA) in order to verify the existence of significant differences among the regions.
Results and Discussion
Dead time determination
The dead time of the detection system of an ICP-MS is an important parameter for the determination of isotopic ratios when detection is based on ion counting. When the frequencies of the ions reaching the detector are very high and the counting system is no longer able to solve the successive particles achieving the detector, the result is inaccurate. This effect is due to processes occurring in the electron multiplier and is caused in part by the effects of an electronic counting device connected to the multiplier. The equipment is usually delivered with a default value for the dead time (T). When the actual counts are much smaller than 1/T, equations for the correction of dead time are applied. For high counting rates, particularly rates above 1 × 10⁶ s-1, non-linearity of the response signal of
the equipment is typically observed.16,17
The dead time was calculated following the methodology proposed by Held and Taylor,16 and a value of 31 ns was
Table 1. Operational conditions, data acquisition modes and other information for the determination of Pb concentrations and isotope ratios by ICP-MS
Instrument parameters PerkinElmer
ELAN 6000 Varian 820
Forward power / W 1050 1350
RF generator 27.12 MHz
free running
40.68 MHz free running
Sample introduction Cross flow Micromist
Sample aspiration rate / (mL min-1) 0.98 0.40
Argon flow rates / (L min-1)
Plasma 15.0 16.5
Auxiliary 1.2 1.8
Nebulizer 0.8-1.0 0.8-1.0
Sheath – 0.20
Data acquisition
Scanning mode Peak-hopping Peak-hopping
Spectral peak processing
Dwell time / ms 50 10
Scans per reading 1 –
Scans per replicates – 10
Readings/replicate 1 10
obtained. Using a counting rate equivalent to 10 times lower than 1/T as a limit in order to avoid large dead time corrections, we found that counting rates higher than 3 × 10⁶ s-1 should be avoided.
Lead determination and isotopic ratios by ICP-MS
To verify the achieved accuracy and precision, sixteen NIST-SRM 982 analysis results were pooled together, with the calculated relative errors and standard deviations presented in Table 2. Based on the obtained results, it was verified that, applying quadrupole ICP-MS, relative errors and reproducibility of approximately 0.5% for the 204Pb/206Pb, 207Pb/206Pb and 208Pb/206Pb isotopic ratios
are feasible. These results were in agreement with those reported by Barbaste et al.9 and Ketterer et al.18
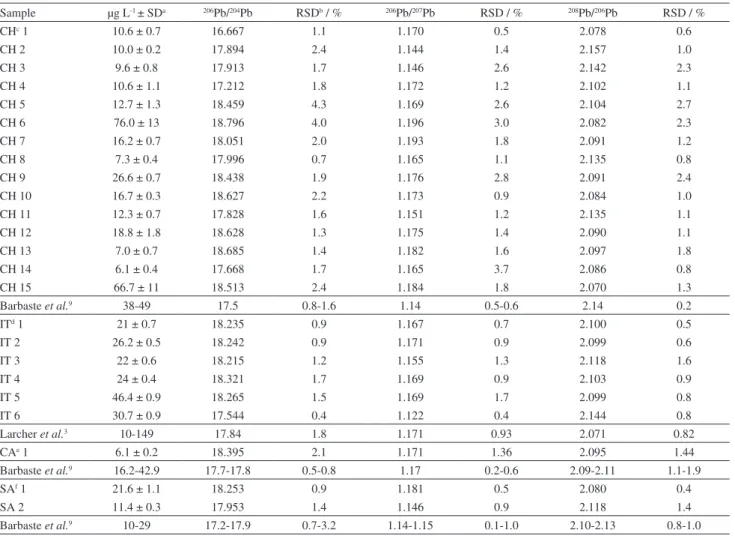
As there are no data on lead isotope ratios in Brazilian wines, wine samples from Chile, California, South Africa and Italy were also bought at local markets and analyzed to compare our results with data in the literature (Table 3); the
lead isotopic ratios are presented as 206Pb/204Pb, 206Pb/207Pb
and 208Pb/206Pb to allow for comparisons with the literature.
The obtained results were in agreement with those obtained by Larcher et al.3 and Barbaste et al.9
The lead concentrations in Brazilian red wines did not show large variations among regions and were within the 0.15 mg L-1 limit set by Brazilian Legislation.19
The results for the ratios of 206Pb/204Pb, 206Pb/207Pb and 208Pb/206Pb in Brazilian red wines are presented in Table 1
of the Supplementary Information. Taking into account
Table 2. Lead isotopic ratio determination precision and accuracy based on the NIST-SRM-982 analysis (n = 16)
Certified valuea Measured RSDb /
%
Relative error / %
204Pb/206Pb 0.027219 ± 0.000027 0.02735 0.65 –0.47
207Pb/206Pb 0.46707 ± 0.00020 0.47682 0.45 0.25
208Pb/206Pb 1.00016 ± 0.00036 0.9951 0.57 –0.51
ak = 1.95; brelative standard deviation.
Table 3. Obtained lead concentrations and isotope ratios in red wines from different countries
Sample µg L-1 ± SDa 206Pb/204Pb RSDb / % 206Pb/207Pb RSD / % 208Pb/206Pb RSD / %
CHc 1 10.6 ± 0.7 16.667 1.1 1.170 0.5 2.078 0.6
CH 2 10.0 ± 0.2 17.894 2.4 1.144 1.4 2.157 1.0
CH 3 9.6 ± 0.8 17.913 1.7 1.146 2.6 2.142 2.3
CH 4 10.6 ± 1.1 17.212 1.8 1.172 1.2 2.102 1.1
CH 5 12.7 ± 1.3 18.459 4.3 1.169 2.6 2.104 2.7
CH 6 76.0 ± 13 18.796 4.0 1.196 3.0 2.082 2.3
CH 7 16.2 ± 0.7 18.051 2.0 1.193 1.8 2.091 1.2
CH 8 7.3 ± 0.4 17.996 0.7 1.165 1.1 2.135 0.8
CH 9 26.6 ± 0.7 18.438 1.9 1.176 2.8 2.091 2.4
CH 10 16.7 ± 0.3 18.627 2.2 1.173 0.9 2.084 1.0
CH 11 12.3 ± 0.7 17.828 1.6 1.151 1.2 2.135 1.1
CH 12 18.8 ± 1.8 18.628 1.3 1.175 1.4 2.090 1.1
CH 13 7.0 ± 0.7 18.685 1.4 1.182 1.6 2.097 1.8
CH 14 6.1 ± 0.4 17.668 1.7 1.165 3.7 2.086 0.8
CH 15 66.7 ± 11 18.513 2.4 1.184 1.8 2.070 1.3
Barbaste et al.9 38-49 17.5 0.8-1.6 1.14 0.5-0.6 2.14 0.2
ITd 1 21 ± 0.7 18.235 0.9 1.167 0.7 2.100 0.5
IT 2 26.2 ± 0.5 18.242 0.9 1.171 0.9 2.099 0.6
IT 3 22 ± 0.6 18.215 1.2 1.155 1.3 2.118 1.6
IT 4 24 ± 0.4 18.321 1.7 1.169 0.9 2.103 0.9
IT 5 46.4 ± 0.9 18.265 1.5 1.169 1.7 2.099 0.8
IT 6 30.7 ± 0.9 17.544 0.4 1.122 0.4 2.144 0.8
Larcher et al.3 10-149 17.84 1.8 1.171 0.93 2.071 0.82
CAe 1 6.1 ± 0.2 18.395 2.1 1.171 1.36 2.095 1.44
Barbaste et al.9 16.2-42.9 17.7-17.8 0.5-0.8 1.17 0.2-0.6 2.09-2.11 1.1-1.9
SAf 1 21.6 ± 1.1 18.253 0.9 1.181 0.5 2.080 0.4
SA 2 11.4 ± 0.3 17.953 1.4 1.146 0.9 2.118 1.4
Barbaste et al.9 10-29 17.2-17.9 0.7-3.2 1.14-1.15 0.1-1.0 2.10-2.13 0.8-1.0
only wines produced in the Southern region, it was not possible to detect any statically valid differences (ANOVA) among the measured isotopic ratios. On the other hand, wines produced in the Northeast region exhibited larger differences compared with the wines from the Southern region, particularly in the 206Pb/204Pb ratio. The analysis
of variance confirmed this finding: analyzing only the wines of south region, statistically significant differences were not observed (206Pb/204Pb = 0.552; 206Pb/207Pb = 1.62
and 208Pb/206Pb = 2.11; critical value to 95% significance
level: 3.11), but when the data for the Northeastern region were included, these differences could be observed (206Pb/204Pb = 10.5; 206Pb/207Pb = 16.3 and 208Pb/206Pb = 14.6;
critical value to 95% significance level: 2.71). This indicates that it is possible to distinguish these two producing regions using isotopic ratios.
The two-dimensional graph (Figure 2) shows that it is possible to differentiate even among the producing regions within the Vale do São Francisco, Bahia and Pernambuco States based on isotopic ratios. One can see three groups with wines from Vale do São Francisco, two wines produced in Bahia State (grey), five wines from Lagoa Grande county (red), Pernambuco State, and three wines from Petrolina county (black), which is also in Pernambuco State. The wines produced in Lagoa Grande county were Cabernet Sauvignon; however, one of these wines was classified as a “mild red wine” with some sugar added, resulting in a somewhat different isotopic composition. The three wines from Petrolina county came from the same vineyard and were made from the same grape type, “Petite Syrah,” also called “Durif”; no apparent reason for the observed differences in isotopic composition was given. On the other hand, the wines produced in Rio Grande do Sul State constituted a homogeneous group (Figure 3).
In their studies, Misi et al.23 showed variations in 206Pb/204Pb ratio in galena deposits of the Vale do São
Francisco, which enabled the separation of the samples into three distinct groups as follows: very radiogenic, with values above 24; radiogenic, with values close to or lower than 20; and low radiogenic, with values of approximately 19. This variability in the 206Pb/204Pb isotopic ratio was
also evident in the wines from this region; therefore, it was possible to classify them as either very radiogenic or slightly radiogenic (Table 1 at Supplementary Information). One explanation for this finding, which was also observed by Misi et al.,23 is the possibility of
mixing of materials formed by the weathering of source rocks with high 238U content and high Th/Pb ratios. These
variations are no longer observed for wines produced in the state of Rio Grande do Sul (Figure 3). Following the above classification, wines produced in this state are slightly radiogenic. These results show that the 206Pb/204Pb
isotope ratio enables the identification of these two important wine producing areas in Brazil due to typical local characteristics.
Conclusions
Lead concentrations found in wines from four regions studied did not vary greatly and were well below the limits established by Brazilian and international laws. Studies involving isotopic ratios of lead have shown promise in differentiating the wine producing regions in Brazil. In particular, variations in the 206Pb/204Pb isotope ratios were
observed for wines from the Vale do São Francisco region, giving these wines distinct characteristics not observed in the wines of the South of Brazil. The observed isotopic ratios indicate that lead content in the studied wines
Figure 2. Distributions of wine samples from Vale do São Francisco
(Northeast region) based on the 208Pb/206Pb and 206Pb/204Pb isotopic ratios
(black dots = Petrolina-PE; red dots = Lagoa Grande-PE; gray dots = Bahia).
Figure 3. Distributions of wines samples from the Southern region (black dots = c - Campanha Gaúcha; red triangles = sg - Serra Gaúcha; and gray dots = v - Vale dos Vinhedos) based on the 208Pb/206Pb and 206Pb/204Pb
is strongly influenced by their region of origin and by agricultural practices.
Supplementary Information
Supplementary information is available free of charge at http://jbcs.sbq.org.br.
Acknowledgments
Cibele M. S. Almeida would like to say thank you for the fellowship from CNPq, Brazil. The authors would like also to express their gratitude to Embrapa Vinhos for their support during project formulation.
References
1. Mihaljevič, M.; Ettler, V.; Šebek, O.; Strnad, L.; Chrastný, V.; J. Geochem. Explor.2006, 88, 130.
2. Komárek, M.; Ettler, V.; Chrastný, V.; Mihaljevič, M.; Environ. Int.2008, 34, 562.
3. Larcher, R.; Nicolini, G.; Pangrazzi, P.; J. Agric. Food Chem.
2003, 51, 5956.
4. Rosman, K. J. R.; Chisholm, W.; Jimi, S.; Candelone, J. P.; Boutron, C. F.; Teissdre, P. L.; Adams, F. C.; Environ. Res.
1998, 78, 161.
5. https://www.ufpe.br/ansial/capitulo2.6.pdf accessed in December 2015.
6. Roux, G. L.; Weiss, D.; Grattan, J.; Givelet, N.; Krachler, M.; Cheburkin, A.; Rausch, N.; Kober, B.; Shotyk, W.; J. Environ. Monit.2004, 6, 502.
7. Dreyfus, S.; Pécheyran, C.; Lienemann, C. P.; Magnier, C.; Prinzhofer, A.; Donard, O. F. X.; J. Anal. At. Spectrom.2007, 22, 351.
8. Ettler, V.; Mihaljevič, M.; Komárek, M.; Anal. Bioanal. Chem.
2004, 378, 311.
9. Barbaste, M.; Halicz, L.; Galy, A.; Medina, B.; Emteborg, H.; Adams, F. C.; Lobinski, R.; Talanta2001, 54, 307.
10. Novák, M.; Emmanuel, S.; Vile, M. A.; Erel, Y.; Véron, A.; Pačes, T.; Wieder, R. K.; Vaněček, M.; Štěpánová, M.; Břízová, E.; Hovorka, J.; Environ. Sci. Technol.2003, 37, 437. 11. Almeida, C. M. R.; Vasconcelos, M. T. S. D.; Anal. Chim. Acta
1999, 396, 45.
12. Godoy, J. M.; Godoy, M. L. D. P.; Aronne, C.; J. Braz. Chem. Soc.2007, 18, 969.
13. Becker, J. S.; J. Anal. At. Spectrom.2002, 17, 1172.
14. http://www.cnpuv.embrapa.br/publica/artigos/prodvit2010.pdf accessed in December 2015.
15. Godoy, M. L. D. P.; Godoy, J. M.; Roldão, L. A; Tauhata, L.; J. Environ. Radioact.2009, 100, 613.
16. Held, P.; Taylor, D. P.; J. Anal. At. Spectrom.1999, 14, 1075. 17. Giné-Rosias, M. F.; Espectrometria de Massas com Fonte de
Plasma; CPG/CENA: Piracicaba, Brazil, 1999.
18. Ketterer, M. E.; Peters, M. J.; Tisdale, P. J.; J. Anal. At. Spectrom.
1991, 6, 439.
19. http://portal.anvisa.gov.br/wps/wcm/connect/8100bb8040ea c2e8b590b79cca79f4cf/RDC+n%C2%BA+42_2013_final. pdf?MOD=AJPERES, accessed in December 2015.
20. Misi, A.; Iyer, S. S. S.; Tassinari, C. C. G.; Franca-Rocha, W. J. S.; Coelho, C. E. S.; Cunha, I. A.; Gomes, A. S. R.; Rev. Bras. Geocienc.2004, 34, 263.
Submitted: October 2, 2015