Availability, safety, and quality of blood for
transfusion in the Americas
José Ramiro Cruz
1and María Dolores Pérez-Rosales
1Objectives: This article has two objectives: (1) to present for countries and territories of the Region of the Americas data on the number of blood donations, proportion of voluntary blood donors versus remunerated blood donors, coverage of screening for infectious agents, and sep-aration of donated blood into its components and (2) to explore the relationships of those char-acteristics with economic and organizational factors in the countries and territories.
Methods: We carried out comparative analyses using population and health information gathered annually by the Pan American Health Organization (PAHO) from national health officials from the countries in the Americas, as well as economic information (gross national product (GNP) per capita) obtained from publications of the World Bank.
Results: There is a direct correlation between the availability of blood for transfusion and GNP per capita. Seven countries with a GNP per capita above US$ 10 000 per year account for 38% of the Regional population but 68% of the Regional blood donations. Voluntary blood donation is more common in the countries with better blood availability. There is no associa-tion between GNP per capita and coverage of screening for infectious agents. Nevertheless, of the six countries with a GNP per capita below US$ 1 000, only one of the six screens all units for human immunodeficiency virus (HIV), hepatitis C virus (HCV), and hepatitis B surface antigen (HBsAg). Countries with a higher proportion of voluntary blood donors tend to have lower prevalence rates of infectious markers. Separation of blood into its components is also more common in countries with higher blood donation rates.
Conclusions: The availability, safety, and quality of blood for transfusion in the Americas needs to be improved. As part of that effort, national policies and strategies must be put into place so that the resources already allocated for blood services are better utilized.
Blood donors, blood transfusion, socioeconomic factors, North America, Latin Amer-ica, Caribbean.
ABSTRACT
The Region of the Americas is com-prised of 48 countries and territories that had an estimated total population of 822 429 000 inhabitants in 2002.2
Wide variations exist among the countries in their land area and popu-lation. For example, in 2002 Montserrat had 8 000 inhabitants while the United States of America had 288 530 000 (1). There are also differences in the level of economic development (2). There are countries, such as Haiti and Nic-aragua, where the gross national product (GNP) per capita is less than US$ 500 per year. In contrast, the GNP per capita for Bermuda, the Cayman
Is-lands, and the United States is above US$ 20 000 annually. Health indicators also vary widely among the countries of the Region (3), with poverty being associated with illness (4). Among the factors that play an important role in this relationship are sanitation condi-tions and access to health services and drugs (4).
Blood for transfusion should be con-sidered akin to an essential drug. Nev-ertheless, its availability depends on
1 Pan American Health Organization, Laboratory and Blood Services, Washington, D.C., United States of America. Send correspondence to: José Ramiro Cruz, Laboratory and Blood Services, Pan American Health Organization, 525 23rd Street, N.W., Washington, D.C. 20037, United States of America; telephone: (202) 3230; fax: (202) 974-3610; e-mail: [email protected]
2 For brevity, the rest of the article will just refer to “countries.”
the proactive role that health systems take in promoting blood donation and on the willingness of the population to donate. The safety of the blood avail-able for transfusion depends on the quality of the donors, in terms of their risk behaviors and factors for acquir-ing infections that may be transmitted through blood transfusions, and also on the capacity of the health systems to segregate high-risk donors and to perform laboratory analyses to deter-mine if the collected blood could be the source of infections. The results achieved in promoting blood donation and conducting adequate laboratory processing of collected blood (screen-ing it for infectious markers and sepa-rating it into its components) depend on the availability of financial re-sources and on how well organized blood services are.
This article has two objectives. One is to present data on the availability, safety, and quality of the blood used for transfusion in the countries of the Americas. A second objective is to ad-dress economic and organizational fac-tors that need to be taken into consid-eration to plan interventions aimed at achieving national sufficiency in the blood needed for transfusion as well as attaining the highest possible levels of safety of blood components.
MATERIALS AND METHODS
The data on blood collection and processing included in this article have been provided to the Pan Ameri-can Health Organization (PAHO) by national health officials from each of the countries in the Americas. Those officials provide that information to PAHO on a yearly basis, in a struc-tured form that was developed by con-sensus following discussions that PAHO personnel had with the coordi-nators of national blood programs in Latin America and with the directors of national blood banks in the Carib-bean. Complete data sets for either 2000 or 2001 were received from 43 of the 48 countries or territories; not cov-ered in this analysis are Guadalupe, French Guiana, Martinique, Puerto
Rico, and the U.S. Virgin Islands. Pop-ulation and health data for our study were obtained from a PAHO publica-tion, Health Situation in the Americas. Basic Indicators 2002 (3). The economic data for the study came from the World Development Report 2000/2001, a publi-cation of the World Bank (2).
For the purpose of this article, data on the number of blood units collected per calendar year were used to esti-mate the availability of blood in each country. The World Health Organiza-tion (WHO) and the InternaOrganiza-tional Fed-eration of Red Cross and Red Crescent Societies (IFRCRCS) have estimated that, for a nation to have sufficient blood to meet its blood-transfusion needs, the country’s blood services must annually collect at least 50 blood units per 1 000 inhabitants (5). We used that figure as the standard for our study. In this article, the term “blood” is used generically for the blood components that are used for trans-fusion, including packed red blood cells, platelet concentrates, and plasma. We did not consider plasma deriv-atives that are produced by an in-dustrial process, such as albumin and immunoglobulins.
The likelihood of an infection being transmitted through transfusion is min-imized when all blood units are col-lected from voluntary nonremunerated altruistic (VNRA) donors (6). There-fore, we used the proportion of VNRA donors among all blood donors as one of our basic measures of blood safety. (While we had data on autolo-gous donors in the Americas, those donors are not included in our category of “voluntary donors” since autologous donors are only donating blood for their own use and not for other pa-tients.) A second measure we used was the coverage of blood screening, that is, the proportion of the collected blood units that were tested for infectious markers.
VNRA donors are safer for the blood-supply system than are individ-uals who are required to replace the blood used by relatives and friends or who are paid to donate blood. In pre-donation interviews, those replace-ment donors and paid donors are more
likely to deny having risk factors and behaviors associated with transfusion-transmitted infections.
To examine the safety of blood, two documents were used: Estándares de trabajo para bancos de sangre[Work Stan-dards for Blood Banks] (7) and Caribbean Regional Standards for Blood Banks and Transfusion Services (8). Published re-spectively by PAHO and by the Carib-bean Epidemiology Centre, the two documents were produced with sup-port from the American Association of Blood Banks and various international experts. The two documents attempt to set the basis for voluntary accredita-tion of blood services and to provide the general requirements for these ser-vices and for blood itself. The docu-ments take into consideration the epi-demiology of infectious diseases, the complexity of the health services, and the local facilities that exist in Latin America and the Caribbean, respec-tively. The Latin American standards require that all blood units be tested for human immunodeficiency virus (HIV), hepatitis C virus (HCV), hepati-tis B surface antigen (HBsAg), syphilis, and Trypanosoma cruzi. Testing for T. cruziis not required by the Caribbean standards.
A third indicator of the safety of blood that we used in our study was the prevalence rate of antibodies against HIV, of antibodies against HCV, and of HBsAg among blood donors.
We estimated the “quality” of the blood using the proportion of the blood units that were separated into components (red blood cells, platelets, and plasma). The use of whole blood is recommended only for a minority of transfusions (9) and, therefore, at least 90% of collected units should be sepa-rated into components.
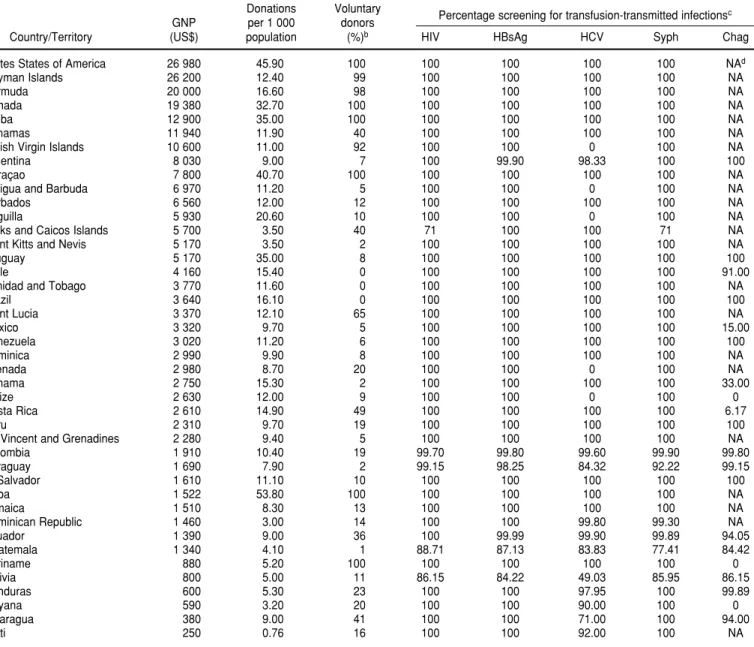
TABLE 1. Gross national product (GNP) per capita, annual blood donation, and blood screening for infectious agents in 42 countries and territories in the Region of the Americasa
Donations Voluntary
GNP per 1 000 donors Percentage screening for transfusion-transmitted infections c
Country/Territory (US$) population (%)b HIV HBsAg HCV Syph Chag
Unites States of America 26 980 45.90 100 100 100 100 100 NAd
Cayman Islands 26 200 12.40 99 100 100 100 100 NA
Bermuda 20 000 16.60 98 100 100 100 100 NA
Canada 19 380 32.70 100 100 100 100 100 NA
Aruba 12 900 35.00 100 100 100 100 100 NA
Bahamas 11 940 11.90 40 100 100 100 100 NA
British Virgin Islands 10 600 11.00 92 100 100 0 100 NA
Argentina 8 030 9.00 7 100 99.90 98.33 100 100
Curaçao 7 800 40.70 100 100 100 100 100 NA
Antigua and Barbuda 6 970 11.20 5 100 100 0 100 NA
Barbados 6 560 12.00 12 100 100 100 100 NA
Anguilla 5 930 20.60 10 100 100 0 100 NA
Turks and Caicos Islands 5 700 3.50 40 71 100 100 71 NA
Saint Kitts and Nevis 5 170 3.50 2 100 100 100 100 NA
Uruguay 5 170 35.00 8 100 100 100 100 100
Chile 4 160 15.40 0 100 100 100 100 91.00
Trinidad and Tobago 3 770 11.60 0 100 100 100 100 NA
Brazil 3 640 16.10 0 100 100 100 100 100
Saint Lucia 3 370 12.10 65 100 100 100 100 NA
Mexico 3 320 9.70 5 100 100 100 100 15.00
Venezuela 3 020 11.20 6 100 100 100 100 100
Dominica 2 990 9.90 8 100 100 100 100 NA
Grenada 2 980 8.70 20 100 100 0 100 NA
Panama 2 750 15.30 2 100 100 100 100 33.00
Belize 2 630 12.00 9 100 100 0 100 0
Costa Rica 2 610 14.90 49 100 100 100 100 6.17
Peru 2 310 9.70 19 100 100 100 100 100
St. Vincent and Grenadines 2 280 9.40 5 100 100 100 100 NA
Colombia 1 910 10.40 19 99.70 99.80 99.60 99.90 99.80
Paraguay 1 690 7.90 2 99.15 98.25 84.32 92.22 99.15
El Salvador 1 610 11.10 10 100 100 100 100 100
Cuba 1 522 53.80 100 100 100 100 100 NA
Jamaica 1 510 8.30 13 100 100 100 100 NA
Dominican Republic 1 460 3.00 14 100 100 99.80 99.30 NA
Ecuador 1 390 9.00 36 100 99.99 99.90 99.89 94.05
Guatemala 1 340 4.10 1 88.71 87.13 83.83 77.41 84.42
Suriname 880 5.20 100 100 100 100 100 0
Bolivia 800 5.00 11 86.15 84.22 49.03 85.95 86.15
Honduras 600 5.30 23 100 100 97.95 100 99.89
Guyana 590 3.20 20 100 100 90.00 100 0
Nicaragua 380 9.00 41 100 100 71.00 100 94.00
Haiti 250 0.76 16 100 100 92.00 100 NA
aThe World Bank (2) is the source of the GNP data for the countries and territories shown. To calculate the donation rate (donations per 1 000 population), population figures for the countries and territories for the year 2002 were used. The remaining data concerning donors and screening are for either 2000 or 2001, depending on the particular country or territory.
bThe figures shown in this table for the percentage of voluntary donors apply rounding that is not used in Table 4.
cThe markers for transfusion-transmitted infections shown in the table are: antibodies against human immunodeficiency virus (HIV), hepatitis B virus surface antigen (HBsAg), antibodies against hepatitis C virus (HCV), antibodies against syphilis (Syph), and antibodies against Trypanosoma cruzi(Chag [Chagas’ disease]).
dNA = not applicable.
GNP per capita were, in US$: 10 000, 5 000, 3 000, 2 000, and 1 000. This pro-duced both clear strata and also groups with similar sizes, of six to eight countries each. The breakpoints for availability of blood were 21.0, 12.5, 11.5, 9.0, and 5.0 units of blood collected annually per 1 000 inhabi-tants. In terms of voluntary blood do-nation, countries were divided into
two groups: (a) those that had at least 90% VNRA donors and (b) those that were below that figure. The preva-lence rates of infectious markers were not subjected to statistical analyses be-cause the laboratory methodologies used for testing vary not only within a country but also among countries. Therefore, only tendencies are pre-sented and described.
RESULTS
Availability of blood
information on the territory’s GNP per capita was not available.) Only one country in the Region, Cuba, col-lects blood in amounts that meet the WHO/IFRCRCS standard of 50 blood units per 1 000 inhabitants annually. Six countries have blood donation rates that reach at least 60% of that goal: the United States (45.90 units per 1 000 inhabitants), Curaçao (40.70), Aruba and Uruguay (35.00), and Can-ada (32.70). In contrast, 19 countries in the Americas have donation rates under 10 per 1 000.
There is a high correlation between GNP per capita and blood donation rates (r= 0.6047, P< 0.001, Spearman’s correlation test). When the 42 coun-tries are grouped by GNP per capita, it can be seen that the 7 of them with a GNP above US$ 10 000 per capita have 38% of the inhabitants but collect 68% of the blood donations in the Region (Table 2). When the Regional
propor-tions of blood donapropor-tions for each of the six GNP groups (68.1%, 4.7%, 18.1%, 2.2%, 6.4%, and 0.5%) are divided by the Regional proportions of the popu-lation in each of the groups (38.0%, 5.0%, 37.9%, 4.1%, 12.3%, and 2.6%), the respective ratios for the six groups of countries are: 1.79, 0.93, 0.48, 0.55, 0.52, and 0.21. In other words, the highest-GNP countries have 8.5 times as much blood available per person as do the lowest-GNP countries (1.79/ 0.21 = 8.5; a similar result can be found by using the information on donation rates in Table 2: 43.89/5.14 = 8.5).
Furthermore, the countries in the highest per-capita GNP group have more-efficient blood collection sys-tems than do the rest of the countries in the Region. For example, the 7 coun-tries in the highest per-capita GNP group have only 18.5% of all the blood collecting centers in the Region but they collect 68.1% of the donations in
the Region. In contrast, the 6 countries in the lowest GNP group have 3.6% of the Region’s blood banks but collect only 0.5% of the blood (Table 2). Table 2 also provides data on the average (mean) number of blood donations per blood center for each of the six GNP groups that we analyzed.
Safety of blood
Only six countries in the Americas report 100% VNRA donation: Aruba, Canada, Cuba, Curaçao, Suriname and the United States (Table 1). Three other countries have VNRA donation rates of at least 90%: the Cayman Islands (99%), Bermuda (98%), and the British Virgin Islands (92%).
As shown in Table 3, the countries with a higher GNP per capita and more blood available are also more likely to have VNRA donors (chi-square (2) = TABLE 2. Population, blood donation rate (per 1 000 population), and number of blood banks in 42 countries and territories of the Region of the Americas, grouped according to levels of gross national product per capitaa
Gross national Population ⫻
product (US$) 1 000 No. of donations No. of blood banks Blood donations
per capita Countries/Territories (% of Region) (% of Region) Donation rate (% of Region) per bank per year
> 10 000
5 000–9 999
3 000-4 999
2 000–2 999
1 000–1 999
< 1 000
aPopulation figures are for 2002. The remaining data are for either 2000 or 2001, depending on the particular country or territory. Aruba, Bahamas, Bermuda,
British Virgin Islands, Canada, Cayman Islands, United States
Anguilla, Antigua, Argentina, Barbados, Curaçao, St. Kitts and Nevis, Turks and Caicos, Uruguay
Brazil, Chile, Mexico, St. Lucia, Trinidad and Tobago, Venezuela
Belize, Costa Rica, Dominica, Grenada, Panama, Peru, St. Vincent
Colombia, Cuba, Dominican Republic, Ecuador, El Salvador, Guatemala, Jamaica, Paraguay
Bolivia, Guyana, Haiti, Honduras, Nicaragua, Suriname
310 030 (38.0)
40 986 (5.0)
309 824 (37.9)
33 062 (4.1)
100 403 (12.3)
21 116 (2.6)
13 608 586 (68.1)
930 796 (4.7)
3 621 292 (18.1)
441 815 (2.2)
1 283 832 (6.4)
108 542 (0.5)
43.89
22.71
11.69
13.36
12.79
5.14
662 (18.5)
868 (24.3)
1 252 (35.1)
205 (5.7)
456 (12.8)
127 (3.6)
20 557
1 072
2 892
2 155
2 815
29.6989, P < 0.0005, goodness-of-fit test).
Twenty-five countries screen all units of blood collected for HIV, HCV, and HBsAg (Table 1). However, there is no association between GNP per capita and applying all three of these tests with 100% of the blood units col-lected (Table 3, 2 = 2.907, P > 0.7, goodness-of-fit test).
Screening for T. cruzi infections (Chagas’ disease) is the screening least commonly done in Latin America, with Mexico not screening close to 1 million units per year. Only Argentina, Brazil, El Salvador, Peru, Uruguay, and Venezuela report 100% screening for T. cruzi(Table 1).
Anguilla, Antigua, Belize, the British Virgin Islands, and Grenada have not implemented screening for HCV, and Bolivia tested only 49% of the blood units collected in 2000.
Overall, in 2001, over 99% of all the blood collected in the Region of the Americas was tested for HIV, HCV, and HBsAg. The prevalence of these three infectious markers is high
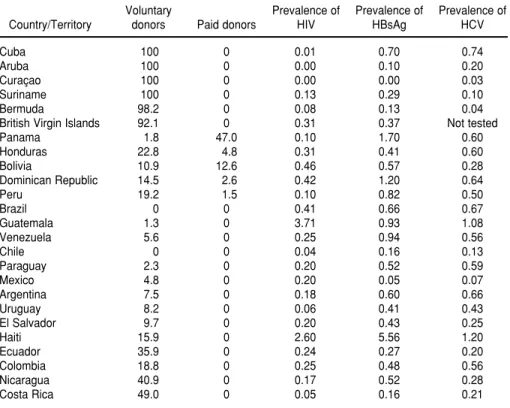
among the donors in Latin America and the Caribbean (Table 4). With the exception of Cuba, countries with more than 90% VNRA donors tend to have lower prevalences of these three markers.
Also as shown in Table 4, five coun-tries reported remunerated donors: Bolivia (12.6% of all blood donors), the Dominican Republic (2.6%), Hon-duras (4.8%), Panama (47.0%), and Peru (1.5%).
Quality of blood
A total of 35 countries made their data on the separation of blood units into components available to PAHO. For this article, only the data on the preparation of red blood cells were considered. Of these 35 countries, only 7 of them (Aruba, Canada, Curaçao, Panama, St. Lucia, Suriname, and the United States) reported preparing red blood cells from more than 90% of the units collected. The British Virgin Is-lands, Haiti, and the Turks and Caicos
Islands did not separate blood into components at all. The countries with more blood available (that is, higher donations rates) were also more likely to prepare red blood cells (Table 5, 2 = 8.7494, 0.2 > P > 0.1, goodness-of-fit test).
DISCUSSION
The overall availability of blood for transfusion in the Americas is low. Considering the 42 countries and terri-tories of the Region shown in Table 2, there is a total of just under 20 million units of blood collected annually for a population of a little over 815 million, for a donation rate of 24.5 units per 1 000 inhabitants. The blood donated in the Region of the Americas is 27% of the 75 million blood units available globally each year, according to the
Global Data Base on Blood Safety, a re-port from the WHO that contains data on the availability of blood in coun-tries around the world (11). While the WHO report differs from our analysis TABLE 3. Number of countries and territories in the Region of the Americas (grouped according to levels of gross national product per capita) with > 90% voluntary nonremunerated altruistic (VNRA) blood donors and with 100% screening for human immunodeficiency virus (HIV), hepatitis C virus (HCV), and hepatitis B surface antigen (HBsAg)a
> 10 000
5 000–9 999
3 000–4 999
2 000–2 999
1 000–1 999
< 1 000
aThe data shown are for either 2000 or 2001, depending on the particular country or territory. Gross national
product per
capita (US$) Countries/Territories
No. of countries/ territories with > 90% VNRA donors
No. of countries/territories with 100% screening for HIV,
HCV, and HBsAg
Aruba, Bahamas, Bermuda, British Virgin Islands, Canada, Cayman Islands, United States
Anguilla, Antigua, Argentina, Barbados, Curaçao, St. Kitts and Nevis, Turks and Caicos, Uruguay
Brazil, Chile, Mexico, St. Lucia, Trinidad and Tobago, Venezuela
Belize, Costa Rica, Dominica, Grenada, Panama, Peru, St. Vincent
Colombia, Cuba, Dominican Republic, Ecuador, El Salvador, Guatemala, Jamaica, Paraguay
Bolivia, Guyana, Haiti, Honduras, Nicaragua, Suriname
6
1
0
0
0
1
6
4
6
5
3
for the Americas in terms of specifi-cally how a country’s level of develop-ment is measured, both the WHO data and our data clearly indicate that countries with a higher level of eco-nomic development per capita have greater access to blood. This difference
is further magnified because collected blood is separated into its components more frequently in countries with bet-ter collection rates.
Patients from countries of the Americas with a lower GNP per capita have limitations as to the quantity of
blood available, and they are also more likely to receive whole blood when they are transfused. Paradoxically, countries in the Americas with a lower GNP per capita have proportionally more blood banks that actually collect blood than do countries with a higher GNP per capita. This shows that the efficiency of blood services in the Americas is higher in countries with more economic resources per capita. As shown in Table 2, the average number of blood units collected per blood bank in a year is 20 557 for the countries with a GNP per capita above US$ 10 000, and only 854 for those countries with a GNP per capita of less that US$ 1 000. To improve the utilization of resources in the Region of the Americas, efforts must be made to reduce the number of centers that collect and process blood. In addition to overcoming the scar-city of blood for transfusion in the Americas, its safety needs to be im-proved. The shortage of voluntary blood donors increases the risk of trans-fusion-transmitted infections, as shown by the higher prevalence rates of infec-tious markers in countries where the proportion of VNRA donors is lower. In the five countries where remuner-ated donors were reported, the annual donation rates were 3.00, 5.00. 5.30. 9.70, and 15.30 units of blood per 1 000 inhabitants. These rates show that pur-chasing blood does not necessarily lead to sufficiency for a country. On the con-trary, countries with paid donors tend to have prevalences of infectious mark-ers that are far above the prevalence levels found in countries with a high proportion of voluntary donors (Table 4). With more voluntary donors, fewer blood units are discarded and the blood-supply system is more efficient. This is particularly critical as the five countries that reported remunerated blood collection all fall in the lower GNP groupings in our study. Interven-tions to promote voluntary blood do-nation will result in increased blood availability and safety as well as in a more-efficient use of limited resources. Screening all blood units must be pursued as an attainable major and immediate goal for the Region of the TABLE 4. Types of donors (%) and prevalence (%) of markers for human immunodeficiency
virus (HIV), hepatitis C virus (HCV), and hepatitis B surface antigen (HBsAg) in 25 countries and territories in the Region of the Americas with informationa
Voluntary Prevalence of Prevalence of Prevalence of
Country/Territory donors Paid donors HIV HBsAg HCV
Cuba 100 0 0.01 0.70 0.74
Aruba 100 0 0.00 0.10 0.20
Curaçao 100 0 0.00 0.00 0.03
Suriname 100 0 0.13 0.29 0.10
Bermuda 98.2 0 0.08 0.13 0.04
British Virgin Islands 92.1 0 0.31 0.37 Not tested
Panama 1.8 47.0 0.10 1.70 0.60
Honduras 22.8 4.8 0.31 0.41 0.60
Bolivia 10.9 12.6 0.46 0.57 0.28
Dominican Republic 14.5 2.6 0.42 1.20 0.64
Peru 19.2 1.5 0.10 0.82 0.50
Brazil 0 0 0.41 0.66 0.67
Guatemala 1.3 0 3.71 0.93 1.08
Venezuela 5.6 0 0.25 0.94 0.56
Chile 0 0 0.04 0.16 0.13
Paraguay 2.3 0 0.20 0.52 0.59
Mexico 4.8 0 0.20 0.05 0.07
Argentina 7.5 0 0.18 0.60 0.66
Uruguay 8.2 0 0.06 0.41 0.43
El Salvador 9.7 0 0.20 0.43 0.25
Haiti 15.9 0 2.60 5.56 1.20
Ecuador 35.9 0 0.24 0.27 0.20
Colombia 18.8 0 0.25 0.48 0.56
Nicaragua 40.9 0 0.17 0.52 0.28
Costa Rica 49.0 0 0.05 0.16 0.21
aThe data shown are for either 2000 or 2001, depending on the particular country or territory.
TABLE 5. Separation of blood into components (data for red blood cells (RBCs) only) according to donation rate in 35 countries and territories of the Region of the Americasa
Donation rate Number of countries/territories Number of countries/territories (units per 1 000 pop.) with information with > 90% separation (RBCs)
≥21 6 4
12.5–20.9 7 1
11.5–12.9 6 1
9.0–11.4 4 0
5.0–8.9 7 1
< 4.99 5 0
Americas. Now, under 1% of the units collected in the Region are not tested for HIV, HCV, and HBsAg, and the high number of units not tested for
T. cruziis contributed mainly by Mex-ico. With a few exceptions, such as HCV in some Caribbean countries and Chagas’ disease in Mexico, the inabil-ity of the systems to screen for infec-tious agents is mostly associated with a limited stock of blood in the blood banks and not with a lack of labora-tory reagents. Promoting voluntary blood donation and reducing the num-ber of blood processing centers will facilitate universal screening. Never-theless, it is also necessary to consider the appropriateness of the kits used to screen donated blood for infectious
agents as well as the performance of the testing centers.
Reducing the number of blood collec-tion centers would improve access to both laboratory technology and quali-fied personnel. This step would also have a positive impact on the recruit-ment of VNRA donors because it would remove the pressure of blood collection from hospitals, where the requirement for blood replacement is strongly rooted. The role that the ministries of health play in setting the direction for blood systems is indispensable for the proper allocation and use of resources needed to attain sufficiency in the blood supply as well as the highest possible levels of safety and quality of blood used for transfusions in the Region.
An-alyzing the actual financial costs of the current blood-supply processes would allow for better planning as well as in-vestment in VNRA donation programs, blood collection infrastructure, and training of personnel. All of these things are vitally needed in order to improve the availability, safety, and quality of blood used for transfusion in the Region of the Americas.
Acknowledgments. The authors
acknowledge the contribution of the coordinators of the national blood pro-grams from the Latin American coun-tries and the directors of the national blood banks from the Caribbean for providing the data from each of their countries to PAHO.
1. United Nations Development Programme. Human development report 2001. Making new technology work for human develop-ment. New York: Oxford University Press; 2001.
2. World Bank. World development report 2000/2001. Attacking poverty. New York: Ox-ford University Press; 2001.
3. Pan American Health Organization, Special Program for Health Analysis. Health situation in the Americas. Basic indicators 2000. Wash-ington, D.C.: PAHO; 2001.
4. Collazo Herrera M, Cárdenas Rodríguez J, González López R, Miyar Abreu R, Gálvez González AM, Cosme Casulo J. La economía de la salud: ¿debe ser de interés para el campo sanitario? Rev Panam Salud Publica 2002; 12(5):359–364.
5. Hollán SR, Wagstaff W, Leikola J, Lothe F, eds. Gestión de servicios de transfusión de
sangre. Ginebra: Organización Mundial de la Salud; 1991.
6. International Federation of Red Cross and Red Crescent Societies. Making a difference. Recruiting voluntary, non-remunerated blood donors. Geneva: IFRCRCS; 2002.
7. Organización Panamericana de la Salud, Di-visión de Desarrollo de Sistemas y Servicios de Salud. Estándares de trabajo para bancos de sangre. Washington, D.C.: OPS; 1999. (Serie de Medicamentos Esenciales y Tecnología, Publi-cación 7).
8. Caribbean Epidemiology Centre. Caribbean regional standards for blood banks and trans-fusion services. Port of Spain, Trinidad: CAREC; 1999.
9. World Health Organization. The clinical use of blood in medicine, obstetrics, paediatrics, surgery & anaesthesia, trauma & burns. Geneva: WHO; 1999.
10. Lentner C, ed. Geigy scientific tables. Vol. 2. Introduction to statistics, statistical tables, mathematical formulae. Basel, Switzerland: Ciba-Geigy Corporation, Medical Education Division; 1982.
11. World Health Organization, Department of Blood Safety and Clinical Technology. Global data base on blood safety. Summary report 1998–1999. Geneva: WHO; 2001.
Manuscript received 16 December 2002 and accepted for publication on 2 January 2003.
Objetivos. Este artículo tiene dos objetivos: 1) presentar para los países y territorios americanos datos acerca del número de donaciones de sangre, la proporción de donantes voluntarios y remunerados, la cobertura con pruebas para el tamizaje de agentes infecciosos y la separación de sangre donada en sus diversos componentes, y 2) explorar las relaciones entre estas características y factores económicos y de orga-nización en los países y territorios.
Métodos. Llevamos a cabo análisis comparativos usando información poblacional y
sanitaria obtenida anualmente por la Organización Panamericana de la Salud (OPS) de las autoridades de salud de los países de las Américas, así como información económica (producto nacional bruto (PNB) per cápita) sacada de publicaciones del Banco Mundial.
Resultados. Hay una correlación directa entre la disponibilidad de sangre para transfundir y el PNB per cápita. Siete países con un PNB per cápita mayor de US$ 10 000 anuales representan 38% de la población de la Región, pero 68% de las donaciones en esta. La donación voluntaria de sangre es más común en países donde hay más disponibilidad de sangre. No hay ninguna asociación entre el PNB per cápita y la cobertura con pruebas para el tamizaje de agentes infecciosos. No obstante, de los seis países con un PNB per cápita menor de US$ 1 000, solamente uno somete a tamizaje todas las unidades de sangre para la detección del virus de la inmunodefi-ciencia humana (VIH), el virus de la hepatitis C (HCV), y el antígeno superficial del virus de la hepatitis B (HBsAg). Los países con una mayor proporción de donantes voluntarios suelen tener una menor prevalencia de positividad a marcadores de in-fección. La separación de la sangre en sus diversos componentes es también más fre-cuente en países con tasas más elevadas de donación de sangre.
Conclusiones. La disponibilidad, seguridad y calidad de la sangre para transfusión en países de las Américas deben mejorarse. Como parte de una iniciativa de este tipo, hay que poner en marcha políticas y estrategias nacionales a fin de lograr que los recursos ya adjudicados a los servicios de transfusión de sangre sean mejor aprovechados.
RESUMEN
Disponibilidad, seguridad
y calidad de la sangre para
transfusión en las Américas
Call for Nominations
2003 Fred L. Soper Award for Excellence in Health Literature
The Pan American Health and Education Foundation (PAHEF), which is a partner organiza-tion of the Pan American Health Organizaorganiza-tion, is accepting suggesorganiza-tions of outstanding scientific-journal articles on public health in the Region of the Americas that were published in 2002. PAHEF will grant the winning article the 2003 Fred L. Soper Award for Excellence in Health Literature.
To be nominated, an article must have been published in a scientific journal that is listed in the Index Medicus(MEDLINE). Authors must have a principal affiliation with a teaching, research, or service institution located in the Region of Americas. Preference is given to studies involving more than one discipline and to papers related to infectious disease. Eligible papers may consist of a report, an analysis of new data (experimental or observational), or a new approach to analyz-ing available data. The award consists of a certificate of merit and a cash prize of US$ 2 500.
Nominations must be received by 30 June 2003.
Information:
Fred L. Soper Award Committee Pan American Health and Education Foundation 525 Twenty-third Street, N.W. Washington, D.C. 20037
Phone: 202-974-3416 • Fax: 202-974-3636 E-mail: [email protected]