Article
J. Braz. Chem. Soc., Vol. 23, No. 4, 670-677, 2012. Printed in Brazil - ©2012 Sociedade Brasileira de Química 0103 - 5053 $6.00+0.00
A
*e-mail: [email protected]
Caffeine Determination at a Carbon Fiber Ultramicroelectrodes by
Fast-Scan Cyclic Voltammetry
Ronaldo S. Nunesa and Éder T. G. Cavalheiro*,b
aDepartamento de Física e Química, Faculdade de Engenharia de Guaratinguetá,
Universidade Estadual Paulista, Av. Ariberto Pereira da Cunha 333, 12516-410 Guaratinguetá-SP, Brazil
b Instituto de Química de São Carlos, Universidade de São Paulo,
Av. Trabalhador São-Carlense 400, CP 780, 13566-590 São Carlos-SP, Brazil
A possibilidade de determinação eletroanalítica de cafeína com ultramicroeletrodo de fibra de carbono (CF-UME), utilizando voltametria de varredura rápida, foi avaliada. Os CF-UMEs foram submetidos a pré-tratamentos eletroquímicos. Parâmetros como o número de ciclos para cálculo da média, velocidade de varredura, intervalo de potencial e o tipo de pré-tratamento superficial foram otimizados. Sob condições otimizadas, foi possível alcançar intervalo linear de resposta entre 10,0 e 200 µmol L-1, obtendo limites de detecção de 3,33 µmol L-1. O método foi aplicado à determinação de cafeína em amostras comerciais de fármacos, com erros entre 1,0 e 3,5% em relação ao valor do rótulo e valores de adição e recuperação de 97-114%.
Caffeine determination using a fast-scan voltammetric procedure at a carbon fiber ultramicroelectrode (CF-UME) is described. The CF-UME was submitted to electrochemical pretreatment. Parameters such as number of acquisition cycles, scan rate, potential window, and the electrochemical surface pretreatment were optimized. Using the optimized conditions, it was possible to achieve a LDR from 10.0 up to 200 µmol L-1, with a LOD of 3.33 µmol L-1. The method has been applied in the determination of caffeine in commercial samples, with errors of 1.0-3.5% in relation to the label values and recoveries of 97-114% within the linear range.
Keywords: caffeine, carbon fiber ultramicroelectrode, fast scan voltammetric determinations
Introduction
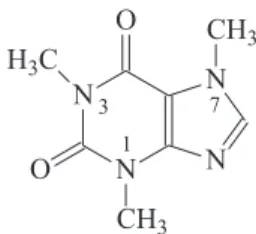
Caffeine (1,3,7-trimethylxanthine, Figure 1) is a methylxanthine derivative that is widely ingested by drinking coffee, cola-beverages, pharmaceutical formulations, energetic drinks and tea, acting as a diuretic and stimulant of the central nervous and cardiovascular
systems.1 Caffeine is considered to be a risk factor for
cardiovascular diseases and may affect behavior by causing depression and hyperactivity. All these considerations have led to an increased interest in the development of reliable methods for the evaluation and the quantification of caffeine
in food, pharmaceutical products2-5 and of course, biological
samples.6-8
Chromatographic methods for purine determination
including caffeine are summarized in a review9 and, some
methods of the caffeine analysis were presented by
de-Maria and Moreira.10
Although the advantages of chromatographic procedure in the analysis of caffeine and other purines, electrochemical
procedures can represent an interesting alternative for in
vivo or biological fluid analysis with low waste generation
and lower analysis costs.
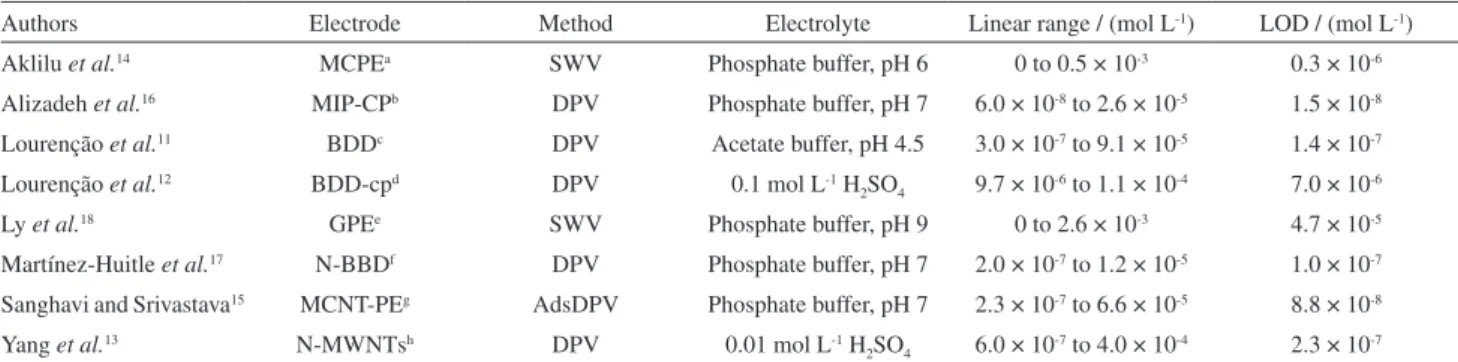
Some recent electrochemical methods and the respective analytical parameters used in caffeine analysis
are summarized in a Table 1, including references.11-18
Previously reported19-23 electrochemical methods
based on stripping of Cu(II) complexes and adsorptive
stripping of purines from Hg24 had also been presented. The
performance of rough pyrolitic graphite and carbon fiber ultramicroelectrodes in amperometric determination of some purines, including caffeine, in relation to the surface
activation can also be found.25,26
Unique properties of ultramicroelectrodes make them very attractive in electroanalytical measurements
that require high spatial and temporal resolution.27 At
ultramicroelectrodes, under typical slow scan rates of voltammetry, signal-to-noise ratios (S/N) can increase up to one decade because of efficient mass transport to the electrode resulting from edge effects. In addition, because of the small dimensions and low IR drop, fast scan
voltammetric procedures28-33 and measurements in highly
resistive media are possible at UMEs.34
According to Wightman and Wipf,31 fast scan
voltammetry is useful in preventing accompanying chemical reactions, understanding mechanism and kinetics of heterogeneous electron transfer, reduction in time of analysis, faster response to potential changes, minimizing in the size of devices for in vivo analysis, use of non-expensive instrumentation, among others.
The background current observed in fast scan voltammetry (FSV) in a blank solution is due to several processes, including double-layer charging, redox reactions of the surface functional groups, such as quinones, and redox reactions of impurities in the electrolyte solution. Thus, the magnitude of the background current may be more than two orders greater than that of the oxidation current of an analyte. Consequently, FSV requires a stable background current to produce a reliable background that can be used in background subtraction procedures. The
formation of oxides35 and the roughness of the electrode
surface can change during a voltammetric determination,
and these changes can produce significant modifications in the background current.
In this work, highly active carbon fiber ultramicroelectrodes (CF-UME) were produced, to act as sensors in sensitive determinations of caffeine under physiological conditions. The main challenge in this work was to prepare an electrode capable of operating under fast scan rates in a relatively high anodic potential, in which caffeine is oxidized, allowing the background subtraction. The main advantages of using the CF-UME in this case are the possibility of sensor miniaturizing as well as the speed of the measurements, for future in vivo or biological fluid analysis of caffeine.
In this sense any comparison with arrays and/or conventional sized electrode is difficult once they are
not suitable for in vivo determinations, although it is well
known that square-wave voltammetry in conventional
sized carbon electrodes led to µmol L-1 limit of detection
level, despite strong adsorption is noted in purine
analysis.25 On the other hand UME-arrays permit to reach
lower limits of detection, but are not always suitable for
in vivo analysis.
Experimental
Reagents and solutions
All chemicals were of analytical reagent grade. Monobasic sodium phosphate monohydrate (Mallinckrodt), anhydrous dibasic sodium phosphate (Mallinckrodt), potassium chloride (Mallinckrodt), potassium ferricyanide (Merck) and caffeine (Sigma) were used as received.
Stock caffeine solutions in the desired concentrations
were prepared daily just before use in 70.0 mmol L-1
phosphate buffer (pH 7.4). Potassium ferricyanide
5.0 × 10⁻³ mol L-1 was prepared in KCl 0.50 mol L-1. All
the determinations were performed at room temperature.
Table 1. Some electrochemical methods and their respective parameters
Authors Electrode Method Electrolyte Linear range / (mol L-1) LOD / (mol L-1)
Aklilu et al.14 MCPEa SWV Phosphate buffer, pH 6 0 to 0.5 × 10⁻³ 0.3 × 10⁻⁶
Alizadeh et al.16 MIP-CPb DPV Phosphate buffer, pH 7 6.0 × 10⁻⁸ to 2.6 × 10⁻⁵ 1.5 × 10⁻⁸
Lourenção et al.11 BDDc DPV Acetate buffer, pH 4.5 3.0 × 10⁻⁷ to 9.1 × 10⁻⁵ 1.4 × 10⁻⁷
Lourenção et al.12 BDD-cpd DPV 0.1 mol L-1 H
2SO4 9.7 × 10⁻⁶ to 1.1 × 10⁻⁴ 7.0 × 10⁻⁶
Ly et al.18 GPEe SWV Phosphate buffer, pH 9 0 to 2.6 × 10⁻³ 4.7 × 10⁻⁵
Martínez-Huitle et al.17 N-BBDf DPV Phosphate buffer, pH 7 2.0 × 10⁻⁷ to 1.2 × 10⁻⁵ 1.0 × 10⁻⁷
Sanghavi and Srivastava15 MCNT-PEg AdsDPV Phosphate buffer, pH 7 2.3 × 10⁻⁷ to 6.6 × 10⁻⁵ 8.8 × 10⁻⁸
Yang et al.13 N-MWNTsh DPV 0.01 mol L-1 H
2SO4 6.0 × 10⁻⁷ to 4.0 × 10⁻⁴ 2.3 × 10⁻⁷ aMCPE: 1,4-benzoquinone modified carbon paste electrode; bMIP-CP: molecularly imprinted polymer carbon paste electrode; cBDD: boron-doped diamond
electrode; dBDD-cp: boron-doped diamond cathodically pre-treatment electrode; eGPE: graphite pencil electrode; fN-BDD: nafion-modified boron-doped
diamond electrode; gMCNT-PE: in situ surfactant-modified carbon nanotube paste electrode; hN-MWNTs: nafion/multi-wall nanotubes composite
Electrodes
A saturated calomel electrode (SCE) was used as a
reference electrode, and a carbon fiber (7 µm diameter;
CTA, Brazil) was used as the working electrode.
Fabrication of carbon fiber ultramicroelectrodes
(CF-UME) followed a previously described procedure.36
Briefly, carbon fiber was first connected to a copper wire with silver epoxy (EPO-TEK 410E; Epoxy technology, USA). After the silver epoxy was cured for 24 h, the carbon fiber with the copper wire set was sealed in a micropipette tip with a polyurethane resin (Poliquil, Brazil). The CF-UME was left overnight at room temperature. After curing, the tip of the electrode was sanded off in a polishing wheel (Arotec, Brazil) using 600-grit silicon carbide paper (Arotec, Brazil), and finally the surface was gently polished in the polishing
wheel with 0.1 µm particle size γ-alumina suspension
(Arotec, Brazil). Before use, the polished electrodes were
sonicated37,38 in isopropyl alcohol and in doubly distilled
water during 5 min in each solvent. The response of the polished electrodes was tested by cyclic voltammetry with
5.0 mmol L-1 potassium ferricyanide in 0.5 mol L-1 KCl
solution at 50 mV s-1.
Electrochemical pretreatment of the CF-UME
In this work two electrochemical pretreatments were used and selected on the basis of the results in the FSV procedure. One was an adaptation of a mild procedure
proposed by Hernández and co-workers.36,39
Procedure adapted from Hernandez and co-workers36,39
proposal (H)
In this case the CF-UME was submitted to 120 cycles of
potential between 0.0 and +1.65V (vs. SCE) at 200 mV s-1
in 70 mmol L-1 phosphate buffer pH 7.4.
Procedure adapted from the Brajter-Toth and co-workers34
proposal (BT)
In this case the CF-UME was submitted to 4000 cycles of potential between –1.0 and +1.65 V or other desired
positive potential (vs. SCE) at 10 V s-1 in 70 mmol L-1
phosphate buffer pH 7.4.
Instrumental
The instrumental for FSV was a Potentiostat/Galvanostat PGSTAT30 from AUTOLAB (Eco Chemie) equipped with a Scan-Gen and an ADC-750 modulus for high scan and low current acquisition respectively. A two-electrode configuration cell was used inside a homemade Faraday
cage during the FSV measurements in order to minimize the environmental noise. It was not used any kind of electronic filter in all measurements.
For caffeine determinations, a chosen number of scans were recorded under a set of fixed experimental conditions such as scan rate, potential window and number of acquisition scans. The measured currents were averaged and stored.
Before each measurement, background currents were recorded in the supporting electrolyte without analyte, under exactly the same experimental conditions used in the analytical determinations of caffeine. These currents were stored, averaged and used latter for digital background subtraction from the caffeine voltammograms with the help of a personal computer.
The equipment used presents a certain compromise between the number of cycles and the scan rate. In the present case, if one acquire 190 cycles the maximum scan
rate admitted is limited to 100 V s-1 in the potential window
−1.0 to +1.65 V, due to the number of points to be stored
in the buffer memory and the response time.
Comparative chromatographic method
Chromatographic determinations were performed in a Shimadzu LC-10AD UP equipped with a SPD-M10A UP UV detector. The chromatographic conditions were C-18 column (5 m, 6 × 250 mm), detection wavelength 275 nm, water:methanol:acetic acid (69:28:3) mobile phase, flowing
at 1.0 mL min-1 in room temperature.
Results and Discussion
According to Hansen and Dryhurst40 and Spãtaru,41
in cyclic voltammetry, caffeine presents a single
oxidation peak at approximately +1.5 V (vs. SCE), due
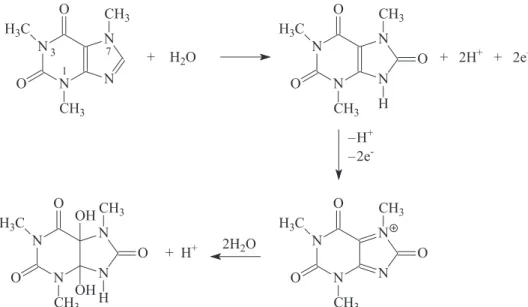
to an oxidation mechanism similar to xanthine, however without formation of uric acid since the nitrogen atoms at position 3 and 7 (Figure 1) are substituted. The oxidation occurs via a 4 electrons process resulting in a substituted uric acid (IV) that is not electroative. The mechanism proposed by the authors is represented in the reaction Scheme 1.
In order to establish a procedure for the determination of caffeine using a CF-UME at fast scan rate, several experimental parameters were optimized, as described below.
Evaluation of the pretreatment procedures performance
reproducible response. This is the basis of the background
subtraction procedure.42
According to McCreery and Cline43 the electrochemical
pretreatments are the easiest to perform in the CF-UME surface. However, although there are several different kinds of activation/stabilization procedures proposed in the literature, there is no hitherto general procedure to be used and a specific treatment should be used/optimized in each case.
The main challenge here is the relatively high anodic potential in which the caffeine oxidation peak is observed, in which the electrode must be stable and present a reproducible surface that allows one to have trustable background subtraction.
For instance two pretreatments were chosen to evaluate what was the best for this specific case. The best results were obtained with the BT procedure, which gave most reproducible results after the background subtraction. This is in agreement with previous results obtained for other
purines with this procedure.27
Evaluation of the best potential window for the electrochemical pretreatment and measurements
In relation to the original BT procedure, only the positive extreme potential was changed and evaluated since caffeine oxidizes irreversibly at potentials > +1.4 V
(vs. SCE), used as the upper limiting potential in the
original procedure. Figure 2 presents the background subtracted voltammograms averaged after 190 cycles for
500 µmol L-1 caffeine at CF-UMEs electrochemically
pretreated by the BT procedure, using different anodic limiting potentials.
Considering that at +1.5 V (vs. SCE) the peak is not
complete, the potential window was extended up +1.6,
+1.9 and +2.0 V (vs. SCE), resulting in a complete caffeine
oxidation peak. However there is a limit for this extension
since at +1.9 and +2.0 V (vs. SCE) as upper limits, the
response becomes less reproducible compromising the background subtraction.
Scheme 1. Mechanism of caffeine oxidation, proposed by Hansen and Dryhurst,40 and Spãtaru.41
Figure 2. Effect of the potential window used in the pre-treatment of the CF-UME in the background subtracted voltammograms of 500 µmol L-1
caffeine in phosphate buffer pH 7.4, using scan rate ν = 100 V s-1 and
Figure 3. Effect of the number of acquisition cycles for the better signal averaging. Caffeine concentration of 50 µmol L-1 in phosphate buffer
pH 7.4, ν = 100 V s-1, potential window of –1.0 to +1.65 V.
This could be related to an additional treatment of the electrode surface when submitted to higher limiting potentials during the measurements at E > +1.7 V (vs. SCE). The continuous surface change causes a non stable response
as previously reported.35
Thus a –1.0 to +1.65 V (vs. SCE) potential window was
chosen for further studies. Under this potential window, a well defined response could be found, without affecting the background subtraction.
Number of acquisition cycles and scan rate optimization
The number of cycles is an important feature in the background subtraction procedure, since few cycles result in highly noisy voltammogram while a larger number of cycles makes smaller the analytical frequency. Figure 3 presents how the number of cycles influences the peak
signal for caffeine determination (50 µmol L-1) at a
CF-UME pretreated by the BT procedure at 100 V s-1, in
the –1.0 to +1.65 V (vs. SCE) potential window.
This test led us to conclude that 190 cycles is enough to have a well defined signal with a relatively high sensitivity in relation to the other number of cycles investigated. It is important to point out that at the configuration available in the equipment used in this work, 190 cycles represent the upper limit of measurements that can be stored.
These results are in agreement with the discussion of
Hsueh et al.,37 showing that the definition of the number
of acquisition cycles for the average is fundamental in obtaining good results using the background subtraction procedure.
The effect of the scan rate in the background-subtracted voltammograms of caffeine is presented in Figure 4. It is possible to observe that as higher the scan rate better definition of the voltammograms can be achieved. According to some authors the higher scan rates prevents the fouling of the electrode surface. However, as in the optimization of the number of cycles,
100 V s-1 is the upper limit for the instrument used in
this work under the configuration used and the described conditions.
Caffeine’s analytical curve using FSV and the optimized parameters
Once established the experimental and instrumental parameters for data acquisition, within the instrumental limitations (Table 2), an analytical curve was obtained for
caffeine between 10 and 200 µmol L-1, which was linear in
the concentration range evaluated, obeying the equation 1:
Figure 4. Effect of scan rate on the voltammograms of 50 µmol L-1
I = –0.105 ×10⁻⁹ A + 94.86 × 10⁻³ A mol-1 L
(n = 6, R = 0.9981) (1)
with a limit of detection of 3.33 µmol L-1, considering the
equation 2
LOD = 3 sd blank/slope (2)
in which sd is the standard deviation of the blank signal and slope is the angular coefficient of the analytical curve,
according to Miller and Miller.44
Commercial samples analysis: standard addition procedure
These studies were performed to verify the possibility of using CF-UME for caffeine determination. As probe samples, pharmaceutical commercial tablets were proposed.
According to the Brazilian Pharmacopoea45 twenty tablets of
each sample were grinded and a selected amount equivalent to one tablet (average tablet mass) was dissolved and filtered in order to eliminate insoluble excipients.
Initially a recovery test was performed with one of
the samples, Cafiaspirina® (acetylsalicylic acid 650 mg +
caffeine 65 mg), in order to evaluate the performance of the developed procedure in the probe samples. The results are presented in Table 3. For each addition of caffeine five determinations were taken.
Recoveries between 97 and 114% were obtained. Considering the concentration level of caffeine in the sample and that the analysis was made directly in the matrix, without need of sample treatment, the results could be considered satisfactory and appropriate for the sample analysis.
Since Ohmic drop has not been compensated in the experiments, one should expect that differences could be observed when analyzing standard solutions and real samples. However, as in present work the standard addition
approach and a 70.0 mmol L-1 phosphate buffer supporting
electrolyte were used in all the determinations, this effect was probably minimized.
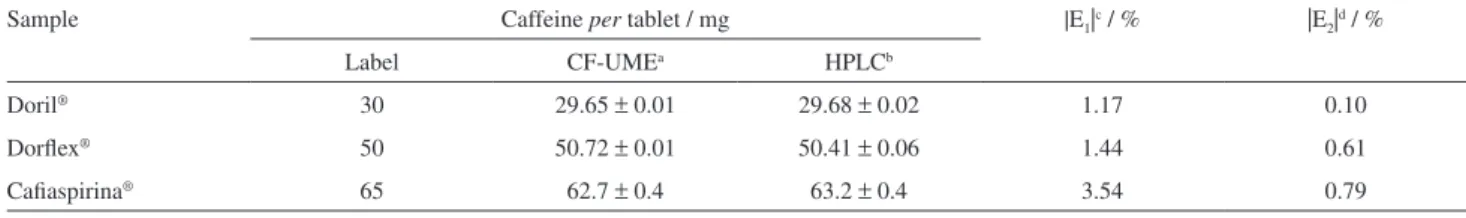
Thus, three pharmaceutical samples were analyzed using both the proposed fast scan voltammetric procedure at the CF-UME and a comparative chromatographic procedure. The results are presented in Table 4.
The results of standard addition suggested that the proposed procedure was appropriated for caffeine determination in commercial pharmaceutical samples with relative errors lower than 3.54 and 0.79% (in modulus) when compared with manufacturer’s claimed values and the reference HPLC procedure respectively.
According to the t-Student test the results from the
CF-UME voltammetric method and those from the chromatographic procedure agreed in the 95% confidence level for Doril® and Cafiaspirina®, while for Dorflex® they
agreed in 99.9%.
It is also important to point out that Cafiaspirina® and
Doril® samples contain acetylsalicylic acid in concentration
10 times higher than caffeine, while the Dorflex® tablet also
contains dipyrone (300 mg), orphenadrine citrate (35 mg)
and caffeine (50 mg).46 With the results obtained, one can
assert that interference from the other active principles present in the tablets in the analysis is negligible, using the standard addition approach.
As the proposal is a future use of the electrode for
in vivo determinations possible interferences from other
Table 2. Optimized set of experimental parameters for the determination of caffeine using the pre-treated CF-UME in a fast scan cyclic voltametry procedure
Parameters Studied range Optimum value
Pre treatment H and BT BT
Anodic potential limit / V 1.6-2.0 + 1.65
Number of the cycles 5-190 190
Scan rate / (V s-1) 20-100 100
Table 3. Results for recovery experiments for Cafiaspirina® sample
Additions [Caf] / (µmol L-1) Recoverya / %
Add Found
1 12.47 14 ± 2 110 ± 14
2 24.87 28 ± 5 114 ± 21
3 37.22 36 ± 3 97 ± 9
4 61.97 62 ± 6 99 ± 10
an = 5.
Table 4. Results obtained for standard addition
Sample Caffeine per tablet / mg |E1|c / % |E2|d / %
Label CF-UMEa HPLCb
Doril® 30 29.65 ± 0.01 29.68 ± 0.02 1.17 0.10
Dorflex® 50 50.72 ± 0.01 50.41 ± 0.06 1.44 0.61
Cafiaspirina® 65 62.7 ± 0.4 63.2 ± 0.4 3.54 0.79
an = 4; bn = 3; cE
ingredients present in more complex matrix should be considered in further studies. However, as caffeine oxidizes in a relatively high potential it is preserved from interferences in its own peak. Problems can be caused by adsorbed species or even oxidation/reduction products of these ingredients.
Conclusions
The BT adapted pretreateatment of the carbon fiber ultramicroelectrodes produces on CF-UME, a reproducible surface that allowed the background subtraction procedure even at higher anodic potential, which is sensitive in caffeine determinations under physiological conditions. High sensitivity of the new method of caffeine determinations that is shown here may facilitate the use of CF-UMEs with FSV technique, in the determination of caffeine in
biological samples and point to the potentiality for in vivo
analysis in the future. Although similar limits of detection have been found with other voltammetric techniques, it should be pointed out that using the CF-UME in this case allow sensor miniaturizing and faster measurements, without interference from other pharmaceuticals.
Acknowledgments
The authors acknowledge the financial supports of FAPESP/Brazil and a R. S. N. doctoral fellowship from CAPES.
References
1. Dryhurst, G.; Electrochemistry of Biological Molecules, Academic Press: New York, NY 1977.
2. Conte, E. D.; Barry, E. F.; Microchem. J. 1993, 48, 372. 3. Luque-Pérez, E.; Ríos, A.; Valcárcel, M.; Danielsson, L. G.;
Ingman, F.; Lab. Autom. Inf. Manage. 1999, 34, 131. 4. Zen, J. M.; Ting, Y. S.; Anal. Chim. Acta 1997, 342, 175. 5. Zen, J. M.; Ting, Y. S.; Shih, Y.; Analyst 1998, 123, 1145. 6. Fenske, M.; Chromatographia 2007, 65, 233.
7. Wang, A.; Sun, J.; Feng, H.; Gao, S.; He, Z.; Chromatographia
2008, 67, 281.
8. Hyotylainen, T.; Sirén, H.; Riekkola, M-L.; J. Chromatogr., A
1996, 735, 439.
9. Simpson, R. C.; Brown, P. R.; J. Chromatogr. 1986, 379, 269. 10. de Maria, C. A. B.; Moreira, R. F. A.; Quim. Nova 2007, 30,
99.
11. Lourenção, B. C.; Medeiros, R. A.; Rocha-Filho, R. C.; Mazo, L. H.; Fatibello-Filho, O.; Electroanalysis 2010, 22, 1717. 12. Lourenção, B. C.; Medeiros, R. A.; Rocha-Filho, R. C.; Mazo,
L. H.; Fatibello-Filho, O.; Talanta 2009, 78, 748.
13. Yang, S.; Yang, R.; Li, G.; Qu, L.; Li, J.; Yu, L.; J. Electroanal. Chem. 2010, 639, 77.
14. Aklilu, M.; Tessema, M.; Redi-Abshiro, M.; Talanta 2008, 76, 742.
15. Sanghavi, B. J.; Srivastava, A. K.; Electrochim. Acta 2010, 55, 8638.
16. Alizadeh, T.; Ganjali, M. R.; Zare, M.; Norouzi, P.; Electrochim. Acta 2010, 55, 1568.
17. Martínez-Huitle, C. A.; Fernandes, N. S.; Ferro, S.; de Battisti, A.; Quirozi, M. A.; Diamond Relat. Mater. 2010, 19, 1188. 18. Ly, S. Y.; Jung, Y. S.; Kim, M. H.; Han, I. K.; Jung, W. W.; Kim,
H. S.; Microchim. Acta 2004, 146, 207.
19. Glodowski, S.; Bilewicz, R.; Kublik, Z.; Anal. Chim. Acta 1986, 186, 39.
20. Househam, B. C.; Van den Berg, C. M. G.; Riley, J. P.; Anal. Chim. Acta 1987, 200, 291.
21. Shubietah, R. M.; Abu Zuhri, A. Z.; Fogg, A. G.; Electroanalysis
1995, 7, 975.
22. Ibrahim, M. S.; Ahmed, M. E.; Kawde, A. M.; Temerk, Y. M.; Analusis 1996, 24, 6.
23. Ibrahim, M. S.; Ahmed, M. E.; Temerk, Y. M.; Kawde, A. M.; Anal. Chim. Acta 1996, 328, 47.
24. Palacek, E.; Anal. Biochem. 1980, 108, 129.
25. Cavalheiro, E. T. G.; Brajter-Toth, A.; J. Pharm. Biomed. Anal.
1999, 19, 217.
26. Pons, S.; Fleischmann, M.; Anal. Chem. 1987, 59, 1391A. 27. Hsueh, C. C.; Brajter-Toth, A.; Anal. Chem. 1993, 65, 1570. 28. Howell, J. O.; Wightman, R. M.; Anal. Chem. 1984, 56, 524. 29. Howell, J. O.; Gonçalves, J. M.; Amatore, C.; Klansinc, L.;
Wightman, R. M.; Kochi, J. M.; J. Am. Chem. Soc. 1984, 106, 3968.
30. Wightman, R. M.; Wipf, D. O. In Electroanalytical Chemistry: A Series of Advances; Bard, A. J., ed.; Marcel Dekker: New York, 1989, vol. 15.
31. Wightman, R. M.; Wipf, D. O.; Acc. Chem. Res. 1990, 23, 64. 32. Wipf, D. O.; Kristensen, E. R.; Deakin, M. R.;Wightman, R. M.;
Anal. Chem. 1988, 60, 306.
33. Cavalheiro, E. T. G.; El-Nour, K. A.; Brajter-Toth, A.; J. Braz. Chem. Soc. 2000, 11, 512.
34. Bravo, R.; Hsueh, C. C.; Jamarillo, A.; Brajter-Toth, A.; Analyst
1998, 123, 1625.
35. Brajter-Toth, A.; Abou El-Nour, K.; Cavalheiro, E. T. G.; Bravo, R.; Anal. Chem. 2000, 72, 1576.
36. Hernández, P.; Sánchez, I.; Patón, F.; Hernández, L.; Talanta
1998, 46, 985.
37. Hsueh, C. C.; Bravo, R.; Jaramillo, A.; Brajter-Toth, A.; Anal. Chim. Acta 1997, 349, 67.
38. Abou El-Nour, K.; Brajter-Toth, A.; Electroanalysis 2000, 12, 805.
40. Hansen, B. H.; Dryhurst, G.; J. Electroanal. Chem. 1971, 30, 417.
41. Spãtaru, N.; Sarada, B. V.; Tryk, D. A.; Fujishima, A.; Electroanalysis 2002, 14, 721.
42. Wightman, R. M.; May, L. J.; Michael, A. C.; Anal. Chem. 1988, 60, 769A.
43. McCreery, R. L.; Cline, K. K. In Laboratory Techniques in Electroanalytical Chemistry; Kissinger, P. T.; Heineman, W. R., eds.; Marcel Dekker: New York, 1996, ch. 10.
44. Miller, J. C.; Miller, J. N.; Statistics for Analytical Chemistry, 2nd ed.; Ellis Horwood: West Sussex, 1988.
45. Farmacopéia Brasileira, Parte 1, 4a. ed., Atheneu: São Paulo, SP, Brasil, 1988.
46. BPR Guia de Remédios 2010/2011, 10a. ed., Escala: São Paulo, SP, Brasil, 2010.
Submitted: August 8, 2011
Published online: February 23, 2012