Printed in Brazil - ©2005 Sociedade Brasileira de Química 0103 - 5053 $6.00+0.00
A
rti
c
le
* e-mail: [email protected]
A Linear Solvation Energy Relationship to Predict Vapor Pressure from Molecular Structure
Frank H. Quina*
,a,
Felix A. Carroll
band Daniel M. Cheuy
ba
Instituto de Química, Universidade de São Paulo, CP 26077, 05513-970 São Paulo-SP, Brazil and Centro de
Capacitação e Pesquisa em Meio Ambiente, Universidade de São Paulo, São Paulo-SP Brazil
b
Department of Chemistry, Davidson College, Davidson, NC 28035, USA
Pressões de vapor de líquidos orgânicos (em Pa
a 298 K) correlacionam (
R
2= 0.986)
segundo a relação:
log
P
vap= 7.86 – 3.54
V
– 1.17
E
– 1.52 (
S
+
λ
) – 3.64 (
η
×
A
×
B
)
sendo
V
,
E
,
S
,
A
, e
B
parâmetros empíricos para o volume molar, o índice de refração em excesso, a
dipolaridade/polarizabilidade e a capacidade doadora e receptora de pontes de hidrogênio do soluto,
respectivamente. O parâmetro
λ
ajusta o valor do termo em
S
para grupos funcionais específicos,
enquanto considera diferenças na formação de pontes de hidrogênio entre classes distintas de líquidos
puros. Essa relação linear de energia livre (LSER) é quimicamente razoável e permite a previsão da
pressão de vapor de líquidos orgânicos a partir de parâmetros de soluto conhecidos ou estimados a
partir de estrutura química. Esses resultados ilustram o potencial de uso de parâmetros de soluto para
desenvolver LSERs para a previsão de propriedades de substâncias puras.
Vapor pressures (in Pa at 298 K) of organic liquids were found to correlate (
R
2= 0.986) with
empirical molecular parameters by the relationship:
log
P
vap= 7.86 – 3.54
V
– 1.17
E
– 1.52 (
S
+
λ
) – 3.64 (
η
×
A
×
B
)
where
V
,
E
,
S
,
A
, and
B
are solute parameters developed by Abraham and coworkers representing,
respectively, the characteristic volume, excess index of refraction, dipolarity/polarizability, and
hydrogen bond donor and acceptor characteristics of the solute. The parameter
λ
provides for
modulation of the
S
term for specific functional groups, such as those with strongly dipolar structures,
while the parameter
η
takes into account differences in neat-liquid hydrogen bonding between
classes of liquids. This linear free energy relationship (LSER), together with appropriate solute
parameters taken from literature data or estimated from chemical structure, provides a convenient
method for estimating the vapor pressure of pure organic liquids. This study also provides insight
into the extent to which the LSER model may be extended to the prediction of properties of pure
substances.
Keywords
: LSER, vapor pressure, organic liquids, Abraham parameters, hydrogen bonding
Introduction
The dispersal of organic liquids in the environment
depends on their physical properties, especially their volatility
and their solubility in water.
1It is therefore of central
importance in environmental studies to be able to predict
these properties when experimental values are not available.
2While these properties can sometimes be estimated on the
basis of known physical constants, such as boiling point and
heat of vaporization
3or by computational methods,
4it is
particularly useful to have available methods to estimate these
properties by inspection of molecular structure, without
recourse to other experimental values or to computational
results. In the present work, we examine the potential
advantages and limitations of employing a Linear Solvation
Energy Relationship (LSER) approach for the estimation of
the vapor pressure of organic liquids at 298 K.
As introduced by Kamlet and Taft
5and subsequently
developed by Abraham,
6the LSER approach characterizes
solvation effects in terms of nonspecific
(orientation-independent) and hydrogen bonding interactions. Thus, a
solvation property of interest (
P
) for an organic solute is
modeled by a linear free energy relationship of the form
7P
=
c
+
v V
+
e
E
+
s
S
+
a A + b B
(1)
1011
A Linear Solvation Energy Relationship to Predict Vapor Pressure
Vol. 16, No. 5, 2005
system being studied. The non-specific interactions are
represented by
V
, the characteristic volume
8of the
molecule, which is taken to be a measure of cavitation and
generalized dispersion interactions; by
E
, the excess molar
refraction of the compound relative to that of an aliphatic
hydrocarbon of the same molar volume, which is thought
to indicate the importance of interactions of molecules
through their pi- and
n
-electron pairs; and by
S
, a measure
of the dipolarity/polarizability of the solute.
9The specific
interactions are incorporated through the
A
and
B
parameters, which respectively represent the sums of the
hydrogen bond donor and hydrogen bond acceptor
characteristics of the solute. This LSER approach has been
used to develop predictive equations for a wide variety of
chromatographic and phase transfer processes.
10The Abraham method was developed to model
interactions of a set of solutes of diverse structure with a
single solvent system or their transfer between two solvents
or between a solvent and another phase. Recently, however,
we began to explore the viability of the LSER approach for
the estimation of physical properties of pure substances,
including the work of interfacial adhesion of organic liquids
with water
11and the surface tension of organic liquids.
12Along the same lines, Abraham has reported a correlation
for the solubility of neat organic compounds in water,
13and
recently Bel´skii reported a correlation of vapor pressure
along the lines of equation 1 but with an additional
V
2term.
9All of the applications discussed in the preceding
paragraph represent significant departures from the original
Abraham model because for each compound the
surrounding solvent molecules are different for each solute
molecule in the neat liquid. In each of these cases a
reasonable LSER was reported, however, suggesting that
applying the Abraham method to pure liquids has some
validity. It is therefore important to understand more fully
the basis for the apparent validity of the extended Abraham
model and, even more important, to determine the
limitations of this approach.
Of all the phase changes involving neat liquids,
vaporization should provide the most sensitive test of the
extent to which the parameters used in a LSER-type
correlation can appropriately model the intermolecular
interactions present in a neat liquid. Therefore we have
undertaken a study of the extent to which vapor pressure
values correlate with the empirical solute parameters of
Abraham. The results reported here provide a useful method
for estimating the vapor pressures of organic compounds
from their structures. In addition, the results both lead to a
better understanding of the limitations of using LSER
methods to model the properties of pure substances and
also point to some methods to improve such correlations.
Results and Discussion
In order to avoid the complications of hydrogen
bonding in the initial phase of the study, we considered
first a group of 315 organic liquids having
A
values equal
to or near 0. The data set included alkanes, cycloalkanes,
alkenes, cycloalkenes, dienes, alkynes, benzene,
alkylbenzenes, alkylnaphthalenes, alkyl halides, aryl
halides, ethers, thioethers, aldehydes, ketones, esters,
mercaptans, tertiary amines, pyridines, nitriles, and nitro
compounds.
14The resulting correlation of log
P
vap
(in Pa,
at 298 K) with the three non-specific solute parameters, V,
E
, and
S
, is shown in equation 2.
15,16log
P
vap= 7.78 – 3.45
V
– 0.93
E
– 1.70
S
(2)
The fact that all of the coefficients in equation 2 are
negative is chemically reasonable because all
stabilizing intermolecular interactions decrease the
vapor pressure of a liquid.
9Additionally, equation 2
indicates that generalized dispersion is the dominant
factor in determining the vapor pressure of compounds
that do not hydrogen bond. That is, the effect of
dispersion (given by the product 3.45
V
) is greater than
that of either of the other interactions (0.93
E
or 1.70
S
)
for all of the compounds in the data set. In fact, the
contribution of dispersion averages 77% of the total
contribution of the
V
,
E
, and
S
interactions for all of the
compounds in the data set and is more than 50% for all
but three compounds.
17It is noteworthy that the correlation in equation 2 is so
good because, as noted above, the solvent is different for
each solute in the group. One might expect that the
interactions of a solute molecule with identical solvent
molecules would be similar for compounds that are close
homologs, but the results suggest that such interactions
are also similar among many different classes of
compounds. In order to test that conclusion more fully, we
checked for functional group-specific differences between
literature values of log
P
vapand those predicted with
equation 2. Such differences were indeed found for four
families of compounds. The predicted values of log
P
vapwere about 0.30 units too large for alkyl nitriles and about
0.41 units too large for alkyl nitro compounds.
Alkylbenzenes as a group gave predicted values about
0.24 units too low, and predicted values for
alkylnaphthalenes were about 0.27 units too small. These
systematic deviations are illustrated in Figure 1.
It has been suggested
18that deviation of a value for an
(as shown for nitromethane in equation 3), which could
result in hydrogen-bonding interactions.
19,20(3)
The equilibrium constant for conversion of nitromethane to
the nitronic acid in the gas phase is calculated to be 2.2 ×
10
-12, however, and tautomerization of a nitronic acid to the
isomeric alkane in the condensed phase is thought to be
essentially complete.
19Moreover, in aqueous solution and
at cellular
p
H, aci-tautomerization of secondary nitroalkanes
is much greater than that of primary nitroalkanes,
21but the
deviation between predicted and literature values of
P
vapin
the present study is much greater for 1-nitropropane than
for 2-nitropropane. In addition, the average deviation
between predicted and literature values of log
P
vapfor a
series of nitroalkanes is only slightly greater than the average
deviation observed for nitrobenzene,
m
-nitrotoluene, and
o
-nitrotoluene.
22Similarly, the average deviation between
literature and predicted values for a set of alkyl nitriles is
not much greater than that for nitrobenzene. Therefore
hydrogen bonding arising from tautomerization seems not
to explain our log
P
vapresults.
Both cyano and nitro aliphatic compounds have
significantly larger local dipole moments than do other
compounds in the data set. This observation suggested
that the lower than predicted vapor pressures of the nitriles
and nitro compounds might reflect an intrinsic limitation
of the
S
parameter as a descriptor for the properties of neat
liquids.
Thus, if
S
reflects primarily the non-specific
dipolar interactions of the solute with a surrounding
dielectric medium, it will fail to account adequately for
dipole-dipole interactions strong enough to cause some
transient ordering of molecules in the liquid state.
23An
LSER correlation such as equation 2, which uses
S
as the
only parameter for dipolar interaction, will therefore
overestimate the vapor pressures of nitriles and nitro
compounds, as we observed.
The situation is the opposite for nonpolar, aromatic
compounds. There is strong correlation (
R
2= 0.97) between
the
S
and
E
values of those alkylbenzenes and
alkylnaphthalenes in the data set. This correlation may
lead to an overestimation of the stabilization due to
dispersion interactions in the bulk liquid and consequently
to an underestimation of the vapor pressure, as observed
in Figure 1 for log
P
vapvalues predicted with equation 2.
The most direct way to compensate for the deviations
noted above is to apply a functional group-specific
adjustment (
λ
) to the
S
parameter for these four classes of
solutes. There is some precedent for this approach in the
use of the “polarization correction” parameter
δ
by Kamlet
et al. to predict octanol/water partition coefficients.
24Empirically, the best-fit values of
λ
were found to be +0.26
for aliphatic nitriles, +0.32 for nitro compounds, -0.20 for
benzene and alkylbenzenes, and –0.32 for
alkylnaphthalenes (with
λ
= 0 for all other classes of
compounds in the data set). For the former two, these
λ
values are qualitatively in line with the relative order of
the magnitudes of the local dipole moments, and the
λ
values for the latter two follow the order of the
polarizabilities of phenyl vs. naphthyl rings. The resulting
correlation, given by equation 4, showed a substantial
improvement in the
F
value and in the standard error of
the prediction. Moreover, there was a substantial increase
in the partial
F
values and a notable decrease in the standard
errors of the coefficients of
E
and (
S
+
λ
) for the whole data
set, again consistent with the proposed origin of the
deviations for the four classes identified above.
log
P
vap= 7.86 – 3.54
V
– 1.17
E
– 1.52 (
S
+
λ
)
(4)
(
n
= 315,
R
2= 0.985,
F
= 6930, standard error = 0.145)
For compounds having values of both
A
and
B
significantly greater than 0, hydrogen bonding is expected
to be the dominant type of specific interaction in the neat
liquid. As in previous work,
11,12we included the parameter
A
×
B
to model the overall strength of hydrogen-bond
interaction in the correlation (equation 5) for a data set of
1013
A Linear Solvation Energy Relationship to Predict Vapor Pressure
Vol. 16, No. 5, 2005
376 compounds, which consisted of the original data set
plus 61 alcohols, phenols, and amines.
25The resulting
correlation is shown in equation 5.
log
P
vap= 7.92 – 3.58
V
– 1.15
E
– 1.53 (
S
+
λ
) – 5.75 (
A
×
B
)
(5)
(
n
= 376,
R
2= 0.978,
F
= 4088, standard error = 0.159)
Inspection of these results again revealed some interesting
functional group-specific deviations between predicted and
literature values. The predicted values of log
P
vapfor primary
alcohols were consistently about 0.37 units too large, while
those for primary amines were about 0.37
units too small
(Figure 2). Predicted values for secondary alcohols were close
to the experimental values, while those for secondary amines
were about 0.32 units too small (Figure 3).
The simplest explanation for these discrepancies is that
the product of the
A
and
B
values for a particular solute
does not adequately quantify the hydrogen bonding
interactions present in the neat liquid because of
pronounced steric effects on self-association. Indeed, steric
influences on hydrogen bonding have been reported
previously for neat alcohols, phenols, and amines.
26The
most expedient way of correcting a LSER for steric effects
on hydrogen bonding in neat liquids is by the inclusion of
a scaling factor,
η
, as an empirical hydrogen-bonding index.
Setting the value of
η
to 2.0 for primary alcohols resulted
in best-fit values of
η
(to the nearest 0.01 unit) of 1.43 for
secondary alcohols; 1.27 for tertiary alcohols, phenols,
and anilines; 0.61 for primary amines; and 0 for secondary
amines. Such values of
η
for the alcohols are reminiscent
of the 2.0 : 1.66 : 0.94 ratios reported for the relative
self-association constants for 1-propanol, propanol, and
2-methyl-2-propanol, respectively, in cyclohexane
solution.
26As with those equilibrium constants, the values
of
η
reflect the decrease in net stabilization of clustered
alcohol molecules as substitution around the hydroxyl
group increases. Inclusion of the
η
parameter results in
equation 6, which is a substantially better correlation than
that in equation 5. In addition, the coefficients for the
non-hydrogen bonding interaction terms in equation 6
are identical to those of equation 4, as would be expected
if the separation of the hydrogen-bonding and
non-hydrogen-bonding interactions described here is correct.
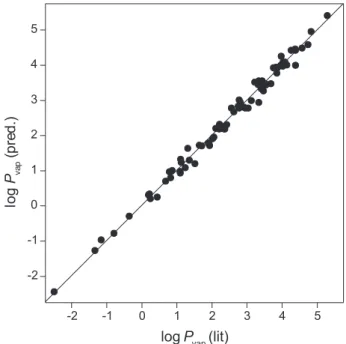
The results for all 376 compounds are plotted in Figure 4.
log
P
vap= 7.86 – 3.54
V
– 1.17
E
– 1.52 (
S
+
λ
) – 3.64 (
η
×
A
×
B
)
(6)
(
n
= 376,
R
2= 0.986,
F
= 6524, standard error = 0.148)
Equation 6 implicitly assumes that the attractive
intermolecular interactions present in the neat liquid are lost
when the liquid vaporizes. This assumption will not be true,
and thus equation 6 will not apply, for two categories of
compounds. The first includes compounds that are associated
in the vapor phase, typically as a result of hydrogen bonding.
For example, carboxylic acids have a strong tendency to
dimerize in the neat liquid and – for the more volatile aliphatic
Figure 2
. Correlation of literature values of log
P
vapand those
pre-dicted with equation 5 for primary alcohols (
Δ
) and primary amines
(
T
). The diagonal line represents a perfect correlation of literature
and predicted values.
carboxylic acids – even in the vapor phase.
27Since solute
parameters are available only for monomeric carboxylic acids,
values of log
P
vappredicted for carboxylic acids on the basis
of equation 6 would exhibit poor agreement with literature
values. The second category of compounds not well described
by equation 6 includes compounds such as 2-alkoxyalcohols
that exhibit some intramolecular hydrogen-bonding
interactions as monomers in the gas phase.
28In addition,
highly polar compounds that show enhanced dipole-dipole
attraction similar to that proposed for the nitriles and nitro
compounds would require determination of an appropriate
λ
value before equation 6 could be applied to them.
Although equation 6 was derived by using solutes for
which the appropriate parameters have been reported by
Abraham, it can also be used to estimate vapor pressure
from molecular structure. The
V
parameter can be calculated
easily from the number of atoms, bonds, and rings in the
molecule,
8and a neural network method has been used to
predict
S
.
29Values of
E
can be calculated from the refractive
index or computed from the molar refraction calculated at
the sodium D line (578 nm).
30In addition, several groups
have reported multiparametric linear regression and neural
network methods for the estimation of the
E
,
S
,
A,
and
B
parameters directly from molecular structure.
31,32An alternative approach for structures with a single
functional group is to estimate the parameters for the
compound from the parameters reported for analogous
structures. We did that for an additional 76
compounds for
which literature values of log
P
vapare available but for
which solute parameters had not been tabulated. The
additional compounds included a cycloalkane, alkenes,
alkynes, conjugated dienes, alkyl halides, alkylbenzenes,
alkylnaphthalenes, sulfides, disulfides, ethers, aldehydes,
ketones, mercaptans, amines, alcohols, and a phenol.
33As
shown in Figure 5, the correlation between predicted and
literature values is comparable (
R
2= 0.990, standard error
= 0.156
)
to that for compounds with known solute
parameters. Thus the use of equation 6, along with readily
accessible molecular solute parameters, offers a convenient
way to estimate the vapor pressure of many organic liquids
without recourse to experimentally determined values.
Conclusions
The linear free solvation relationship method, which
was developed to model the properties of a series of solutes
in a given solvent system, can be extended to the prediction
of physical properties of pure substances. However, it is
necessary to demonstrate that the LSER applies equally
well to all classes of compounds in the data set by looking
for functional group-specific deviations from the overall
correlation. Such deviations can be accommodated by the
inclusion of additional parameters, but only if the chemical
interpretation of such additional parameters is both clear
and reasonable, as with the
η
and
λ
parameters developed
here. This approach led to the development of equation 6,
Figure 4
. Correlation of values of predicted with equation 6 with
literature log
P
vapvalues for all 376 compounds in the data set. The
diagonal line represents a perfect correlation of literature and
pre-dicted values.
1015
A Linear Solvation Energy Relationship to Predict Vapor Pressure
Vol. 16, No. 5, 2005
which provides a convenient method for estimating the
vapor pressure of pure organic liquids on the basis of solute
parameters that can be found in the literature or deduced
from molecular structure.
Acknowledgements
Financial and fellowship support from FAPESP (Fundação
de Amparo à Pesquisa do Estado de São Paulo), CAPES
(Coordenação de Aperfeiçoamento de Pessoal de Nível
Superior), CNPq (Conselho Nacional de Desenvolvimento
Científico e Tecnológico), and Davidson College (sabbatical
leave for FAC) are gratefully acknowledged. This work was
performed in part during a visiting professorship (FHQ) at
Wake Forest University, Winston-Salem, NC.
Supplementary Information
Empirical solute parameters and log
P
vapvalues for the
compounds used to develop the LSER in equation 4, a
table of empirical solute parameters estimated for specific
functional groups, empirical solute parameters and log
P
vapvalues for the compounds used to develop the LSER shown
in Figure 5, and partial
F
values for the parameters in
equations 2 and 4. This material is available free of charge
via the Internet at http://jbcs.sbq.org.br.
References
1. Manahan, S. E.;
Fundamentals of Environmental Chemistry
,
Lewis Publishers: Boca Raton, 1993.
2. Boethling, R. S.; Mackay, D.;
Handbook of Property Estimation
Methods for Chemicals: Environmental and Health Sciences
,
Lewis Publishers: Boca Raton, 2000.
3. For an introduction to and comparison of several methods, see
Lyman, W. J.; Reehl, W. F.; Rosenblatt, D. H.;
Handbook of
Chemical Property Estimation Methods
, McGraw-Hill: New York,
1982; Schwarzenbach, R. P.; Geschwend, P. M.; Imboden, D.
M.;
Environmental Organic Chemistry
, 2
nded., Wiley-Interscience:
Hoboken, NJ, 2002, chapter 4. See also Mackay, D.; Bobra, A.;
Chan, D. W.; Shiu, W.Y.;
Environ. Sci. Technol.
1982
,
16
, 645.
4. See, for example, Katritzky, A. R.; Wang, Y.; Sild, S.; Tamm,
T.;
J. Chem. Inf. Comput. Sci.
1998
,
38
, 720; McClelland, H.
E.; Jurs, P. C.;
J. Chem. Inf. Comput. Sci.
2000
,
40
, 967;
Chalk, A. J.; Beck, B.; Clark, T.;
J. Chem. Inf. Comput. Sci.
2001
,
41
, 1053.
5. Kamlet, M. J.; Abboud, J. L. M.; Taft, R. W.;
Prog. Phys. Org.
Chem.
1981
,
13
, 485.
6. Abraham, M. H.;
Chem. Soc. Rev.
1993
, 73.
7. Abraham, M. H.; Gola, J. M. R.; Cometto-Muniz, J. E.; Cain,
W. S.;
J. Chem. Soc., Perkin Trans. 2
2000
, 2067.
8. Abraham, M. H.; McGowan, J. C.;
Chromatographia
1987
,
23
, 243. See also the note on p. 83 of reference 6 regarding
the counting of rings and bonds in the structure.
9. Bel´skii, V. E.;
Russian Chem. Bull.
2002
,
51
, 2008. (
CA
138:169822). The physical significance of the
V
2term was
not discussed.
10. For examples and leading references, see reference 6; Abraham,
M. H.; Martins, F.;
J. Pharm. Sci
.
2004
,
93
, 1508; Abraham,
M. H.;
J. Environ. Monit.
2003
,
5
, 747; Monarrez, C. I.;
Acree, W. E., Jr.; Abraham, M. H.;
Phys. Chem. Liq.
2002
,
40
,
581; Abraham, M. H.; Zissimos, A, M.; Acree, W, E., Jr.;
Phys.
Chem. Chem. Phys.
2001
,
3
, 3732.
11. Freitas, A. A.; Quina, F. H.; Carroll, F. A.;
J. Phys. Chem. B
1997
,
101
, 7488.
12. Freitas, A. A.; Quina, F. H.; Carroll, F. A.;
Langmuir
2000
,
16
,
6689.
13. Abraham, M. H.; Le, J.;
J. Pharm. Sci.
1999
,
88
, 868.
14. Some haloalkanes had
A
values near 0.15, and terminal alkynes
had
A
values near 0.12. Most other compounds had
A
values
of 0, but a few had values around 0.05. A full listing of the
compounds and their solute parameters is provided in the
Supplementary Information.
15. Values of
P
vapand molecular dipole moments were obtained
from the DIPPR database (available from DIPPR 801 Project,
350 CB, Brigham Young University, Provo, UT 84602). Values
of the Abraham parameters were obtained from Abraham, M.
H.; Chadha, H. S.; Whiting, G. S.; Mitchell, R. C.;
J. Pharm.
Sci.
1994
,
83
, 1085 or from reference 6.
16. We also considered that the form of the correlation might be
log
P
vap=
c
–
ν
V
2–
e
E
2–
s
S
2but we found that replacing
any of the three parameters in equation 2 with the square of that
parameter made the resulting correlation worse instead of better.
17. Those three compounds are nitromethane, acetonitrile, and
pyrimidine, and even for these compounds the contribution
of dispersion is greater than 40% of the total contribution of
the
V
,
E
, and
S
terms for each substance.
18. Kamlet, M. J.; Doherty, R. M.; Abraham, M. H.; Marcus, Y.;
Taft, R. W.;
J. Phys. Chem
.
1988
,
92
, 5244.
19. Nielsen, A. T. In
The Chemistry of the Nitro and Nitroso Groups
;
Feuer, H., ed.; Interscience: New York, 1969, Part 1, p. 349
.
20. Lammertsma, K.; Prasad, B. V.;
J. Am. Chem. Soc.
1993
,
115
,
2348.
21. Löfroth, G.; Nilsson, L.; Andersen, J. R.;
Prog. Clin. Biol. Res.
1986
,
209B
, 149.
23. Huyskens, P. L.;
J. Mol. Struct.
1989
,
198
, 123.
24. Kamlet
et al
.
18included the term (
π
* +
d
δ
), where
d
is a
function of the extent to which polarizability is a significant
contributor to the property being modeled.
25. The additional compounds included 30 alcohols, 21 alkyl
amines, 7 aryl amines and related compounds, and 3 phenols.
The complete list of compounds is given in the Supplementary
Information.
26. Frange, B.; Abboud, J.-L. M.; Benamou, C.; Bellon, L.;
J.
Org. Chem.
1982
,
47
, 4553. One possible reason that the
ratios of the
η
values we used deviate slightly from the ratios
of association constants is that the product (
A
×
B
) increases
from 1-propanol to 2-propanol to 2-methyl-2-propanol.
27. Jasperson, L. V.; Wilson, L. C.; Brady, C. J.; Wilding, W. V.;
Wilson, G. M.;
AIChE Symposium Series
1989
,
85
, 102;
Curtiss, L.A.; Blander, M.;
Chem. Rev.
1988
,
88
, 827.
28. See, for example, Yasuda, T.; Ikawa, S.;
J. Chem. Soc., Faraday
Trans.
1997
,
93
, 1869; Kowski, K.; Luttke, W.; Rademacher,
P.;
J. Mol. Struct.
2001
,
567-568
, 231.
29. Soil, D.;
Š
ev
č
ík, J. G. K.; Kvasnika, V.;
J. Chem. Inf. Comput.
Sci
.
1997
,
37
, 338.
30. Lima, G. A. R.;
PhD. Thesis
, Universidade de São Paulo, Brazil,
2000.
31. Platts, J. A.; Butina, D.; Abraham, M. H.; Hersey, A.;
J. Chem.
Inf. Comput. Sci.
1999
,
39
, 835; Abraham, M. H.; Platts, J. A.;
J. Org. Chem.
2001
,
66
, 3484; Jover, J.; Bosque, R.; Sales, J.;
J. Chem. Inf. Comput. Sci.
2004
,
44,
1098.
32. A referee has pointed out that the solute parameters can also
be calculated with commercial software available from Pharma
Algorithms.
33. The specific compounds, their estimated parameters, and the
predicted and literature values of log
P
vapare given in the
Supplementary Information.
Received: February 10, 2005
Published on the web: August 3, 2005
J. Braz. Chem. Soc., Vol. 00, No. 00, 1-xx, 2005. Printed in Brazil - ©2005 Sociedade Brasileira de Química 0103 - 5053 $6.00+0.00
S
u
p
p
le
m
e
nta
ry
I
nf
o
rm
a
ti
o
n
* e-mail: [email protected]
A Linear Solvation Energy Relationship to Predict Vapor Pressure from Molecular Structure
Frank H. Quina
*,a,
Felix A. Carroll
band Daniel M. Cheuy
ba
Instituto de Química, Universidade de São Paulo, CP 26077, 05513-970 São Paulo-SP, Brazil and Centro de
Capacitação e Pesquisa em Meio Ambiente, Universidade de São Paulo, São Paulo-SP Brazil
b
Department of Chemistry, Davidson College, Davidson, NC 28035, USA
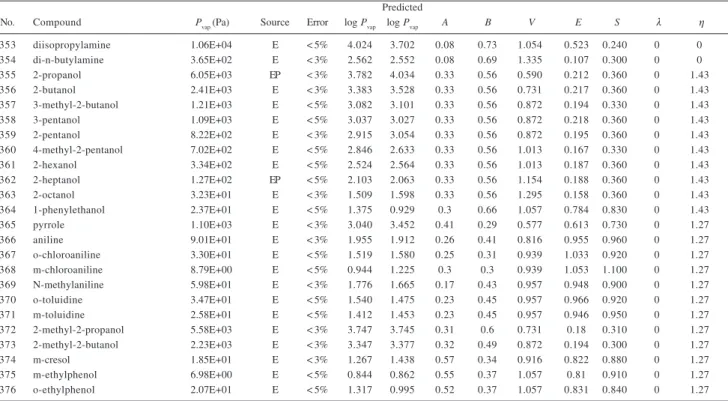
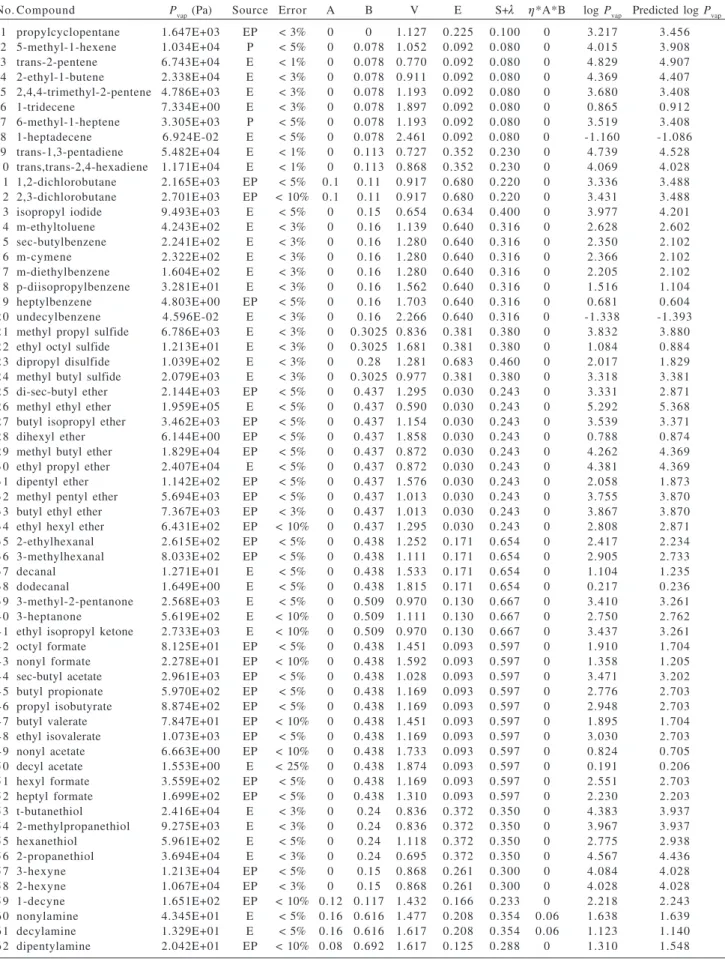
Table S1.
Parameters and log
P
vapvalues used to develop the LSER
Predicted
No. Compound Pvap (Pa) Source Error log Pvap log Pvap A B V E S λ η
1 n-pentane 6.84E+04 E < 3% 4.835 4.984 0 0 0.813 0 0 0 0
2 isopentane 9.17E+04 EP < 3% 4.962 4.984 0 0 0.813 0 0 0 0
3 n-hexane 2.03E+04 E < 3% 4.307 4.484 0 0 0.954 0 0 0 0
4 3-methylpentane 2.52E+04 E < 3% 4.402 4.484 0 0 0.954 0 0 0 0
5 n-heptane 6.07E+03 E < 3% 3.783 3.984 0 0 1.095 0 0 0 0
6 n-octane 1.87E+03 E < 3% 3.272 3.485 0 0 1.236 0 0 0 0
7 n-nonane 5.80E+02 E < 3% 2.764 2.986 0 0 1.377 0 0 0 0
8 n-decane 1.81E+02 E < 3% 2.258 2.486 0 0 1.518 0 0 0 0
9 n-undecane 5.56E+01 E < 3% 1.745 1.985 0 0 1.659 0 0 0 0
10 n-dodecane 1.79E+01 E < 3% 1.252 1.489 0 0 1.799 0 0 0 0
11 n-tridecane 5.69E+00 E < 1% 0.755 0.988 0 0 1.940 0 0 0 0
12 n-tetradecane 1.86E+00 E < 3% 0.270 0.489 0 0 2.081 0 0 0 0
13 n-pentadecane 6.55E-01 E < 3% -0.184 -0.011 0 0 2.222 0 0 0 0
14 n-hexadecane 1.99E-01 E < 3% -0.700 -0.510 0 0 2.363 0 0 0 0
15 n-heptadecane 6.62E-02 E < 5% -1.179 -1.009 0 0 2.504 0 0 0 0
16 4-methylnonane 3.09E+02 EP < 3% 2.490 2.486 0 0 1.518 0 0 0 0
17 2-methyloctane 8.44E+02 E < 3% 2.927 2.986 0 0 1.377 0 0 0 0
18 3-methyloctane 8.33E+02 EP < 3% 2.921 2.986 0 0 1.377 0 0 0 0
19 2-methylpentane 2.81E+04 E < 3% 4.449 4.484 0 0 0.954 0 0 0 0
20 2-methylhexane 8.77E+03 E < 3% 3.943 3.984 0 0 1.095 0 0 0 0
21 3-methylhexane 8.19E+03 E < 3% 3.913 3.984 0 0 1.095 0 0 0 0
22 2-methylheptane 2.75E+03 E < 3% 3.439 3.485 0 0 1.236 0 0 0 0
23 3-methylheptane 2.61E+03 E < 3% 3.417 3.485 0 0 1.236 0 0 0 0
24 4-methylheptane 2.73E+03 E < 3% 3.436 3.485 0 0 1.236 0 0 0 0
25 3-ethylhexane 2.68E+03 E < 3% 3.428 3.485 0 0 1.236 0 0 0 0
26 3-methylnonane 2.64E+02 EP < 3% 2.421 2.486 0 0 1.518 0 0 0 0
27 2-methylnonane 2.51E+02 EP < 3% 2.400 2.486 0 0 1.518 0 0 0 0
28 5-methylnonane 2.94E+02 EP < 3% 2.468 2.486 0 0 1.518 0 0 0 0
29 4-methyloctane 9.10E+02 EP < 3% 2.959 2.986 0 0 1.377 0 0 0 0
30 3-methylundecane 2.57E+01 EP < 10% 1.411 1.489 0 0 1.799 0 0 0 0
31 neopentane 1.71E+05 E < 1% 5.234 4.984 0 0 0.813 0 0 0 0
32 2,2-dimethylbutane 4.27E+04 E < 3% 4.631 4.484 0 0 0.954 0 0 0 0
33 2,3-dimethylbutane 3.13E+04 E < 3% 4.496 4.484 0 0 0.954 0 0 0 0
34 2,2-dimethylpentane 1.40E+04 E < 3% 4.147 3.984 0 0 1.095 0 0 0 0
35 2,3-dimethylpentane 9.17E+03 E < 3% 3.962 3.984 0 0 1.095 0 0 0 0
36 2,4-dimethylpentane 1.31E+04 E < 3% 4.118 3.984 0 0 1.095 0 0 0 0
37 3,3-dimethylpentane 1.10E+04 E < 3% 4.042 3.984 0 0 1.095 0 0 0 0
38 2,2-dimethylhexane 4.54E+03 E < 3% 3.657 3.485 0 0 1.236 0 0 0 0
39 2,3-dimethylhexane 3.13E+03 E < 3% 3.495 3.485 0 0 1.236 0 0 0 0
40 2,4-dimethylhexane 4.05E+03 E < 1% 3.607 3.485 0 0 1.236 0 0 0 0
41 2,5-dimethylhexane 4.04E+03 E < 3% 3.606 3.485 0 0 1.236 0 0 0 0
Table S1.
(cont.)
Predicted
No. Compound Pvap (Pa) Source Error log Pvap log Pvap A B V E S λ η
43 3,4-dimethylhexane 2.89E+03 E < 1% 3.461 3.485 0 0 1.236 0 0 0 0
44 2,2-dimethyloctane 4.85E+02 E < 3% 2.686 2.486 0 0 1.518 0 0 0 0
45 2,2-dimethylheptane 1.53E+03 EP < 5% 3.183 2.986 0 0 1.377 0 0 0 0
46 2,4,4-trimethylhexane 1.79E+03 EP < 5% 3.253 2.986 0 0 1.377 0 0 0 0
47 3-ethylpentane 7.75E+03 E < 3% 3.890 3.984 0 0 1.095 0 0 0 0
48 2,2,3-trimethylbutane 1.37E+04 E < 3% 4.135 3.984 0 0 1.095 0 0 0 0
49 2-methyl-3-ethylpentane 3.19E+03 E < 3% 3.503 3.485 0 0 1.236 0 0 0 0 50 3-methyl-3-ethylpentane 3.06E+03 E < 3% 3.486 3.485 0 0 1.236 0 0 0 0
51 2,2,3-trimethypentane 4.28E+03 E < 1% 3.631 3.485 0 0 1.236 0 0 0 0
52 2,2,4-trimethylpentane 6.58E+03 E < 3% 3.818 3.485 0 0 1.236 0 0 0 0
53 2,3,3-trimethylpentane 3.60E+03 E < 3% 3.556 3.485 0 0 1.236 0 0 0 0
54 2,3,4-trimethylpentane 3.62E+03 E < 3% 3.558 3.485 0 0 1.236 0 0 0 0
55 2,2,5-trimethylhexane 2.22E+03 E < 3% 3.347 2.986 0 0 1.377 0 0 0 0
56 3,3,5-trimethylheptane 5.57E+02 EP < 3% 2.746 2.486 0 0 1.518 0 0 0 0
57 3,3-diethylpentane 9.72E+02 EP < 3% 2.988 2.986 0 0 1.377 0 0 0 0
58 2,2,3,3-tetramethylpentane 1.27E+03 E < 3% 3.103 2.986 0 0 1.377 0 0 0 0 59 2,2,3,4-tetramethylpentane 1.69E+03 EP < 5% 3.228 2.986 0 0 1.377 0 0 0 0 60 2,2,4,4-tetramethylpentane 2.67E+03 E < 3% 3.427 2.986 0 0 1.377 0 0 0 0 61 2,3,3,4-tetramethylpentane 1.18E+03 E < 5% 3.073 2.986 0 0 1.377 0 0 0 0 62 2,2,3,3-tetramethylhexane 1.81E+02 E < 3% 2.258 2.486 0 0 1.518 0 0 0 0 63 2,2,5,5-tetramethylhexane 5.37E+02 EP < 3% 2.730 2.486 0 0 1.518 0 0 0 0
64 3-ethylheptane 9.03E+02 P < 5% 2.956 2.986 0 0 1.377 0 0 0 0
65 cyclopentane 4.23E+04 E < 3% 4.627 4.908 0 0 0.705 0.263 0.100 0 0
66 cyclohexane 1.30E+04 E < 1% 4.115 4.363 0 0 0.845 0.305 0.100 0 0
67 cis-decalin 1.05E+02 E < 5% 2.019 2.242 0 0 1.300 0.544 0.250 0 0
68 trans-decalin 1.65E+02 E < 5% 2.218 2.362 0 0 1.300 0.467 0.230 0 0
69 cycloheptane 2.91E+03 E < 3% 3.464 3.809 0 0 0.986 0.35 0.100 0 0
70 cyclooctane 7.52E+02 E < 3% 2.876 3.237 0 0 1.127 0.413 0.100 0 0
71 methylcyclopentane 1.83E+04 E < 3% 4.263 4.456 0 0 0.845 0.225 0.100 0 0 72 methylcyclohexane 6.14E+03 E < 3% 3.788 3.934 0 0 0.986 0.244 0.100 0 0 73 cis-1,2-dimethylcyclohexane 1.93E+03 E < 3% 3.286 3.391 0 0 1.127 0.281 0.100 0 0 74 trans-1,2-dimethylcyclohexane 2.58E+03 E < 3% 3.412 3.496 0 0 1.127 0.191 0.100 0 0
75 1-pentene 8.51E+04 E < 3% 4.930 4.906 0 0.07 0.770 0.093 0.080 0 0
76 2-methly-1-butene 8.13E+04 EP < 3% 4.910 4.941 0 0.07 0.770 0.063 0.080 0 0 77 2-methyl-2-butene 6.25E+04 E < 3% 4.796 4.829 0 0.07 0.770 0.159 0.080 0 0
78 1-hexene 2.47E+04 E < 3% 4.392 4.424 0 0.07 0.911 0.078 0.080 0 0
79 2-methyl-1-pentene 2.61E+04 E < 3% 4.416 4.410 0 0.07 0.911 0.09 0.080 0 0
80 1-heptene 7.51E+03 E < 3% 3.876 3.908 0 0.07 1.052 0.092 0.080 0 0
81 1-octene 2.33E+03 E < 3% 3.367 3.405 0 0.07 1.193 0.094 0.080 0 0
82 1-nonene 7.20E+02 E < 3% 2.857 2.910 0 0.07 1.334 0.09 0.080 0 0
83 1-decene 2.27E+02 E < 3% 2.355 2.409 0 0.07 1.475 0.093 0.080 0 0
84 1-undecene 6.71E+01 E < 3% 1.827 1.911 0 0.07 1.616 0.091 0.080 0 0
85 1-dodecene 2.65E+01 E < 3% 1.423 1.414 0 0.07 1.756 0.089 0.080 0 0
86 cyclohexene 1.19E+04 E < 3% 4.076 4.258 0 0.1 0.802 0.395 0.200 0 0
87 indene 1.45E+02 E < 5% 2.161 2.025 0 0.2 0.988 1.001 0.770 0 0
88 cis-2-pentene 6.60E+04 E < 1% 4.820 4.850 0 0.07 0.770 0.141 0.080 0 0 89 3-methyl-1-butene 1.20E+05 E < 3% 5.080 4.941 0 0.07 0.770 0.063 0.080 0 0
90 cyclopentene 5.04E+04 E < 3% 4.703 4.826 0 0.1 0.662 0.335 0.200 0 0
91 cycloheptene 3.34E+03 E < 3% 3.524 3.705 0 0.1 0.943 0.414 0.220 0 0
92 1-methylcyclopentene 1.55E+04 EP < 10% 4.190 4.332 0 0.1 0.802 0.33 0.200 0 0
93 1,3-butadiene 2.81E+05 E < 1% 5.449 5.065 0 0.1 0.586 0.32 0.230 0 0
3
A Linear Solvation Energy Relationship to Predict Vapor Pressure
Vol. 00, No. 00, 2005
Table S1.
(cont.)
Predicted
No. Compound Pvap (Pa) Source Error log Pvap log Pvap A B V E S λ η 105 chloroform 2.62E+04 E < 3% 4.418 4.437 0.15 0.02 0.617 0.425 0.490 0 0 106 1,1-dichloroethane 3.03E+04 E < 3% 4.481 4.493 0.1 0.1 0.635 0.322 0.490 0 0 107 1,2-dichloroethane 1.06E+04 E < 1% 4.027 4.155 0.1 0.11 0.635 0.416 0.640 0 0 108 1,1,2-trichloroethane 3.09E+03 EP < 3% 3.489 3.565 0.13 0.13 0.757 0.499 0.680 0 0 109 1,2-dichloropropane 6.89E+03 EP < 3% 3.838 3.769 0.1 0.11 0.776 0.371 0.600 0 0 110 1,1,1-trichloroethane 1.66E+04 E < 5% 4.221 4.128 0 0.09 0.757 0.369 0.410 0 0 111 1,1,1,2-tetrachloroethane 1.60E+03 E < 3% 3.205 3.155 0.1 0.08 0.880 0.542 0.630 0 0 112 1,1,2,2-tetrachloroethane 7.65E+02 E < 5% 2.884 2.896 0.16 0.12 0.880 0.595 0.760 0 0 113 isopropyl chloride 6.87E+04 EP < 5% 4.837 4.808 0 0.12 0.654 0.177 0.350 0 0 114 isosbutyl chloride 2.00E+04 E < 5% 4.301 4.261 0 0.12 0.795 0.191 0.370 0 0 115 2-chloro-2-methylpropane 4.09E+04 EP < 5% 4.612 4.501 0 0.12 0.795 0.142 0.250 0 0 116 trichloroethylene 9.83E+03 E < 3% 3.992 4.157 0.08 0.03 0.715 0.524 0.370 0 0 117 tetrachloroethylene 2.47E+03 E < 3% 3.393 3.484 0 0 0.837 0.639 0.440 0 0 118 allyl chloride 4.88E+04 EP < 5% 4.688 4.466 0 0.05 0.611 0.327 0.560 0 0 119 cis-1,2-dichloroethene 2.72E+04 E < 3% 4.435 4.329 0.11 0.05 0.592 0.436 0.610 0 0 120 trans-1,2-dichloroethene 4.45E+04 E < 5% 4.648 4.647 0.09 0.05 0.592 0.425 0.410 0 0 121 n-propyl chloride 4.59E+04 E < 3% 4.662 4.686 0 0.1 0.654 0.216 0.400 0 0 122 n-butyl chloride 1.35E+04 E < 3% 4.131 4.194 0 0.1 0.795 0.21 0.400 0 0 123 sec-butyl chloride 2.09E+04 E < 3% 4.321 4.294 0 0.12 0.795 0.189 0.350 0 0 124 1-chloropentane 4.36E+03 E < 3% 3.640 3.696 0 0.1 0.936 0.208 0.400 0 0 125 pentachloroethane 4.89E+02 E < 5% 2.690 2.554 0.17 0.06 1.002 0.648 0.660 0 0 126 1,1-dichloroethene 7.99E+04 E < 5% 4.903 4.827 0 0.05 0.592 0.362 0.340 0 0 127 ethyl iodide 1.80E+04 E < 3% 4.254 4.210 0 0.15 0.649 0.64 0.400 0 0 128 n-propyl iodide 5.74E+03 E < 3% 3.759 3.718 0 0.15 0.790 0.634 0.400 0 0 129 tribromomethane 7.34E+02 EP < 5% 2.866 2.948 0.15 0.06 0.775 0.974 0.680 0 0 130 1.3-dichloropropane 2.43E+03 EP < 5% 3.386 3.513 0 0.17 0.776 0.408 0.740 0 0 131 halothane 4.01E+04 E < 5% 4.603 4.541 0.15 0.05 0.741 0.102 0.380 0 0 132 methyl bromide 2.18E+05 E < 3% 5.339 5.239 0 0.1 0.425 0.399 0.430 0 0 133 bromoethane 6.30E+04 E < 3% 4.799 4.827 0 0.12 0.565 0.366 0.400 0 0 134 1-bromopropane 1.84E+04 E < 3% 4.266 4.327 0 0.12 0.706 0.366 0.400 0 0 135 2-bromopropane 2.89E+04 E < 3% 4.460 4.443 0 0.14 0.706 0.332 0.350 0 0 136 1-bromobutane 5.59E+03 E < 5% 3.748 3.835 0 0.12 0.847 0.36 0.400 0 0 137 1-bromoheptane 1.70E+02 E < 3% 2.229 2.355 0 0.12 1.270 0.343 0.400 0 0 138 methyl iodide 5.40E+04 E < 3% 4.732 4.622 0 0.13 0.508 0.676 0.430 0 0 139 dibromomethane 6.03E+03 EP < 3% 3.780 3.888 0.1 0.1 0.600 0.714 0.670 0 0 140 diiodomethane 1.60E+02 E < 5% 2.205 2.407 0.05 0.23 0.766 1.453 0.690 0 0 141 1-iodohexane 1.53E+02 EP < 10% 2.185 2.243 0 0.15 1.212 0.615 0.400 0 0 142 1-iodobutane 1.81E+03 E < 3% 3.258 3.227 0 0.15 0.930 0.628 0.400 0 0 143 benzyl chloride 1.74E+02 P < 3% 2.240 2.187 0 0.33 0.980 0.821 0.820 0 0 144 chlorobenzene 1.59E+03 EP < 5% 3.200 3.065 0 0.07 0.839 0.718 0.650 0 0 145 o-dichlorobenzene 1.81E+02 E < 3% 2.257 2.256 0 0.04 0.961 0.872 0.780 0 0 146 m-dichlorobenzene 2.86E+02 E < 3% 2.457 2.361 0 0.02 0.961 0.847 0.730 0 0 147 o-chlorotoluene 4.70E+02 EP < 3% 2.672 2.514 0 0.07 0.980 0.762 0.650 0 0 148 p-chlorotoluene 3.72E+02 EP < 5% 2.570 2.550 0 0.07 0.980 0.705 0.670 0 0 149 1,2,4-trichlorobenzene 5.74E+01 E < 3% 1.759 1.648 0 0 1.084 0.98 0.810 0 0 150 m-dibromobenzene 3.58E+01 EP < 10% 1.554 1.384 0 0.04 1.066 1.17 0.880 0 0 151 bromobenzene 5.68E+02 E < 3% 2.754 2.568 0 0.09 0.891 0.882 0.730 0 0 152 fluorobenzene 1.03E+04 E < 3% 4.012 3.840 0 0.1 0.734 0.477 0.570 0 0 153 benzotrifluoride 4.97E+03 E < 5% 3.696 3.647 0 0.1 0.910 0.225 0.480 0 0 154 iodobenzene 1.42E+02 E < 3% 2.151 1.777 0 0.12 0.975 1.188 0.820 0 0 155 methyl ethyl sulfide 2.13E+04 E < 3% 4.329 4.369 0 0.28 0.695 0.39 0.380 0 0 156 di-n-propyl sulfide 8.89E+02 E < 3% 2.949 2.907 0 0.32 1.118 0.358 0.380 0 0 157 diethyl sulfide 8.02E+03 E < 3% 3.904 3.889 0 0.32 0.836 0.373 0.380 0 0 158 dimethyl sulfide 6.46E+04 E < 3% 4.810 4.853 0 0.29 0.554 0.404 0.380 0 0
159 thiophene 1.05E+04 E < 3% 4.022 3.940 0 0.15 0.641 0.687 0.560 0 0
Table S1.
(cont.)
Predicted
No. Compound Pvap (Pa) Source Error log Pvap log Pvap A B V E S λ η 167 di-n-butyl ether 8.37E+02 EP < 5% 2.923 2.896 0 0.45 1.295 0 0.250 0 0 168 methyl n-propyl ether 6.10E+04 E < 5% 4.785 4.824 0 0.45 0.731 0.06 0.250 0 0 169 di-n-propyl ether 8.30E+03 E < 5% 3.919 3.801 0 0.45 1.013 0.08 0.250 0 0
170 anisole 4.83E+02 E < 3% 2.684 2.652 0 0.29 0.916 0.708 0.750 0 0
171 1,4-dioxane 5.09E+03 E < 1% 3.707 3.926 0 0.64 0.681 0.329 0.750 0 0 172 1,2-propylene oxide 7.13E+04 E < 5% 4.853 5.009 0 0.45 0.481 0.243 0.570 0 0
173 furan 8.00E+04 E < 3% 4.903 4.728 0 0.13 0.536 0.369 0.530 0 0
174 tetrahydrofuran 2.15E+04 E < 1% 4.333 4.532 0 0.48 0.622 0.289 0.520 0 0
175 propanal 4.25E+04 E < 3% 4.628 4.708 0 0.45 0.547 0.196 0.650 0 0
176 butanal 1.50E+04 E < 3% 4.175 4.219 0 0.45 0.688 0.187 0.650 0 0
177 2-methylpropanal 2.11E+04 EP < 3% 4.324 4.315 0 0.45 0.688 0.144 0.620 0 0
178 pentanal 4.58E+03 E < 5% 3.661 3.747 0 0.45 0.829 0.163 0.650 0 0
179 heptanal 5.12E+02 E < 5% 2.710 2.774 0 0.45 1.111 0.14 0.650 0 0
180 hexanal 1.45E+03 E < 5% 3.162 3.267 0 0.45 0.970 0.146 0.650 0 0
181 octanal 1.54E+02 E < 10% 2.187 2.251 0 0.45 1.252 0.16 0.650 0 0
182 nonanal 3.66E+01 E < 5% 1.564 1.767 0 0.45 1.392 0.15 0.650 0 0
183 trans-crotonaldehyde 4.42E+03 EP < 5% 3.645 3.910 0 0.5 0.645 0.387 0.800 0 0 184 o-tolualdehyde 6.34E+01 EP < 25% 1.802 1.796 0 0.4 1.014 0.87 0.960 0 0 185 p-tolualdehyde 3.38E+01 P < 5% 1.529 1.744 0 0.42 1.014 0.862 1.000 0 0 186 benzaldehyde 1.70E+02 E < 5% 2.229 2.293 0 0.39 0.873 0.82 1.000 0 0 187 m-tolualdehyde 4.50E+01 EP < 10% 1.653 1.816 0 0.42 1.014 0.84 0.970 0 0
188 acetone 3.08E+04 E < 3% 4.488 4.652 0.04 0.49 0.547 0.179 0.700 0 0
189 2-butanone 1.23E+04 E < 3% 4.090 4.167 0 0.51 0.688 0.166 0.700 0 0
190 3-pentanone 4.97E+03 E < 3% 3.697 3.742 0 0.51 0.829 0.154 0.660 0 0 191 methyl isobutyl ketone 2.65E+03 E < 10% 3.423 3.308 0 0.51 0.970 0.111 0.650 0 0 192 4-heptanone 7.71E+02 EP < 10% 2.887 2.791 0 0.51 1.111 0.113 0.660 0 0
193 3-hexanone 1.85E+03 E < 3% 3.268 3.264 0 0.51 0.970 0.136 0.660 0 0
194 2-pentanone 4.74E+03 E < 3% 3.676 3.725 0 0.51 0.829 0.143 0.680 0 0 195 methyl isopropyl ketone 2.65E+03 E < 10% 3.423 3.781 0 0.51 0.829 0.134 0.650 0 0
196 2-hexanone 1.55E+03 E < 3% 3.191 3.233 0 0.51 0.970 0.136 0.680 0 0
197 2-heptanone 5.21E+02 E < 3% 2.717 2.749 0 0.51 1.111 0.123 0.680 0 0 198 5-methyl-2-hexanone 6.93E+02 EP < 3% 2.841 2.805 0 0.51 1.111 0.114 0.650 0 0 199 3,3-dimethyl-2-butanone 4.27E+03 E < 10% 3.630 3.361 0 0.51 0.970 0.106 0.620 0 0
200 5-nonanone 7.93E+01 E < 5% 1.899 1.806 0 0.51 1.392 0.103 0.660 0 0
5
A Linear Solvation Energy Relationship to Predict Vapor Pressure
Vol. 00, No. 00, 2005
Table S1.
(cont.)
Predicted
No. Compound Pvap (Pa) Source Error log Pvap log Pvap A B V E S λ η 229 methyl acetate 2.86E+04 E < 1% 4.456 4.577 0 0.45 0.606 0.142 0.640 0 0 230 ethyl acetate 1.24E+04 E < 1% 4.094 4.150 0 0.45 0.747 0.106 0.620 0 0 231 n-propyl acetate 4.46E+03 E < 3% 3.649 3.697 0 0.45 0.888 0.092 0.600 0 0 232 n-butyl acetate 1.49E+03 E < 3% 3.174 3.225 0 0.45 1.028 0.071 0.600 0 0 233 isobutyl acetate 2.38E+03 E < 3% 3.376 3.293 0 0.47 1.028 0.052 0.570 0 0 234 isopentyl acetate 8.14E+02 E < 5% 2.910 2.794 0 0.47 1.169 0.051 0.570 0 0 235 allyl acetate 4.69E+03 EP < 5% 3.671 3.542 0 0.49 0.845 0.199 0.720 0 0 236 isopropyl acetate 8.05E+03 E < 3% 3.906 3.786 0 0.47 0.888 0.055 0.570 0 0 237 vinly acetate 1.51E+04 EP < 5% 4.179 4.136 0 0.43 0.704 0.223 0.640 0 0 238 n-pentyl acetate 5.63E+02 EP < 5% 2.751 2.729 0 0.45 1.169 0.067 0.600 0 0 239 benzyl acetate 2.11E+01 EP < 10% 1.323 1.029 0 0.65 1.214 0.789 1.060 0 0 240 n-hexyl acetate 1.76E+02 E < 5% 2.244 2.243 0 0.45 1.310 0.056 0.600 0 0 241 n-heptyl acetate 5.79E+01 E < 5% 1.762 1.750 0 0.45 1.451 0.05 0.600 0 0 242 n-octyl acetate 2.07E+01 EP < 10% 1.316 1.275 0 0.45 1.592 0.029 0.600 0 0 243 n-butyl benzoate 4.67E+00 E < 10% 0.670 0.570 0 0.46 1.495 0.668 0.800 0 0 244 methyl benzoate 5.03E+01 E < 5% 1.702 1.914 0 0.46 1.073 0.733 0.850 0 0 245 ethyl benzoate 3.81E+01 E < 5% 1.580 1.465 0 0.46 1.214 0.689 0.850 0 0 246 diethyl phthalate 6.64E-02 EP < 10% -1.178 -1.180 0 0.88 1.711 0.729 1.400 0 0 247 dimethyl phthalate 4.56E-01 E < 10% -0.341 -0.255 0 0.88 1.429 0.78 1.410 0 0 248 n-propyl benzoate 1.15E+01 EP < 10% 1.062 1.062 0 0.46 1.354 0.675 0.800 0 0 249 ethyl mercaptan 7.03E+04 E < 3% 4.847 4.912 0 0.24 0.554 0.392 0.350 0 0 250 n-propyl mercaptan 2.06E+04 E < 3% 4.313 4.421 0 0.24 0.695 0.385 0.350 0 0 251 n-hexyl mercaptan 5.96E+02 E < 5% 2.775 2.951 0 0.24 1.118 0.361 0.350 0 0 252 n-nonyl mercaptan 1.54E+01 E < 5% 1.187 1.469 0 0.24 1.540 0.347 0.350 0 0 253 n-octyl mercaptan 6.12E+01 E < 5% 1.787 1.962 0 0.24 1.399 0.353 0.350 0 0 254 n-pentyl mercaptan 1.84E+03 E < 3% 3.265 3.440 0 0.24 0.977 0.369 0.350 0 0 255 n-heptyl mercaptan 1.77E+02 E < 5% 2.247 2.458 0 0.24 1.258 0.357 0.350 0 0 256 n-butyl mercaptan 6.19E+03 E < 3% 3.791 3.925 0 0.24 0.836 0.382 0.350 0 0 257 phenyl mercaptan 2.02E+02 E < 3% 2.305 2.363 0.09 0.16 0.880 1 0.800 0 0
258 2-butyne 9.41E+04 E < 1% 4.974 5.027 0 0.15 0.586 0.261 0.300 0 0
259 1-pentyne 5.81E+04 EP < 3% 4.764 4.738 0.12 0.12 0.727 0.172 0.230 0 0
260 1-hexyne 1.77E+04 E < 5% 4.248 4.245 0.12 0.1 0.868 0.166 0.230 0 0
261 1-octyne 1.75E+03 EP < 5% 3.244 3.258 0.12 0.1 1.150 0.155 0.230 0 0 262 1-nonyne 4.94E+02 EP < 10% 2.694 2.764 0.12 0.1 1.291 0.15 0.230 0 0 263 phenylethyne 1.08E+03 EP < 10% 3.032 2.958 0.12 0.24 0.912 0.679 0.580 0 0
264 1-heptyne 5.56E+03 E < 5% 3.745 3.753 0.12 0.1 1.009 0.16 0.230 0 0
265 trimethylamine 2.16E+05 E < 5% 5.334 5.161 0 0.67 0.631 0.14 0.200 0 0 266 triethylamine 9.13E+03 E < 5% 3.960 3.783 0 0.79 1.054 0.101 0.150 0 0
267 quinoline 1.11E+01 E < 3% 1.047 1.211 0 0.54 1.044 1.268 0.970 0 0
268 pyridine 2.77E+03 E < 1% 3.443 3.459 0 0.52 0.675 0.631 0.840 0 0
269 N,N-dimethylaniline 9.72E+01 E < 3% 1.988 1.580 0 0.41 1.098 0.957 0.840 0 0 270 2-methylpyridine 1.51E+03 E < 3% 3.179 3.134 0 0.58 0.816 0.598 0.750 0 0
271 pyrimidine 2.25E+03 EP < 3% 3.352 3.389 0 0.7 0.634 0.606 1.000 0 0
Table S1.
(cont.)
Predicted
No. Compound Pvap (Pa) Source Error log Pvap log Pvap A B V E S λ η 291 benzene 1.26E+04 E < 1% 4.102 4.131 0 0.14 0.716 0.61 0.520 -0.201 0 292 toluene 3.80E+03 E < 3% 3.580 3.642 0 0.14 0.857 0.601 0.520 -0.201 0 293 o-xylene 8.86E+02 E < 3% 2.948 3.009 0 0.16 0.998 0.663 0.560 -0.201 0 294 m-xylene 1.12E+03 E < 3% 3.049 3.116 0 0.16 0.998 0.623 0.520 -0.201 0 295 p-xylene 1.17E+03 E < 3% 3.068 3.128 0 0.16 0.998 0.613 0.520 -0.201 0 296 ethylbenzene 1.28E+03 E < 3% 3.107 3.143 0 0.15 0.998 0.613 0.510 -0.201 0 297 o-ethyltoluene 3.39E+02 E < 3% 2.530 2.505 0 0.18 1.139 0.68 0.550 -0.201 0 298 p-ethyltoluene 3.98E+02 E < 3% 2.600 2.624 0 0.18 1.139 0.63 0.510 -0.201 0 299 1,2,3-trimethylbenzene 2.16E+02 E < 3% 2.335 2.357 0 0.19 1.139 0.728 0.610 -0.201 0 300 1,2,4-trimethylbenzene 2.87E+02 E < 3% 2.458 2.493 0 0.19 1.139 0.677 0.560 -0.201 0 301 cumene 6.09E+02 E < 3% 2.784 2.687 0 0.16 1.139 0.602 0.490 -0.201 0 302 n-propylbenzene 4.64E+02 E < 3% 2.666 2.669 0 0.15 1.139 0.604 0.500 -0.201 0 303 1,2,3,4-tetramethylbenzene 4.42E+01 EP < 5% 1.645 1.705 0 0.19 1.280 0.794 0.660 -0.201 0 304 tert-butylbenzene 2.91E+02 E < 3% 2.463 2.167 0 0.16 1.280 0.619 0.490 -0.201 0 305 isobutylbenzene 2.65E+02 E < 3% 2.423 2.243 0 0.15 1.280 0.58 0.470 -0.201 0 306 n-butylbenzene 1.43E+02 E < 3% 2.156 2.159 0 0.15 1.280 0.6 0.510 -0.201 0 307 n-pentylbenzene 4.39E+01 E < 5% 1.643 1.666 0 0.15 1.421 0.594 0.510 -0.201 0 308 n-hexylbenzene 1.46E+01 EP < 5% 1.164 1.185 0 0.15 1.562 0.591 0.500 -0.201 0 309 n-octylbenzene 1.49E+00 E < 5% 0.174 0.230 0 0.15 1.844 0.579 0.480 -0.201 0 310 n-decylbenzene 1.51E-01 E < 5% -0.822 -0.751 0 0.15 2.125 0.579 0.470 -0.201 0 311 styrene 8.17E+02 E < 1% 2.912 2.808 0 0.16 0.955 0.849 0.650 -0.201 0 312 ?-methylstyrene 3.57E+02 EP < 5% 2.552 2.321 0 0.19 1.096 0.851 0.640 -0.201 0 313 1-methylnaphthalene 1.00E+01 E < 3% 1.002 1.077 0 0.2 1.226 1.344 0.900 -0.324 0 314 1-ethylnaphthalene 3.32E+00 E < 5% 0.521 0.577 0 0.2 1.367 1.371 0.880 -0.324 0 315 2-ethylnaphthalene 4.23E+00 E < 10% 0.627 0.593 0 0.2 1.367 1.331 0.900 -0.324 0 316 methylamine 3.53E+05 E < 3% 5.548 5.603 0.16 0.58 0.349 0.25 0.350 0 0.61 317 ethylamine 1.40E+05 E < 3% 5.145 5.109 0.16 0.61 0.490 0.236 0.350 0 0.61 318 allylamine 3.23E+04 P < 5% 4.509 4.426 0.16 0.58 0.588 0.35 0.490 0 0.61 319 n-propylamine 4.13E+04 E < 3% 4.616 4.622 0.16 0.61 0.631 0.225 0.350 0 0.61 320 isopropylamine 7.79E+04 E < 3% 4.891 4.719 0.16 0.61 0.631 0.181 0.320 0 0.61 321 n-butylamine 1.24E+04 E < 3% 4.093 4.123 0.16 0.61 0.772 0.224 0.350 0 0.61 322 isobutylamine 1.86E+04 E < 3% 4.269 4.192 0.16 0.63 0.772 0.198 0.320 0 0.61 323 sec-butylamine 2.37E+04 EP < 5% 4.374 4.225 0.16 0.63 0.772 0.17 0.320 0 0.61 324 tert-butylamine 4.95E+04 E < 5% 4.695 4.300 0.16 0.71 0.772 0.121 0.290 0 0.61 325 n-pentylamine 4.00E+03 EP < 3% 3.602 3.639 0.16 0.61 0.913 0.211 0.350 0 0.61 326 cyclohexylamine 1.34E+03 E < 5% 3.127 3.082 0.16 0.58 0.945 0.326 0.560 0 0.61 327 benzylamine 8.82E+01 EP < 5% 1.945 2.011 0.1 0.72 0.957 0.829 0.880 0 0.61 328 n-hexylamine 1.21E+03 E < 5% 3.084 3.155 0.16 0.61 1.054 0.197 0.350 0 0.61 329 n-heptylamine 4.45E+02 E < 5% 2.649 2.655 0.16 0.61 1.195 0.197 0.350 0 0.61 330 n-octylamine 1.34E+02 E < 5% 2.128 2.171 0.16 0.61 1.335 0.187 0.350 0 0.61 331 methanol 1.68E+04 E < 1% 4.226 4.334 0.43 0.47 0.308 0.278 0.440 0 2
332 ethanol 7.92E+03 E < 1% 3.899 4.077 0.37 0.48 0.449 0.246 0.420 0 2
7
A Linear Solvation Energy Relationship to Predict Vapor Pressure
Vol. 00, No. 00, 2005
Table S1.
(cont.)
Predicted
No. Compound Pvap (Pa) Source Error log Pvap log Pvap A B V E S λ η 353 diisopropylamine 1.06E+04 E < 5% 4.024 3.702 0.08 0.73 1.054 0.523 0.240 0 0 354 di-n-butylamine 3.65E+02 E < 3% 2.562 2.552 0.08 0.69 1.335 0.107 0.300 0 0 355 2-propanol 6.05E+03 EP < 3% 3.782 4.034 0.33 0.56 0.590 0.212 0.360 0 1.43 356 2-butanol 2.41E+03 E < 3% 3.383 3.528 0.33 0.56 0.731 0.217 0.360 0 1.43 357 3-methyl-2-butanol 1.21E+03 E < 5% 3.082 3.101 0.33 0.56 0.872 0.194 0.330 0 1.43 358 3-pentanol 1.09E+03 E < 5% 3.037 3.027 0.33 0.56 0.872 0.218 0.360 0 1.43 359 2-pentanol 8.22E+02 E < 3% 2.915 3.054 0.33 0.56 0.872 0.195 0.360 0 1.43 360 4-methyl-2-pentanol 7.02E+02 E < 5% 2.846 2.633 0.33 0.56 1.013 0.167 0.330 0 1.43 361 2-hexanol 3.34E+02 E < 5% 2.524 2.564 0.33 0.56 1.013 0.187 0.360 0 1.43 362 2-heptanol 1.27E+02 EP < 5% 2.103 2.063 0.33 0.56 1.154 0.188 0.360 0 1.43 363 2-octanol 3.23E+01 E < 3% 1.509 1.598 0.33 0.56 1.295 0.158 0.360 0 1.43 364 1-phenylethanol 2.37E+01 E < 5% 1.375 0.929 0.3 0.66 1.057 0.784 0.830 0 1.43 365 pyrrole 1.10E+03 E < 3% 3.040 3.452 0.41 0.29 0.577 0.613 0.730 0 1.27 366 aniline 9.01E+01 E < 3% 1.955 1.912 0.26 0.41 0.816 0.955 0.960 0 1.27 367 o-chloroaniline 3.30E+01 E < 5% 1.519 1.580 0.25 0.31 0.939 1.033 0.920 0 1.27 368 m-chloroaniline 8.79E+00 E < 5% 0.944 1.225 0.3 0.3 0.939 1.053 1.100 0 1.27 369 N-methylaniline 5.98E+01 E < 3% 1.776 1.665 0.17 0.43 0.957 0.948 0.900 0 1.27 370 o-toluidine 3.47E+01 E < 5% 1.540 1.475 0.23 0.45 0.957 0.966 0.920 0 1.27 371 m-toluidine 2.58E+01 E < 5% 1.412 1.453 0.23 0.45 0.957 0.946 0.950 0 1.27 372 2-methyl-2-propanol 5.58E+03 E < 3% 3.747 3.745 0.31 0.6 0.731 0.18 0.310 0 1.27 373 2-methyl-2-butanol 2.23E+03 E < 3% 3.347 3.377 0.32 0.49 0.872 0.194 0.300 0 1.27 374 m-cresol 1.85E+01 E < 3% 1.267 1.438 0.57 0.34 0.916 0.822 0.880 0 1.27 375 m-ethylphenol 6.98E+00 E < 5% 0.844 0.862 0.55 0.37 1.057 0.81 0.910 0 1.27 376 o-ethylphenol 2.07E+01 E < 5% 1.317 0.995 0.52 0.37 1.057 0.831 0.840 0 1.27 Explanation of column headings: Values of Pvap are calculated from DIPPR equation 101, using the constants given for a specific compound. The source of the constants is experimental (E), predicted (P), or a combination of the two (EP). The error is the maximum percent error of the resulting Pvap values as determined by DIPPR. Predicted log Pvap is the value of log Pvap calculated using equation 6 and the solute parameters A, B, V, E, S, λ, and η. The sources of the parameters A, B, V, E, and S are given in the text, and the values ofλ, and η are taken from the manuscript.
Table S2.
Solute parameters estimated from molecular structure
*Compound Class
A
B
S
Alkane
0
0
0
Cycloalkane
0
0
0.13
Acyclic Alkene
0
0.08
0.12
Cycloalkene
0
0.03
0.08
Conjugated Diene
0
0.11
0.23
Alkylbenzene (note
λ
also)
0
0.16
0.53
Dialkyl Sulfide
0
0.30
0.38
Dialkyl Disulfide
0
0.28
0.46
Dialkyl Ether
0
0.44
0.24
Aliphatic Aldehyde
0
0.44
0.65
Aliphatic Ketone
0
0.51
0.67
Aliphatic Ester
0
0.44
0.60
Aliphatic Nitrile (note
λ
also)
0.02
0.35
4.90
Alkylmercaptan
0
0.24
0.35
Terminal Alkyne
0.12
0.12
0.23
Internal Alkyne
0
0.15
0.00
Primary Aliphatic Amine (note
η
also)
0.16
0.62
0.35
Secondary Aliphatic Amine
0.08
0.69
0.29
Tertiary Aliphatic Amine
0
0.73
0.18
Primary Alcohol (note
η
also)
0.37
0.48
0.42
Secondary Alcohol(note
η
also)
0.33
0.56
0.35
Tertiary Alcohol (note
η
also)
0.32
0.55
0.31
Alkylnaphthalene (note
λ
also)
0
0.20
0.89
*