0103 - 5053 $6.00+0.00
A
r
ti
c
le
* e-mail: [email protected]
Application of Multivariate Statistical Analysis to Superficial Soils Around a
Coal Burning Power Plant
Maria Luiza D. P. Godoy*,a,b, José M. Godoya,b, Luis A. Roldãoa and Luis F. Contia
a
Instituto de Radioproteção e Dosimetria, Comissão Nacional de Energia Nuclear, CP 37750, Barra da Tijuca, 22642-970 Rio de Janeiro, RJ, Brazil
b
Departamento de Química, Pontifícia Universidade Católica do Rio de Janeiro, Rua Marquês de São Vicente 225, Gávea, 22453-900 Rio de Janeiro, RJ, Brazil
O Complexo Termelétrico Jorge Lacerda (CTJL), localizado no Estado de Santa Catarina, Brasil, é o maior complexo termelétrico a carvão da América Latina e consiste de sete unidades com uma capacidade total de 832 MWe. De modo a estimar a contribuição das emissões atmosféricas oriundas do CTJL, para a composição elementar de solos superficiais em sua circunvizinhança, quarenta e cinco amostras foram coletadas até uma distância de 8 km. Quarenta e dois elementos foram determinados por ICP-MS e ICP-AES após digestão ácida total. A técnica de análise de componentes principais foi empregada na identificação das fontes de maior significado para a composição do solo superficial. Adicionalmente, foi empregada a técnica de componentes principais absolutos visando a quantificação da contribuição das fontes identificadas na composição química do solo. Baseados nos resultados obtidos, quatro fontes foram identificadas como as principais para a composição elementar do solo superficial. Uma delas foi relacionada com o CTJL, pois continha os elementos voláteis enriquecidos nas cinzas volantes emitidas através das chaminés co compexo.
The Thermoelectric Complex Jorge Lacerda (TCJL), located in the Santa Catarina State, Brazil, is the largest coal burning thermoelectric complex of Latin America and consists of seven power plants with a total capacity of 832 MWe. In order to estimate the contribution of the atmospheric releases from the TCJL to the elemental composition of surface soils around it, forty-five samples were collected at up to a distance of 8 km. Forty-two elements were determined by MS and ICP-AES after total acid dissolution. The technique of principal component analysis was employed to identify the major sources that contribute to surface soil composition. Additionally, a source apportioning using multiple regression on absolute principal component scores was performed in order to obtain quantitative information about the contribution of the different identified sources on the soil composition. Based on the results obtained, four sources were identified as the main contributors to the surface soil elemental composition. One of them was related to TCJL because it retains volatile elements enriched on fly ash and released from powerhouse stacks.
Keywords: surface soils, ICP-MS, coal fired power plant, elemental composition, chemometrics
Introduction
Electric power generation in Brazil has been predominantly hydroelectric. Approximately 14% is of thermoelectric origin, of which a small fraction (18%) is from coal burning power plants. There is a clear tendency to increase thermal electric generation by the use of natural gas power plants, but the coal power plants capacity has remained constant due to the quality and geographical
distribution of coal resources. However, large investments are planned for this decade involving both natural gas and coal fired power plants.1
The Thermoelectric Complex Jorge Lacerda (TCJL) is located in the township of Capivari de Baixo, in the Southeast area of the state of Santa Catarina, 130 km from Florianópolis. The TCJL is the largest coal burning thermoelectric complex of Latin America, formed by seven power plants and with a total capacity of 832 MWe (Table 1).2 Flat lands of recent sedimentary formation with average
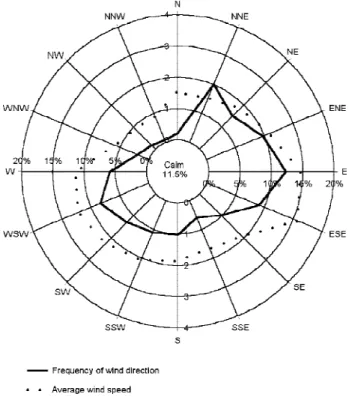
complex is located between two cities, Capivari de Baixo and Tubarão. The principal rivers of the area are the Tubarão and Capivari. An aerial view from the TCJL and its environment is shown in Figure 1. The average wind speed is 2 m s-1 and its direction distribution is quite
homogeneous, futhermore, with a calm frequency of 11.5% (Figure 2). The meteorological conditions at Jorge Lacerda with weak wind and high frequency of unstable conditions tend to cause air pollition.2
All the units of TCJL have electrostatic precipitators with an efficiency of approximately 98%, which remove particulates in suspension in the gaseous effluent. To help the aerial pollutant dispersions, the 4 older generating units are equipped with a 150 m chimney. Each 125 MW unit has a 100 m chimney, and the newest unit of 350 MW has a 200 m chimney. The power plant operator has an environmental monitoring program related to major pollutants involving SO2 and NOx automatic monitoring stations and total suspended particulate (TSP) sampling. No environmental data concerning trace elements is available.2 Finkelmann and Gross3 have proposed
twenty-five elements as health hazard; from them nineteen were investigated during the present study.
The objective of this work was to verify the deposition of elements on surface soils due to the TCJL operation and to obtain the local soil signature for further studies concerning particulate material in suspension in the air. To attain these objectives, the use of the absolute principal component analysis (APCA) was investigated. The APCA is usually applied for source apportionment studies related to atmospheric pollution.4-13 However, its application on
surface soils is not usual. It should allow the estimation of the contribution of each identified source (by principal component analysis) to the soil concentration (mass) of each element. The main advantage of this modeling method is its receptor orientation and the opportunity to evaluate the source emissions without direct measurements.
Experimental
A radial sampling net as recommended by the Environmental Monitoring Laboratory Manual, EML-USDOE (1992),14 was initially planned but was not achieved
due to obstacles such as rice plantations, coal and ash deposits and swamps. Forty-five samples of surface soil (0-5 cm) were collected around the installation, covering a distance up to 8 km from the Thermoelectric Complex (Figure 3). The chosen sites were flat, not swampy, non-cultivated areas and, when possible, far away from any roads.
Table 1. Thermoelectric Complex Jorge Lacerda, data from JICA2
Plant Capacity Coal consumption Start up
(MWe) (103 t y-1) Date
J. Lacerda Ia and Ib 50 420 Mar-65
50 Jan-67
J. Lacerda IIa and IIb 66 576 Mar-73
66 Feb-74
J. Lacerda IIIa and IIIb 125 840 Feb-80
125 Apr-80
J.Lacerda IV 350 1100 Jan-97
Figure 1. Aerial photograph of the Thermoelectric Complex Jorge
Lacerda (TCJL) and its surroundings.
Each sample was a composite of 7 cores, collected in a straight line 50 cm from each other, taken with a PVC corer of 6.5 cm diameter and 5 cm height.14 The samples were
air-dried, sieved to the 2 mm fraction and then homogenized by fine grinding with a mortar.
For the determination of elemental contents, each soil sample was analyzed in triplicate. Aliquots of 300 mg were completely dissolved, in closed Teflon® vessels, with a
mixture 1:1:1 (v/v/v) of HNO3, HF and HClO4.15,16 Each
acid dissolution batch was composed of 17 Teflon® vessels
(15 soil aliquots, a reagent blank and an aliquot of the standard reference material IAEA-356 lake sediment). Major elements (Na, Mg, Al, K, Ca Ti and Fe) were determined by ICP-AES16 and trace elements by ICP-MS.15
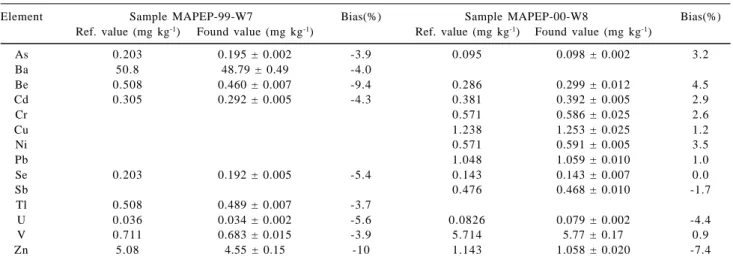
During this work, four interlaboratorial exercises were performed under the USDOE-Mixed Analyte Performance Evaluation Program (MAPEP), two for soil samples and two for water samples (Tables 2 and 3, respectively). For water samples all of them were considered to be acceptable
Table 2. Results obtained during participation in the USDOE Mixed Analyte Performance Exercise Program for soil samples
Element Sample MAPEP-99-S6 Bias(%) Sample MAPEP-00-S7 Bias(%)
Ref. value (mg kg-1) Found value (mg kg-1) Ref. value (mg kg-1) Found value (mg kg-1)
As 26.7 27.2 ± 3.4 2.0
Ba 922.7 1082 ± 99 17
Be 95 91.7 ± 5.0 -3.5
Cd 14.41 13.8 ± 1.7 -4.5 14.3 13.33 ± 0.41 -6.8
Cr 130.39 111 ± 14 -15 79 73.7 ± 4.7 -6.7
Ni 49.59 48.7 ± 6.5 -1.8 79.7 53.2 ± 1.8 -33
Pb 77.83 80 ± 10 2.4 67 68.8 ± 6.4 2.7
Se 9.61 12.3 ± 1.8 28 9.51 12.3 ± 1.1 29
Tl 96.06 91 ± 11 -4.9
U 7.53 6.46 ± 0.55 -14
V 222.33 238 ± 30 7.0 176.2 195.9 ± 6.7 11
Zn 91.2 91.7 ± 2.1 0.5
± signs = 95% confidence ranges.
Figure 3. Soil sampling points with the TCJL at the center.
Table 3. Results obtained during participation in the USDOE Mixed Analyte Performance Exercise Program for water samples
Element Sample MAPEP-99-W7 Bias(%) Sample MAPEP-00-W8 Bias(%)
Ref. value (mg kg-1) Found value (mg kg-1) Ref. value (mg kg-1) Found value (mg kg-1)
As 0.203 0.195 ± 0.002 -3.9 0.095 0.098 ± 0.002 3.2
Ba 50.8 48.79 ± 0.49 -4.0
Be 0.508 0.460 ± 0.007 -9.4 0.286 0.299 ± 0.012 4.5
Cd 0.305 0.292 ± 0.005 -4.3 0.381 0.392 ± 0.005 2.9
Cr 0.571 0.586 ± 0.025 2.6
Cu 1.238 1.253 ± 0.025 1.2
Ni 0.571 0.591 ± 0.005 3.5
Pb 1.048 1.059 ± 0.010 1.0
Se 0.203 0.192 ± 0.005 -5.4 0.143 0.143 ± 0.007 0.0
Sb 0.476 0.468 ± 0.010 -1.7
Tl 0.508 0.489 ± 0.007 -3.7
U 0.036 0.034 ± 0.002 -5.6 0.0826 0.079 ± 0.002 -4.4
V 0.711 0.683 ± 0.015 -3.9 5.714 5.77 ± 0.17 0.9
Zn 5.08 4.55 ± 0.15 -10 1.143 1.058 ± 0.020 -7.4
(±20%). For soil samples, both results for selenium were classified as acceptable with warning and one for nickel as not acceptable. All the data related to this nickel determination were verified and no reason was found for this result, in particular, because all the other nickel determinations were considered to be acceptable.
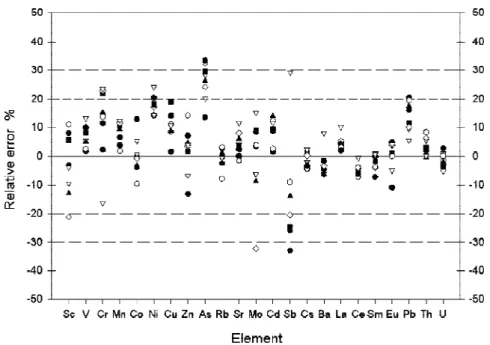
The results of the analysis of the standard reference material IAEA-356 were used to build a control chart (Figure 4), which gave information about the achieved accuracy and precision. The control bars (±20%, acceptable, and ±30%, acceptable with warning) reflect the MAPEP acceptance criteria. Based on this criteria, Sb and As could be regarded as acceptable with warning and all the others acceptable. Poor arsenic results seem to be related to an analytical problem associated with this sample, since, good results were obtained under the MAPEP program (Tables 2 and 3). For Sb the observed biases were, in general, negative, probably related to loses during the sample dissolution procedure.
Soil pH, granulometry, cation exchange capacity, sulfur,
phosphate and organic matter content, were analyzed by the National Laboratory for Soil Research, belonging to the Brazilian Company for Agricultural Research (EMBRAPA).
In order to identify and evaluate the contribution of the pollutant sources in the soil surrounding the TJCL, in particular, volatile elements such as As, Pb, Cd and Sb, receptors models17 were used. A multivariate statistical
approach using Principal Component Analysis (PCA),18,19
Absolute Principal Component Analysis (APCA)4-13 and
Hierarchical Cluster Analysis18,19 was applied. All the
statistical analyses were performed using the Statistical Program for Social Science (SPSS)® version 9.0.
Results and Discussion
The main soil sample characteristics are showed in Table 4 and their chemical composition is presented in Table 5. The soils are, in general, loam and have an acid pH. Some high phosphate values were observed reflecting
Figure 4. Control chart based on the standard reference material IAEA-356.
Table 4. Descriptive statistics of the main soil characteristics
Characteristic Cases Mean Minimum Maximum Standard deviation
Coarse sand (%) 43 24.6 0.1 72.0 21.1
Fine sand (%) 43 15.1 0.1 49.6 11.8
Silt (%) 43 39.0 8.6 69.8 17.2
Clay (%) 43 21.3 6.0 42.0 8.9
pH (H2O) 44 5.6 4.1 8.0 0.79
CEC (meq/100g) 44 23.5 5.5 62.6 12.5
OC (mg g-1) 44 33.3 4.5 159 35.1
Sulfate (µg g-1) 44 26.3 4.0 250 39.7
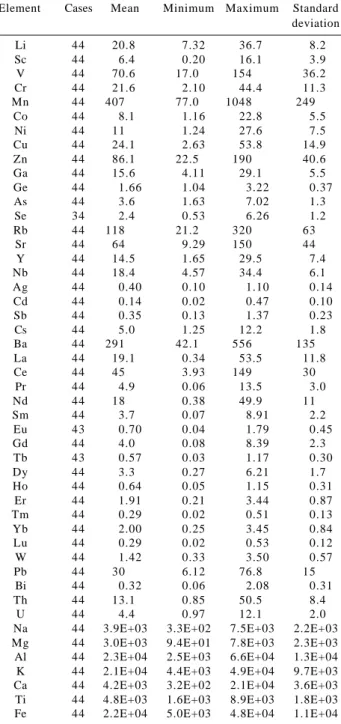
Table 5. Descriptive statistics of the studied elements in superficial
soils around the TCJL (values in mg kg-1)
Element Cases Mean Minimum Maximum Standard deviation
Li 44 20.8 7.32 36.7 8.2
Sc 44 6.4 0.20 16.1 3.9
V 44 70.6 17.0 154 36.2
Cr 44 21.6 2.10 44.4 11.3
Mn 44 407 77.0 1048 249
Co 44 8.1 1.16 22.8 5.5
Ni 44 11 1.24 27.6 7.5
Cu 44 24.1 2.63 53.8 14.9
Zn 44 86.1 22.5 190 40.6
Ga 44 15.6 4.11 29.1 5.5
Ge 44 1.66 1.04 3.22 0.37
As 44 3.6 1.63 7.02 1.3
Se 34 2.4 0.53 6.26 1.2
Rb 44 118 21.2 320 63
Sr 44 64 9.29 150 44
Y 44 14.5 1.65 29.5 7.4
Nb 44 18.4 4.57 34.4 6.1
Ag 44 0.40 0.10 1.10 0.14
Cd 44 0.14 0.02 0.47 0.10
Sb 44 0.35 0.13 1.37 0.23
Cs 44 5.0 1.25 12.2 1.8
Ba 44 291 42.1 556 135
La 44 19.1 0.34 53.5 11.8
Ce 44 45 3.93 149 30
Pr 44 4.9 0.06 13.5 3.0
Nd 44 18 0.38 49.9 11
Sm 44 3.7 0.07 8.91 2.2
Eu 43 0.70 0.04 1.79 0.45
Gd 44 4.0 0.08 8.39 2.3
Tb 43 0.57 0.03 1.17 0.30
Dy 44 3.3 0.27 6.21 1.7
Ho 44 0.64 0.05 1.15 0.31
Er 44 1.91 0.21 3.44 0.87
Tm 44 0.29 0.02 0.51 0.13
Yb 44 2.00 0.25 3.45 0.84
Lu 44 0.29 0.02 0.53 0.12
W 44 1.42 0.33 3.50 0.57
Pb 44 30 6.12 76.8 15
Bi 44 0.32 0.06 2.08 0.31
Th 44 13.1 0.85 50.5 8.4
U 44 4.4 0.97 12.1 2.0
Na 44 3.9E+03 3.3E+02 7.5E+03 2.2E+03
Mg 44 3.0E+03 9.4E+01 7.8E+03 2.3E+03
Al 44 2.3E+04 2.5E+03 6.6E+04 1.3E+04
K 44 2.1E+04 4.4E+03 4.9E+04 9.7E+03
Ca 44 4.2E+03 3.2E+02 2.1E+04 3.6E+03
Ti 44 4.8E+03 1.6E+03 8.9E+03 1.8E+03
Fe 44 2.2E+04 5.0E+03 4.8E+04 1.1E+04
the agriculture activity of this region. The soil sample with the highest phosphate content (sampling point 4, circa 1 km from the TCJL on the ENE sector) was eliminated after the statistical tests performed as described below. No statistically valid correlation (95% significance level) was observed between any soil parameter described in Table 4 and the elements found in Table 5. Therefore, these main soil parameters were excluded from further statistical tests. Histograms, normal and lognormal distributions were generated to validate the data and remove outliers. For
each element, a stepwise linear regression was performed on the validated data set. Those elements that could not be predicted by any other element were excluded from the dataset. In general, these had many results bellow or close to the quantification limit such as Se, Ge, Ag and Bi.
One sampling point (point 4) presented several outlier values such as the elemental concentrations of Ca and Zn. Its visual examination has shown the presence of shale fragments, and, therefore, it was excluded from the dataset. The validated data set had 44 sampling points and 44 variables.
According to Henry et al.,20 in order to obtain reliable
results of a multivariate model in ecological applications, the degrees of freedom per variable should be at least 30, as a consequence, for 44 samples no more than 24 variables should be used for the Principal Component Analysis. In order to reduce the number of variables involved, additional criteria were applied: Preliminary PCA tests have shown that the lanthanides built a separate group; therefore it was decided to exclude them from the PCA evaluation. Due to the fact that Fe and Mn and Mg and Ca show a strong correlation, only one of each pair was included (Fe and Mg). Other elements such as Li, Rb, Cs, Ba, Nb and W were also excluded in order to preserve others such as Zn, Sb or As, which are enriched in fly ashes15 and, therefore,
more relevant for the present study. After these exclusions, there was a reduction for 21 variables and 44 samples. In Table 6, PCA results are presented with the elements retained in each component and their communalities. The communality represents how good the presence of one particular element is explained by the components selected. Based on the criteria defined by Hopke,17 when
an element has shown a factor loading greater than 0.4 it was considered to belong to this component. A soil component means a soil phase or a mineral present with at least one of the selected elements associated with it. The four components chosen are able to explain 85.3% of data set variability.
includes sodium and potassium indicating some marine aerosol and biomass contributions.
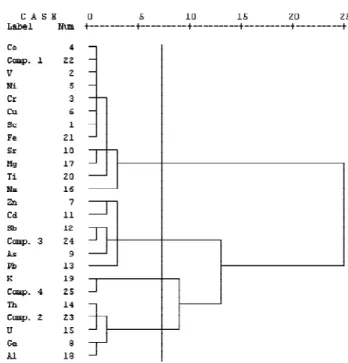
In order to validate the PCA results, a hierarchical cluster analysis was performed including the components factor scores retained in the PCA as new variables. The obtained result was in agreement with that described above. Four clusters were observed, each one including the elements belonging to each component obtained in the PCA together with the correspondent component factor scores, as it is shown in Figure 5. The same results were obtained using both PCA and cluster analysis indicating that the database is valid.
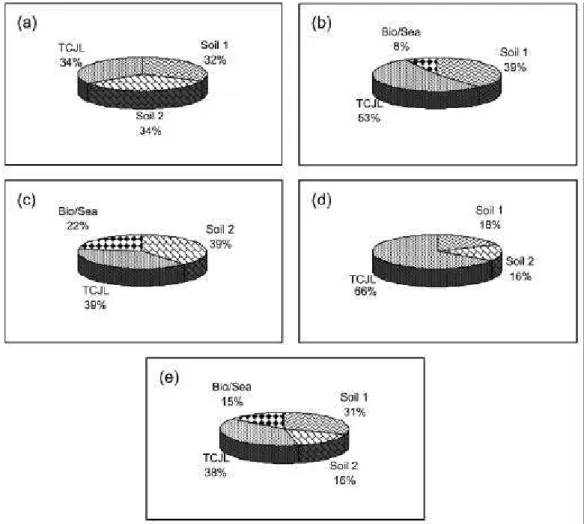
In order to obtain the relative contribution from each source type to the measured mean concentration of elements, in particular of those elements defined as hazardous by Finkelmann and Gross,3 an absolute
principal component analysis was performed.4-13 The
results obtained (Table 7) show that, together with the TCJL component, the soil matrix (PCA components 1 and 2) contributes a significant percentage of mass content of As, Pb and Zn in the surface soils. On the other hand, the TCJL component (component 3) represents 2/3 of the soil content of Sb and 1/2 of the soil content of Cd. The S/M values close to one show that the calculated elemental
concen-Figure 5. Hierarchical cluster analysis dendrogram showing the
distance between the elements, with the PCA factor scores included as new variables.
Table 6. Varimax rotated factor loadings matrix and communalities
obtained with principal components analysis for the studied ele-ments in the superficial soils around the TCJL (EV-eigenvalue, VAR-explained variance and CVAR-cumulative variance VAR-explained)a
Element Comp. 1 Comp. 2 Comp. 3 Comp. 4 Communality
Co 0.95 - 0.17 - 0.94
V 0.95 - 0.15 -0.16 0.96
Ni 0.94 - 0.24 - 0.95
Mg 0.94 - - - 0.89
Cu 0.90 - 0.23 - 0.88
Fe 0.89 0.33 0.15 - 0.94
Sr 0.88 -0.10 0.22 0.18 0.88
Cr 0.88 - 0.33 -0.14 0.91
Sc 0.86 0.35 0.21 -0.10 0.91
Ti 0.83 - - -0.28 0.77
Na 0.74 -0.14 - 0.49 0.81
Th - 0.94 0.11 - 0.91
U -0.21 0.88 0.21 - 0.86
Al 0.18 0.86 - 0.14 0.80
Ga 0.33 0.85 0.19 0.12 0.88
Sb 0.16 - 0.83 -0.18 0.76
Cd 0.44 - 0.69 0.13 0.69
Pb -0.20 0.40 0.66 0.39 0.79
Zn 0.44 0.18 0.66 0.28 0.74
As 0.45 0.34 0.62 -0.31 0.80
K -0.18 0.31 - 0.84 0.84
EV 9.6 3.8 2.9 1.6
VAR(%) 45.8 18.2 13.9 7.4
CVAR(%) 45.8 63.9 77.9 85.3
ª Only factor loadings large than 0.1 are shown and in bold those higher than 0.4.
trations in soil are in agreement with the observed mean values. The pie charts shown in Figure 6 illustrate better these relative contributions.
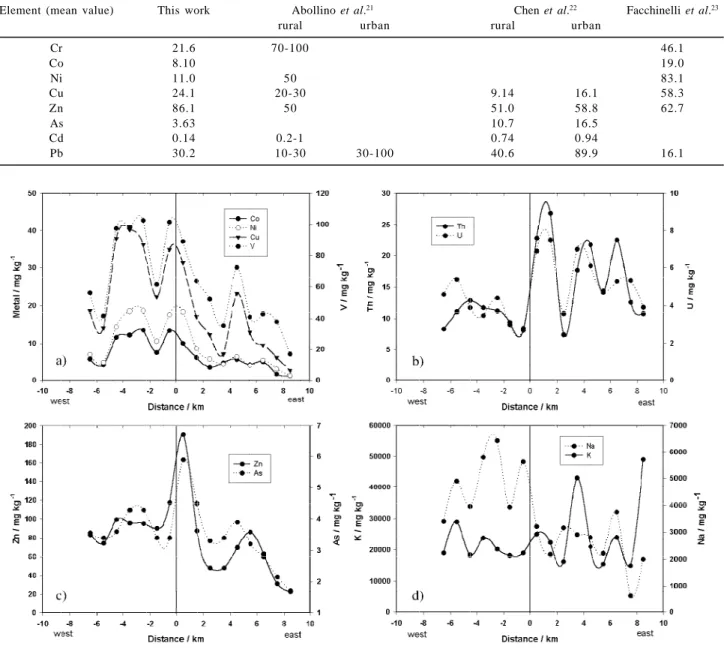
In spite of this TCJL contribution, the mean value observed for the elements of the component 3 are similar to those reported by other authors21-23 as shown in Table 8.
The distribution with distance from TCJL for some elements belonging to components 1-4 is shown in Figure 7 a-d. As there is not a well-defined main wind direction a symmetric distribution in relation to the complex is expected for those elements with significatant contribu-tions from atmospheric releases from TCJL. A maximum at some distance from the complex is also expected coinciding to the plume touchdown. Due to the presence of coal and ash deposits around the complex, elevated concentrations close to the complex are also expected. The curve (c) with As and Zn is the one that more closely corresponds to the above description. Thus the Figure 7 (c) with elements belonging to component 3 represents atmospheric releases from the TCJL.
Conclusions
Table 7. Results of source apportionment obtained by the application of APCA, and the ratio between the calculated concentration in soil to the
observed mean value (values in mg kg-1) a
Element Comp. 1 Comp. 2 Comp. 3 Comp. 4 Calculated Observed mean S/M
Soil 1 Soil 2 TCJL Biomass and Sea value (S) value (M)
Sc 4.40 1.88 0.70 - 6.98 6.35 1.10
V 52.75 9.64 9.24 - 71.63 70.58 1.01
Cr 14.98 1.90 5.09 - 21.97 21.58 1.02
Co 7.27 - 0.97 0.07 8.31 8.10 1.03
Ni 9.98 - 2.05 - 12.02 10.96 1.10
Cu 19.68 0.04 4.52 - 24.24 24.11 1.01
Zn 25.87 13.53 32.63 12.91 84.94 86.06 0.99
Ga 3.23 9.15 1.66 1.13 15.17 15.59 0.97
As 1.16 1.27 1.24 - 3.67 3.63 1.01
Sr 54.05 - 10.75 8.71 73.50 63.96 1.15
Cd 0.06 - 0.08 0.01 0.15 0.14 1.06
Sb 0.07 0.06 0.25 - 0.38 0.35 1.07
Pb - 12.54 12.79 7.09 32.42 30.17 1.07
Th - 13.52 0.78 - 14.30 13.14 1.09
U - 3.60 0.71 0.20 4.51 4.36 1.03
Na 2.44E+03 - 322 1.32E+03 4.08E+03 3.92E+03 1.04
Mg 2.94E+03 - 71 114 3.12E+03 3.00E+03 1.04
Al 3.06E+03 1.92E+04 - 1.60E+03 2.39E+04 2.33E+04 1.03
K - 8.73E+03 1.49E+03 1.01E+04 2.03E+04 2.09E+04 0.98
Ti 2.94E+03 1.03E+03 425 - 4.40E+03 4.76E+03 0.92
Fe 1.41E+04 6.38E+03 1.96E+03 - 2.24E+04 2.21E+04 1.01
ª Only statistical significant regression coefficients within 95% confidence interval are shown.
percentage of element concentrations such as As, Cd, Pb, Sb and Zn in the surface soils around it. Notwithstanding, when these concentrations are compared with those reported by other authors, one may conclude that, in spite of this input, these cannot be taken as high concentrations.
Acknowledgments
The present work was partially supported by the Conselho Nacional de Desenvolvimento Científico e Tecnológico (CNPq) under the research contract number 460958/2000-3. The authors would like to express their gratitude to Prof. Paulo Artaxo at the Department of
Physics, University of São Paulo, Brazil, Prof. Ricardo Aucélio at the Department of Chemistry, Pontifícia Universidade Católica do Rio de Janeiro, and Prof. John Hunt, Instituto de Radioproteção e Dosimetria, Comissão Nacional de Energia Nuclear, for their valuable comments on the manuscript. The authors would like to express their gratitude to José Lourival Magri for the aerial photograph of the Thermoelectric Complex Jorge Lacerda (TCJL).
References
1. http://www.provedor.nuca.ie.ufrj.br/eletrobras/, accessed June
2002.
Table 8. Comparison of trace element concentrations among the present work and other authors, values in mg kg-1
Element (mean value) This work Abollino et al.21 Chen et al.22 Facchinelli et al.23
rural urban rural urban
Cr 21.6 70-100 46.1
Co 8.10 19.0
Ni 11.0 50 83.1
Cu 24.1 20-30 9.14 16.1 58.3
Zn 86.1 50 51.0 58.8 62.7
As 3.63 10.7 16.5
Cd 0.14 0.2-1 0.74 0.94
Pb 30.2 10-30 30-100 40.6 89.9 16.1
2. Japan International Cooperation Agency (JICA); The Study
on Evaluation of Environmental Quality in Regions under Influence of Coal Steam Power Plants in the Federal Republic of Brazil, Final Report, Tokyo, Japan, 1997.
3. Finkelman, R. B.; Gross, P. M. K.; Int. J. Coal Geol 1999, 40,
91.
4. Artaxo, P.; Oyola, P.; Martinez, R.; Nucl. Instrum. Methods
Phys. Res., Sec. B 1999, 150, 409.
5. Baek, S.; Choi, J.; Hwang, S.; Environ. Int. 1997, 23, 205.
6. Borbély-Kiss, I.; Kottay, E.; Szabó, G.Y.; Bozó, L.; Tar, K.; J.
Aerosol Sc. 1999, 30, 369.
7. Gerab, F.; PhD Thesis, Instituto de Física, Universidade de São
Paulo, São Paulo, Brazil, 1996.
8. Gidhagen, L.; Kahelin, H; Schmidt-Thomé, P.; Johansson, C.;
Atmos. Environ. 2002, 36, 3803.
9. Maenhaut, W.; Fernández-Jiménez, M.T.; Rajta, I.; Artaxo, P;
Nucl. Instrum. Methods Phys. Res., Sec. B 2002, 189, 243.
10. Manoli, E.; Voutsa, D.; Samara, C.; Atmos. Environ. 2002, 36,
949.
11. Spanos, Th; Simeonov, V; Andreev, G.; Talanta 2002, 58,
367.
12. Swietlicki, E.; Puri, S.; Hansson, H.; Edner, H.; Atmos. Environ.
1997, 30, 2795.
13. Swietlicki, E.; Krejci, R.; Nucl. Instrum. Methods Phys. Res.,
Sec. B 1996, 110, 519.
14. Environmental Measurements Laboratory (EML), United State
Department of Energy (USDOE), Procedures Manual;
HASL-300, New York, 1992, p. 2.1-2.88.
15. Godoy, M. L., Godoy, J. M.; Roldão, L. A.; At. Spectros.
2001, 21, 235.
16. . Horton, J. H.; Dorsett, R. S.; Cooper R. E.; Trace Elements in
the Terrestrial Environment of a Coal Fired Powerhouse,
DP-1475/UC-11, 1997.
17. Hopke, P. K. In Elemental Analysis of Airborne Particles;
Landsberger, S., Creatchman, M. eds., Gordon and Breach
Science Publishers: Amsterdam, 1999, pp. 273-315.
18. Johnson, R.; Wichern, D.; Applied Multivariate Statistical
Analysis, Prentice Hall: New Jersey, 1998, p. 816.
19. Legrende, P.; Legrende, L.; Numerical Ecology: Developments
in Environmental Modelling, 2nd ed.; Elsevier: New York, 1998,
p. 853.
20. Henry, R. C.; Lewis, C. W.; Hopke, P. K.; Williamson, H. J.;
Atmos. Environ. 1984, 18, 1507.
21. Abollino, O.; Aceto, M.; Malandrino, M.; Mentasti, E.;
Sarzanini, C.; Barberis, R.; Environ. Pollut. 2002, 119, 177.
22. Chen, T.B.; Wong, J.W.C.; Zhou, H.Y.; Wong, M.H.; Environ.
Pollut. 1997, 96, 61.
23. Facchinelli, A.; Sacchi, E.; Mallen, L.; Environ. Pollut. 2001,
114, 313.