Article
J. Braz. Chem. Soc., Vol. 26, No. 12, 2507-2519, 2015. Printed in Brazil - ©2015 Sociedade Brasileira de Química 0103 - 5053 $6.00+0.00
A
*e-mail: [email protected]
4-(Pyren-1-ylimino)methylphenol and its Silylated Derivative as Chromogenic
Chemosensors Highly Selective for Fluoride or Cyanide
Jonatan L. O. Buske, Celso R. Nicoleti, Aluisio A. Cavallaro and Vanderlei G. Machado*
Departamento de Química, Universidade Federal de Santa Catarina (UFSC), 88040-900 Florianópolis-SC, Brazil
Two novel compounds, 4-(pyren-1-ylimino)methylphenol and 4-[(triisopropylsilyl)oxy] phenylmethylenepyren-1-amine) were synthesized. Solutions of 4-(pyren-1-ylimino)methylphenol in dimethyl sulfoxide (DMSO) are colorless, but on addition of cyanide and fluoride they become colored due to the deprotonation of the chemosensor. The system is highly selective toward cyanide with the addition of water. This compound can be solubilized in water with addition of cetyltrimethylammonium bromide above its critical micellar concentration. The pKa of the compound in water was determined as 10.49 ± 0.02 and this value is lowered in micellar medium to 7.49 ± 0.02, which means that only cyanide is sufficiently basic to achieve the deprotonation of the compound. Solutions of 4-[(triisopropylsilyl)oxy]phenylmethylenepyren-1-amine) in DMSO are colorless, but they are colored in the presence of cyanide and fluoride and only cyanide could be detected in DMSO-water mixture. The nucleophilic attack of the anions on the silicon center of the compound releases colored 4-(pyren-1-ylimino)methylphenolate, enabling the detection of nucleophilic analytes.
Keywords: chemodosimeter, chromogenic chemosensor, naked-eye detection, anion sensing,
cyanide
Introduction
The recognition and detection of anionic analytes has become a field of great interest in recent years.1-17 In this context, considerable effort has been made to design strategies for the detection of cyanide (CN−).18-24 This is due to the fact that CN− is a chemical species present in several processes, being fundamental in various industrial activities, such as metallurgy, mining and the fabrication of polymers.25,26 This anion is obtained by means of hydrolysis from certain fruit seeds27 and roots28 and is present in some neurotoxic warfare agents.29 Another anion of interest in terms of detection is fluoride (F−), due to the role it plays in environmental pollution, in industry, and in many diseases.30-32
The definition of a particular system for the optical detection of an analyte, such as F− and CN−, as an optical chemosensor or as a chemodosimeter, is dependent on whether the process is reversible or irreversible, respectively.33 The main feature which these strategies have
in common is the combination of a receptor site (for the recognition of the analyte) and a signaling unit (responsible for the detection of the recognized analyte).1,9
The simplest optical chemosensor that can be designed involves the use of an acid-base strategy.8,14,34,35 In this case, a suitable indicator is used, which is colorless in an organic solvent in its protonated form. The deprotonation of the compound, on the addition of a sufficiently basic anion, colors the solution and indicates the presence of the analyte. This strategy has been used for the development of optical chemosensors for the detection of anions, such as CN−, F− and acetate.36-39 A system which is more selective toward the anion, for instance, CN−, can be achieved through synthetic modification of the molecular structure of the chemosensor, by the addition of small amounts of water,40 using biphasic media,22 or anchoring the chemosensor in a polymeric matrix.10,41
systems, a chromophore (or luminophore) is masked through the use of a covalently-linked silyl group as a protective agent. Fluoride can act as a strong nucleophile in organic medium causing the release of the leaving group signaling unit, which consequently serves to indicate the presence of the anion. Papers in the literature reporting chemodosimeters based on the breaking of the oxygen-silicon bond have been, in general, limited to their use in organic solvents.42,51,55-57 Tang and co-workers58 developed a fluorogenic chemodosimeter strategy for the highly selective detection of F− in aqueous solution and living cells, which is based on probes with a quaternary ammonium moiety in their molecular structure.
Recently, we demonstrated that a silylated compound, (E)-3,5-dibromo-N-(4-nitrobenzylidene)-4-((triisopropylsilyl)oxy)aniline, could be solubilized in aqueous cetyltrimethylammonium bromide (CTABr) micellar medium to form a chromogenic chemodosimeter, which is highly selective for the detection of CN−.59 This system could also be applied to the detection of CN− in blood plasma. The addition of CTABr has been applied to improve the solubility of lipophilic probes in water and also to accelerate the rates of desilylation in aqueous solution. In this paper, the novel compounds 1a, 4-(pyren-1-ylimino)methylphenol, and 2, 4-[(triisopropylsilyl)oxy] phenylmethylenepyren-1-amine, were synthesized and characterized (Figure 1). Compound 1a was used in an acid-base strategy for the selective colorimetric detection of F− and CN− in dimethyl sulfoxide (DMSO). Compound 2 was studied with regard to its use as a chromogenic chemodosimeter for the selective detection of F− and CN−. These systems became highly selective for CN− over F− on the addition of small amounts of water. In addition, it is shown herein that compound 1a can also be used as chromogenic chemosensor, which is highly selective for CN− in water with CTABr present in its micellar concentration.
Experimental
General
All chemicals used were high-purity commercial reagents. Pyrene (Sigma-Aldrich), anhydrous acetic acid (Vetec), N,N-dimethylformamide (DMF) (Vetec), imidazole (Sigma-Aldrich), triisopropylsilyl chloride (TIPS-Cl; Sigma-Aldrich), 4-hydroxybenzaldehyde (Sigma-Aldrich), acetic anhydride (Vetec), tetra-n-butylammonium hydroxide (Sigma-Aldrich), CTABr (Sigma-Aldrich) and n-hexane (Vetec) were used without further purification. Acetone, methanol, DMSO, ethyl acetate and absolute ethanol were purchased from Vetec and dried and stored over 4 Å molecular
sieves in sealed bottles. All anions (HSO4−, H2PO4−, NO3−, CN−, CH
3COO−, F−, Cl−, Br−, and I−) were used as tetra-n-butylammonium salts with purity greater than 97-99%. The anions were purchased from Fluka (F−, > 97%; Cl−, > 98%; NO3−, > 97%; H2PO4−, > 97%), Vetec (Br−, > 99%; I−, > 99%; HSO4−, > 99%) and Sigma-Aldrich (CH3COO−, > 97%) and dried over phosphorous pentoxide under vacuum before use. Copper(II) nitrate (Sigma-Aldrich), tin(II) chloride dihydrate (Sigma-Aldrich), anhydrous magnesium sulfate (Vetec) and anhydrous sodium carbonate (Vetec) were dried in an oven for 24 h. The deionized water used in the measurements was boiled and bubbled with nitrogen and then kept in a nitrogen atmosphere to avoid the presence of carbon dioxide.
Instrumentation
Melting points were obtained on a Kofler hot stage and are uncorrected. The nuclear magnetic resonance (NMR) spectra were recorded on a 400 MHz spectrometer with DMSO-d6 and deuterated propanone (C3D6O). Chemical shifts were recorded in ppm with the solvent resonance as the internal standard. Data are reported as follows: chemical shift, multiplicity (s = singlet, d = doublet, t = triplet and m = multiplet), integration and coupling constants (Hz). Infrared (IR) spectra of the solid compounds were obtained with KBr pellets and the oil compound was used neat. High-resolution mass spectra were obtained with an electrospray ionization quadrupole time-of-flight mass spectrometer (HR ESI-MS QTOF). UV-Vis experiments were carried out on a HP 8452A spectrophotometer equipped with a thermostated bath and all measurements were performed at 25 °C, employing a 1 cm quartz cuvette. The maximum wavelengths (λmax) of the UV-Vis spectra were calculated from the first derivative of the absorption spectrum.
Synthesis of the compounds
1-Nitropyrene (4)
Pyrene (2.53 g, 12.5 mmol) and acetic anhydride (6.50 mL, 68.8 mmol) were mixed in a 250 mL three-neck round-bottomed flask, with 50 mL of dried ethyl acetate
N
OR
1a: R = H
2: R = Si(isopropyl)3
and copper(II) nitrate (4.53 g, 18.8 mmol), under magnetic stirring and argon atmosphere. The mixture was stirred for 24 h at 55 °C and a yellow precipitate was formed. After this reaction time, the flask was cooled at room temperature and the inorganic materials were filtered off. The product obtained from the filtration was recrystallized from an ethanol/ethyl acetate mixture (1:1; v/v) and the pale yellow crystals collected were dried in an oven at 40 °C for 6 h, yielding 2.75 g (89% yield); mp obtained: 150-151 °C (mp lit.:60 151-152 °C); IR (KBr) ν
max / cm−1 2922-3043 (C−H aromatic), 1592 (C=C), 1556 (asNO2), 1509 (C=C), 1309-1384 (sNO2); 1H NMR (400 MHz, DMSO-d6) d 8.72 (d, 1H, J 8.6 Hz, CH), 8.70 (d, 1H, J 8.2 Hz, CH), 8.51 (d, 1H, J 7.4 Hz, CH), 8.50 (d, 1H, J 9.4 Hz, CH), 8.49 (d, 1H, J 7.4 Hz, CH), 8.44 (d, 1H, J 9.0 Hz, CH), 8.42 (d, 1H, J 8.2 Hz, CH), 8.31 (d, 1H, J 9.0 Hz, CH), 8.23 (t, 1H, J 7.4 Hz, CH).
1-Aminopyrene (5)
1-Nitropyrene (1.00 g, 4.0 mmol) and tin(II) chloride dihydrate (4.35 g, 19.2 mmol) were mixed with 60 mL of ethyl acetate in a 250 cm3 three-neck round-bottomed flask, under magnetic stirring and argon atmosphere. The suspension mixture was heated to reflux for 6 h. Subsequently, the solution was cooled at room temperature, a sodium carbonate aqueous solution (20%; m/v) was added to obtain pH ca. 8.0, and stirring was continued for 1 h. The organic phase was then extracted three times with ethyl acetate and dried with magnesium sulfate. The solid was filtered-off and the solvent was evaporated, resulting in 0.80 g (90% yield) of a light green product; mp obtained: 115-116 °C (mp lit.:61 115-117 °C); IR (KBr) ν
max / cm−1
3345-3387 (N−H), 3036 (C−H aromatic), 1623-1512
(C=C); 1H NMR (400 MHz, DMSO-d
6) d 8.24 (d, 1H, J 9.4 Hz, CH), 7.97 (d, 2H, J 7.8 Hz, 2 × CH), 7.94 (d, 1H, J 7.8 Hz, CH), 7.89 (d, 1H, J 9.0 Hz, CH), 7.86 (d, 1H, J 8.6 Hz, CH), 7.85 (t, 1H, J 7.6 Hz, CH), 7.69 (d, 1H, J 8.6 Hz, CH), 7.34 (d, 1H, J 8.2 Hz, CH), 6.33 (s, 2H, NH2).
4-(Pyren-1-ylimino)methylphenol (1a)
1-Aminopyrene (0.200 g, 0.92 mmol) and 4-hydroxybenzaldehyde (0.169 g, 1.38 mmol) were dissolved in 5 mL of dry ethanol in a 10 mL beaker and acetic acid (one drop) was added. The mixture was stirred at room temperature for 4 h. A precipitate was formed after the stirring time, the product was recrystallized and the crystals collected were washed twice, using an ethanol/ acetone mixture (1:1; v/v) as the solvent, giving 0.150 g (51% yield) of a green product, with mp 229-232 °C. IR (KBr) νmax / cm−1 3441 (O−H), 1605 (C=N), 1515-1577
(C=C); 1H NMR (400 MHz, DMSO-d
6) d 10.2 (s, 1H,
OH), 8.8 (s, 1H, CH=N) 8.62 (d, 1H, J 9.4 Hz, CH), 8.28 (d, 1H, J 8.2 Hz, CH), 8.24 (d, 2H, J 7.8 Hz, 2 × CH), 8.16 (d, 1H, J 9.0 Hz, CH), 8.14 (d, 1H, J 8.6 Hz, CH), 8.08 (d, 1H, J 9.0 Hz, CH), 8.03 (t, 1H, J 7.4, 7.8 Hz, CH), 7.99 (d, 2H, J 8.6 Hz, 2 × CH), 7.88 (d, 1H, J 8.2 Hz, CH),
6.97 (d, 2H, J 8.2 Hz, 2 × CH); 13C NMR (100 MHz,
DMSO-d6) d 161.41, 161.31, 145.96, 131.55, 131.50, 131.40, 128.44, 127.78, 127.23, 126.81, 126.68, 126.35, 125.36, 125.25, 125.08, 124.58, 123.51, 116.28; HRMS (ESI, TOF) m/z calcd. for C23H16NO [M + H]+: 322.1226, found: 322.1223.
4-Triisopropylsilyloxybenzaldehyde (7)
4-Hydroxybenzaldehyde (0.427 g, 3.5 mmol) was dissolved in DMF (9 mL) in a 100 mL round-bottomed flask in an argon atmosphere. Imidazole (0.483 g, 7 mmol) and TIPS-Cl (1.0 g, 5.2 mmol) were then added and the mixture was stirred at room temperature. After 12 h, 100 mL of water was added to the reaction mixture and the organic fraction was extracted with n-hexane (1:1, v/v). The combined organic layers were washed with brine, dried over MgSO4 and the solid was filtered off. The solvent was removed by rotary evaporation and the residue was purified by flash column chromatography (3:1 n-hexane/EtOAc), yielding 0.747 g (76% yield) of the product as a colorless oil. IR (neat oil) νmax / cm−1 2867-2947 (C−H aliphatic),
1701 (C=O), 1509-1599 (C=C); 1H NMR (400 MHz,
CDCl3) d 9.87 (s, 1H, CHO), 7.77 (d, 2H, J 8.6 Hz, 2 × CH), 6.97 (d, 2H, J 8.6 Hz, 2 × CH), 1.24-1.33 (m, 3H, J 7.4 Hz, 3 × CH), 1.11 (d, 18H, J 7.4 Hz, 6 × CH3).
4-[(Triisopropylsilyl)oxy]phenylmethylenepyren-1-amine (2) Compounds 1 (0.250 g, 1.15 mmol) and 7 (0.221 g, 1.15 mmol) were dissolved in dry ethanol (3 mL) containing acetic acid (three drops) in a 50 mL round-bottomed flask, which was closed and its content was stirred at room temperature for 3 h. A gold yellow precipitate was observed after the stirring time and dry ethanol (10 mL) was then added. The solid was collected, recrystallized from ethanol/methanol mixture (1:1; v/v) and, after filtration, and washing with cold methanol, 0.330 g (60% yield) of the product were obtained (mp 84-86 °C). IR (KBr)
νmax / cm−1 3041 (C−H aromatic), 2866-2943 (C−H aliphatic), 1599 (C=N), 1509 (C=C), 1270 (C−H imine);
1H NMR (400 MHz, C
(m, 3H, J 7.4 Hz, 3 × CH), 1.16-1.18 (d, 18H, J 7.4 Hz, 6 × CH3); 13C NMR (100 MHz, C3D6O) d 160.26, 159.24, 145.96, 131.66, 131.56, 130.80, 130.52, 129.36, 127.36, 126.78, 126.41, 126.24, 125.84, 125.29, 125.09, 124.75, 123.33, 120.48, 120.23, 115.53, 17.38, 12.54; HRMS (ESI, TOF) m/z calcd. for C32H36NOSi [M + H]+: 478.2561, found: 478.2564.
Visual detection and UV-Vis experiments
The following procedure was used for compounds 1a and 2. A 1.0 × 10⁻² mol L−1 stock solution of each compound was prepared in anhydrous acetoneand stored in glass flasks closed with rubber stoppers to avoid the evaporation of the solvent. A volume of 10 µL was collected from this solution and placed in 5 mL volumetric flasks. After evaporation of the acetone, the solid was dissolved in dry DMSO, resulting in a dye solution of 2.0 × 10⁻⁵ mol L−1. This solution was distributed to several vials and subsequently the tetra-n-butylammonium salts were added, resulting in anion concentrations of 6.0 × 10⁻⁴ and 3.0 × 10⁻³ mol L−1 for 1a and 2 solutions. Similar experiments were carried out with DMSO-water mixtures to evaluate the influence of the medium on the performance of systems 1a and 2. The experiments involving compounds 1a and 2 in water were performed using 2.0 × 10⁻⁵ mol L−1 of the compounds in the absence and in the presence of CTABr (3.0 × 10⁻³ mol L−1). UV-Vis spectra were obtained for all solutions prepared in the absence and in the presence of the anions.
Titrations
Titration experiments were performed in DMSO with the preparation of solutions of 1a and 2 as previously described. These solutions were used to prepare the stock anion solutions, which were closed with rubber stoppers. The titrations were carried out by adding small amounts (2-50 µL) of the salt solution (with a microsyringe) to closed quartz cuvettes containing the solution of 1a or 2.
Titration experiments were also performed in DMSO/ water systems, using the minimum water content, which allowed selective detection of the anion.
Finally, the titration of 1a (2.0 × 10⁻⁵ mol L−1) with CN− was carried out in a CTABr/water system. The absorbance values at 406 nm were recorded and used to construct the titration curve.
pKa value for 1a in aqueous solution
A solution of 1a was prepared at a concentration of 2.0 × 10⁻² mol L−1 in DMSO, and stored in a volumetric
flask closed with a rubber stopper to avoid water absorption by the solvent. An aliquot of the solution, sufficient to give a concentration of the compound of 2.0 × 10⁻⁵ mol L−1, was collected with a microsyringe and placed in two volumetric flasks. Water at pH 5.01 (adjusted with 0.1 mol L−1 HCl) was added to one flask and the other was completed with water at pH 13.9 (adjusted with 0.1 mol L−1 KOH). The UV-Vis spectrum of the dye solution of pH 5.01 was recorded at 25 °C. The pH of the solution was measured and the UV-Vis spectrum was obtained after each addition of a small amount of dye solution at pH 13.9, until the pH was above 12.
NMR experiments
For the 1H NMR experiments, 6.0 mg of 1a or 2 were
placed in an NMR tube and 0.6 mL of DMSO-d6 was
added. The concentrations of 1a and 2 were 3.7 × 10⁻² and 2.5 × 10⁻² mol L−1, respectively. Aliquots of a 0.6 mol L−1 tetra-n-butylammonium fluoride stock solution were added to the NMR tubes containing 1a and 2 and the 1H NMR spectra were obtained after 5 min at room temperature.
Calculations
The equilibrium constants were calculated through the fitting of the least-squares regression curves using the ORIGIN 6.1 program.
Results and Discussion
Compounds 1a and 2 were synthesized according to the route shown in Scheme 1. Firstly, pyrene (3) was nitrated using copper(II) nitrate, acetic acid and acetic anhydride to form 1-nitropyrene (4) in 89% yield. Compound 4 was reduced under reflux with tin(II) chloride in ethyl acetate to form compound 5 with 90% yield. The condensation of compound 5 with 4-hydroxybenzaldehyde (6) in ethanol at room temperature provided compound 1a in 51% yield. The silylated intermediate 7 was obtained in 76% yield by reacting compound 6 with TIPS-Cl in DMF, using imidazole as a base. The condensation of the aldehyde 7 with amine 5 using the same conditions for the preparation of imine 1a led to the formation of compound 2 in 60% yield. The novel compounds 1a and 2 were fully characterized, exhibiting purity adequate for use in the further studies.
Acid-base strategy using compound 1a
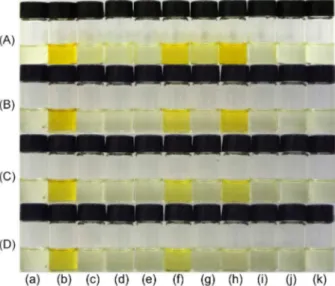
Figure 2A shows the solutions of 1a in DMSO and
of several anions. Solutions of 1a are colorless but on addition of hydroxide they become orange in color due to the deprotonation of the chemosensor. Of the several anions
tested, only CN−, F−, and to a lesser extent, CH
3COO−, were able to deprotonate the solutions of 1a.
Only F− and CN− are detected with the addition of 1% of water (v/v), while with the addition of 10% of water, the system becomes highly selective toward CN−. The addition of water to organic solvents in order to make chromogenic chemosensors selective toward CN− in the presence of other anions has been previously demonstrated.8,21,34,62-67 This is explained considering that the hydration energies of F− (−465 kJ mol−1), CH
3COO− (−365 kJ mol−1), and H2PO4− (−465 kJ mol−1) are high in comparison with that of CN− (−295 kJ mol−1).68 CN− is less hydrated with the addition of water, being a more basic species in comparison with the other anions and thus more effective in the abstraction of the proton of 1a. Scheme 2 details the reaction of the deprotonation of colorless 1a by the basic anions F− and CN− generating the colored species 1b in solution.
Figure 3A shows the UV-Vis spectra for 1a in DMSO in the absence and presence of the anions studied. This compound has a band with a maximum at 384.0 nm (εmax = 3.28 × 10⁴ L mol−1 cm−1) and the addition of hydroxide causes the disappearance of this band simultaneously with the appearance of another band with a maximum at 55oC. 24 h
NO2
Reflux. 6 h 3
4 89% yield
5 90% yield
O OH
H
Imidazole DMF TIPS-Cl
r.t.. 12 h
6
O OTIPS
H
7 76% yield
+6
Ethanol AcOH r.t.. 4 h
+7
Ethanol AcOH r.t.. 4 h
N
O Si
CH3
C
H3
CH3
CH3
C
H3
CH3
N
OH 1a
51% yield
2 60% yield
NH2
Ac2O AcOEt Cu(NO3)2
SnCl2 AcOEt
Scheme 1. Synthetic route for the preparation of compounds 1a and 2.
Figure 2. Solutions of (a) 1a; (b) 1b; and 1a in the presence of (c) HSO4−;
(d) H2PO4−; (e) NO
3−; (f) CN−; (g) CH3COO−; (h) F−; (i) Cl−; (j) Br− and
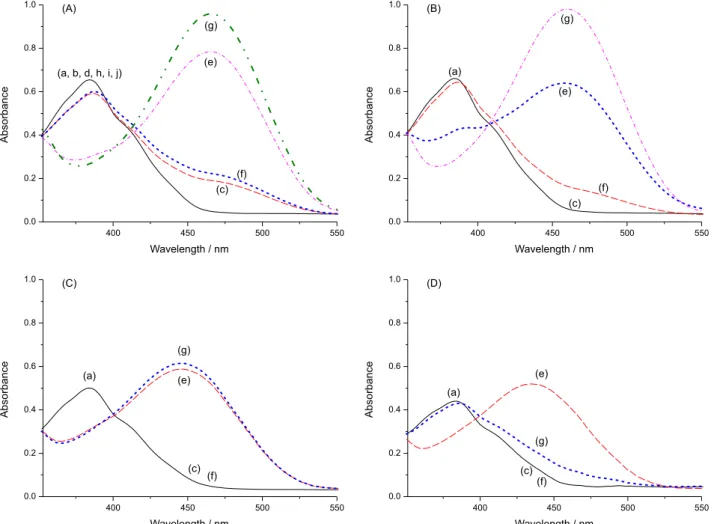
468.0 nm (εmax = 4.78 × 10⁴ L mol−1 cm−1). Data show that on the addition of F− the UV-Vis spectrum is the same as that obtained with the addition of hydroxide, indicating that F− is very efficient as a base to deprotonate the dye. CN− is also able to deprotonate 1a, although with less efficiency than F−, while acetate has a small influence on the spectrum of the chemosensor. On the addition of 1% (v/v) of water (Figure 3B), acetate is not able to act as a base, while in the medium containing 4% (v/v) of water, CN− is more efficient as a base than F− (Figure 3C). In the 9:1 (v/v) DMSO-water mixture (Figure 3D), only CN− caused the appearance of the
band in the visible region, this band being hypsochromically shifted to 436.0 nm, since the dye generated exhibited solvatochromism, i.e., its visible band changes position when the polarity of the medium is altered.69
Compound 1a was titrated with the anionic species able to change the color of the solutions, that is, F− in
DMSO and CN− in a DMSO-water (9:1; v/v) mixture.
The absorbance values for the band of 1b at 468.0 nm in DMSO and at 436.0 nm with the addition of 10% of water were plotted as a function of the anion concentration added. The experimental data were fitted with the use of
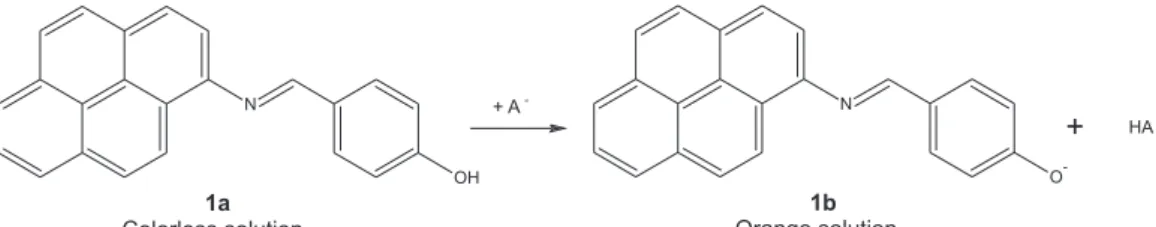
+ A -N OH 1a Colorless solution N O -1b Orange solution + HA
A: F-or CN
-Scheme 2. Deprotonation of compound 1a by F− or CN−.
350 400 450 500 550
0.0 0.1 0.2 0.3 0.4 0.5 0.6 0.7 0.8 0.9 (f) (b.h)
(a, c, d, e, i, j, k)
A b s o rb a n c e
Wavelength / nm (g) (A)
350 400 450 500 550
0.0 0.1 0.2 0.3 0.4 0.5 0.6 0.7 0.8 (g) (f) (h) (a) A b s o rb a n c e
Wavelength / nm (B)
350 400 450 500 550
0.0 0.1 0.2 0.3 0.4 0.5 0.6 (h) (f) A b s o rb a n c e
Wavelength / nm (a)
(C)
350 400 450 500 550
0.0 0.1 0.2 0.3 0.4 0.5 0.6 (h) (f) A b s o rb a n c e
Wavelength / nm (a)
(D)
Figure 3. UV-Vis spectra for solutions of (a) 1a; (b) 1b; and 1a in the presence of (c) HSO4−; (d) H2PO4−; (e) NO3−; (f) CN−; (g) CH3COO−; (h) F−, (i) Cl−;
(j) Br− and (k) I− as tetra-n-butylammonium salts in pure DMSO (A) and DMSO with 1.0% (B); 4.0% (C) and 10.0% (D) of water. For the concentrations of 1a and anions, see Figure 2.
350 400 450 500 550
0.0 0.1 0.2 0.3 0.4 0.5 0.6 0.7 0.8 0.9 (f) (b.h)
(a, c, d, e, i, j, k)
A b s o rb a n c e
Wavelength / nm (g) (A)
350 400 450 500 550
0.0 0.1 0.2 0.3 0.4 0.5 0.6 0.7 0.8 (g) (f) (h) (a) A b s o rb a n c e
Wavelength / nm (B)
350 400 450 500 550
0.0 0.1 0.2 0.3 0.4 0.5 0.6 (h) (f) A b s o rb a n c e
Wavelength / nm (a)
(C)
350 400 450 500 550
0.0 0.1 0.2 0.3 0.4 0.5 0.6 (h) (f) A b s o rb a n c e
Wavelength / nm (a)
equation 1,8,21,70,71 which is related to the following situation according to a 1:1 chemosensor:anion stoichiometry.
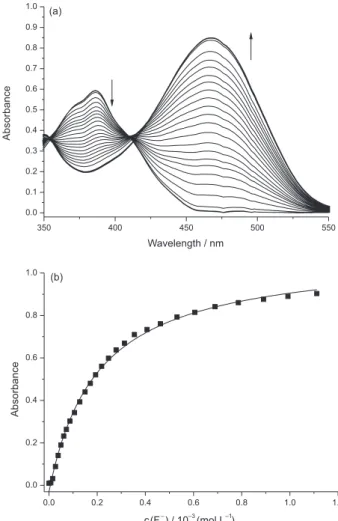
Abs = [Abs0 + Abs11K11CA−]/[1 + K11CA−] (1)
In this equation, Abs is the absorbance value after each addition of an anion, Abs0 is the initial absorbance without an anion added, Abs11 is the maximum absorbance value obtained with the addition of an anion considering a 1:1 1a:anion stoichiometry, CA− is the anion concentration for each addition, and K11 is the equilibrium constant. The results are given in Table 1 and show very good fits for all systems studied.
Figure 4a shows the UV-Vis spectra for the titration of 1a in DMSO with increasing amounts of F−. With the addition of the anion, the band with a λmax value of 384.0 nm related to compound 1a shows a reduction in the absorbance, with the simultaneous appearance of the band with λmax = 468.0 nm, due to the appearance of 1b. An isosbestic point occurs at 410.0 nm suggesting the presence of two species (1a and 1b) in equilibrium. The corresponding titration curve obtained with experimental data for the absorbance at 468.0 nm is shown in Figure 4b. The data were fitted using eqaution 1, giving the value of K11 = (4.98 ± 0.19) × 103 L mol−1 (Table 1). Titrations of 1a using CN− as the anion in DMSO and the 9:1 (v/v) DMSO-water mixture were performed (see Supporting Information (SI) section). The pattern observed for the experiment in DMSO was similar to those described for the titrations with F−. The K
11 value obtained from the titration of 1a with CN− in DMSO, of (1.56 ± 0.13) × 103 L mol−1, is lower than that obtained with F− as anion, corroborating the fact that, in DMSO, F− is a stronger base than CN−.72 In addition, the value of K11 = (1.29 ± 0.03) × 103 L mol−1 obtained for the titration of 1a with CN− in the DMSO-water (9:1; v/v) mixture shows that water molecules have a minor influence on the action of CN− as a base, probably because DMSO interacts strongly with water through hydrogen bonding, making the anion species relatively free to interact with 1a.
Figure 5 shows the 1H NMR spectra for compound
1a in DMSO-d6 in the absence and in the presence of increasing amounts of F−. Upon addition of 1.0 equivalent of the anion, the singlet at d10.22 ppm (Ha) of the hydroxyl group disappears, indicating the abstraction of the proton. Simultaneously, with the addition of more anion, the singlet at d 8.77 ppm (Hc), corresponding to the proton of the imine group, and the doublet at d 6.99 ppm of the aromatic hydrogens at the ortho position in the phenol group (Hb) were upfield shifted, generating the spectrum of 1b (Figure 5E).
An attempt was made to use 1a for the detection of CN− in water, but the solubility of the compound in this solvent is very low. Since 1a has a lipophilic character, its solubility in water should, in principle, be improved with the use of a surfactant agent.73 Thus, CTABr was used in water above its critical micellar concentration (cmc = 9.0 × 10⁻⁴ mol L−1),74 and it was observed that the solubility of 1a was considerably improved. Preliminary tests showed that of the various anions tested only CN− Table 1. Equilibrium constants at 25 °C of 1a with F− and CN− a
Experimental condition Anion K11 / (L mol−1) S.D.
DMSO F− (4.98 ± 0.19) × 103 2.0 × 10⁻⁴
DMSO CN− (1.56 ± 0.13) × 103 5.2 × 10⁻⁴
10% of water (v/v) CN− (1.29 ± 0.03) × 103 2.1 × 10⁻⁵
Water with CTABrb CN− (9.38 ± 0.28) × 104 1.4 × 10⁻³ aExperimental data were fitted using equation; bconcentration
CTABr = 3 × 10⁻³ mol L−1; DMSO: dimethyl sulfoxide;
CTABr: cetyltrimethylammonium bromide; S.D.: standard deviation; K11: equilibrium constant.
350 400 450 500 550
0.0 0.1 0.2 0.3 0.4 0.5 0.6 0.7 0.8 0.9 1.0
A
b
s
o
rb
a
n
c
e
Wavelength / nm (a)
0.0 0.2 0.4 0.6 0.8 1.0 1.2
0.0 0.2 0.4 0.6 0.8 1.0
A
b
s
o
rb
a
n
c
e
c(F–
) / 10–3
(mol L–1
) (b)
Figure 4. (a) Influence of the addition of increasing amounts of F− on the UV-Vis spectra of 1a (2 × 10⁻⁵ mol L−1) in DMSO at 25 °C. The
final concentration of F− was 1.1 × 10⁻³ mol L−1. (b) Curve showing the
caused an alteration in the aspect of the system containing 1a, from colorless to yellow. A UV-Vis study demonstrated that on the addition of CN− the band of 1a in the UV region, with a maximum at 384.0 nm, was replaced by another band in the visible region, with λmax = 406.0 nm (see SI). The pKa of 1a in water was determined as being 10.49 ± 0.02, while in micellar medium the pKa was lowered to 7.49 ± 0.02. Since the pKa values of HCN and HF are 9.21 and 3.18, respectively72 their conjugate bases are not sufficiently strong to deprotonate 1a in water, but in micellar medium only CN− is sufficiently basic to deprotonate 1a.
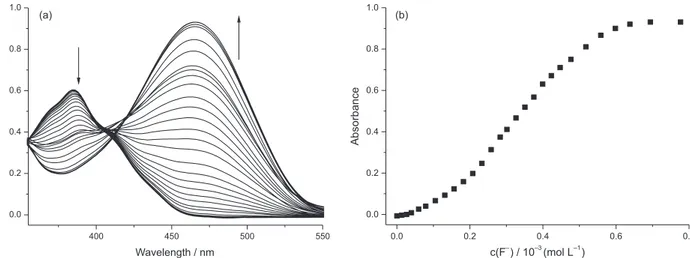
Figure 6a shows the influence of the addition of
increasing amounts of CN−on the UV-Vis spectrum of
1a in water containing CTABr above its critical micellar concentration. Significant changes were observed in the original spectrum on the addition of the anion, with the appearance of a band with λmax = 406.0 nm. Figure 6b shows the corresponding titration curve, the shape of which is typical of a 1:1 1a:anion stoichiometry. The use of equation 1 to fit the experimental data provided the result K11 = (9.38 ± 0.28) × 104 L mol−1, a value larger than that obtained in DMSO or in the DMSO-water mixture. The detection and quantification limits were determined as 4.65 × 10⁻⁷ mol L−1 and 1.55 × 10⁻⁶ mol L−1, respectively.
A chemodosimeter approach based on compound 2
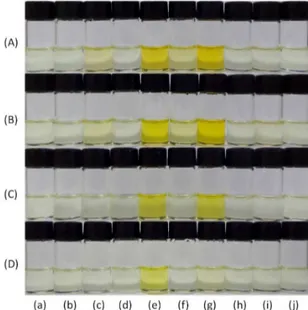
Figure 7 shows the solutions of 2 in DMSO and
DMSO-water mixtures in the absence and presence of
several anions. Solutions of compound 2 in DMSO are colorless but they become colored (orange) in the presence of CN− and F−. In relation to the other anions, a very pale yellow color was observed for the solutions containing H2PO4− and CH3COO−. On the addition of 4% of water (v/v), only the effect of CN− and F− could be observed and only CN− could be detected in the 9:1 (v/v) DMSO-water mixture.
Figure 8 shows the UV-Vis spectra for solutions of 2 in the absence and presence of the anions. For compound 2 in DMSO there is a band with maximum at 384 nm (εmax = 3.28 × 10⁴ L mol−1 cm−1), which disappears with the addition of CN− and F− giving place to another band with λmax = 468 nm (εmax = 4.79 × 10⁴ L mol−1 cm−1). It is important to observe that the latter band corresponds to that observed for the product of the reaction of 1a with CN− and F− in DMSO. Thus, it suggests that the product of the reaction of 2 under these experimental conditions is species 1b. This is also corroborated by the fact that the product of the reaction of 2 with F− and CN− in DMSO with 10% (v/v) of water has a band with λmax = 436.0 nm, at the same position as that verified in the experiment carried out with compound 1a. As observed for compound 1a, with the addition of water the system became highly selective for CN− in comparison with the species which provided positive results in DMSO, indicating that water in smaller amounts efficiently hydrates H2PO4− and CH3COO−, and at 10% (v/v) it hydrates F−, hindering the action of anions as nucleophilic species. Scheme 3 summarizes the chemodosimeter
(A) without F
-(B) 1.0 eq. F
-(C) 2.0 eq. F
-(D) 3.0 eq. F
-(E) 4.0 eq. F
-a c b
c b
b
b
b c
c
c
N
OH
N
O TBAF
DMSO-d6
1a 1b
a
c b
Figure 5. 1H NMR spectra (200 MHz) of 1a in the absence (A) and in the presence of 1.0 (B), 2.0 (C), 3.0 (D) and 4.0 (E) equivalents of tetra-n
event occurs prior to the nucleophilic attack of the anion. Thus, the 1H NMR spectra were obtained for 2 in DMSO-d
6 in the absence and in the presence of F− after 5 min of reaction (Figure 10). A comparison of the spectra reveals that on addition of the anion the signals of the singlet at d 8.82 ppm (Ha) and doublet at d 7.09 ppm (Hb) were shifted to d 8.36 ppm (Hc) and d 6.12 ppm (Hd). The final spectrum coincides with the 1H NMR spectrum of 1a in the presence of F− in excess (Figure 5E), revealing that the same species, 1b, was formed in the two cases. However, the spectra obtained using small amounts of the anion did not show any alteration in the position of the signals, which suggests that F− has a very weak interaction with the compound prior to the reaction with the silicon center. The literature reports studies involving weak CH−F hydrogen bonds in different organic systems.78-80 Alternatively, the interaction of two equivalents of F− with the silicon atom was reported in other papers.53,76,81 Mass spectrometric studies of 2 in the presence of an excess of F− and CN− showed that the anions caused the Si−O bond breaking, with the formation of 1b (see SI), without evidences for the occurrence of other intermediates. Therefore, the results suggest that there is a very weak interaction between F− and the hydrogen atom of the imine group in the compound before the action of the anion as a nucleophile. A comparison of the curves for the titration of 1a and 2 with F− suggests that the same interaction does not occur for compound 1a, where the anion simply acts as a base abstracting the phenolic proton.
The UV-Vis spectra for the titration of compound 2 in DMSO with the addition of CN− (Figure 11a) show a
300 350 400 450 500
0.0 0.1 0.2 0.3 0.4 0.5
(a)
A
b
s
o
rb
a
n
c
e
Wavelength / nm
0 2 4 6 8
0.30 0.35 0.40 0.45 0.50
A
b
s
o
rb
a
n
c
e
c (CN–
) / 10–5
(mol L–1
) (b)
Figure 6. (a) Influence of the addition of increasing amounts of CN− on the UV-Vis spectra of 1a (2 × 10⁻⁵ mol L−1) in CTABr/water at 25 °C.
The final concentration of CN− was 7.4 × 10⁻⁵ mol L−1 and CTABr was
used in a concentration of 3.0 × 10⁻³ mol L−1. (b) Curve showing the
variation in the absorbance at 406 nm of 1a with the addition of increasing amounts of CN−.
Figure 7. Solutions of (a) 2; and 2 in the presence of (b) HSO4−; (c) H
2PO4−;
(d) NO3−; (e) CN−; (f) CH3COO−; (g) F−; (h) Cl−; (i) Br− and (j) I− as
tetra-n-butylammonium salts in DMSO (A) and DMSO with 1.0% (B); 4.0% (C) and 10.0% (D) of water. The concentration of each anion was 3.0 × 10⁻³ mol L−1 and of 2 was 2.0 × 10⁻⁵ mol L−1.
approach based on compound 2. The nucleophilic attack of the anionic species on the silicon center, through a nucleophilic substitution at silicon (SN2@Si),53,75-77 releases colored 1b species as the leaving group, which makes this process effective for the detection of strongly nucleophilic analytes, such as F− and CN− in anhydrous DMSO. On the addition of water, the system becomes highly selective toward CN−, which remains an efficient nucleophile under these experimental conditions.
Figure 9a shows the UV-Vis spectra corresponding to the titration of compound 2 in DMSO with increasing amounts of F−. On the addition of F− a reduction in the intensity of the band related to 2 at 384 nm occurs with the simultaneous appearance of the band for 1b at
λmax = 468 nm. The titration curve in Figure 9b was obtained using the absorbance values at 468 nm as a function of c(F−). The sigmoidal profile of the curve and the absence of an isosbestic point on the UV-Vis spectra suggest that some
300 350 400 450 500
0.0 0.1 0.2 0.3 0.4 0.5
(a)
A
b
s
o
rb
a
n
c
e
Wavelength / nm
0 2 4 6 8
0.30 0.35 0.40 0.45 0.50
A
b
s
o
rb
a
n
c
e
c (CN–
) / 10–5 (mol L–1
reduction in the intensity of the band related to 2 at 384 nm and the simultaneous appearance of the band for 1b at
λmax = 468 nm. An isosbestic point occurred at 410 nm, which suggests that one species (2) is gives rise to the product (1b) with no intermediate species. The titration curve in Figure 11b was obtained using the absorbance values at 468 nm as a function of c(F−). The curve does not show a sigmoidal shape, which suggests that there is no interaction of the anion with the compound prior to the nucleophilic attack. This corroborates the explanation given for the behavior of 2 in the presence of F−, since
CN− does not form hydrogen bonds as effectively as F−. Equation 1 was used to fit the experimental data, providing further evidence for a 1:1 2:anion stoichiometry, with K11 = (4.03 ± 0.22) × 103 L mol−1 (standard deviation (S.D.) = 0.055). The titration of 2 with CN− in DMSO with 10% (v/v) of water at 25 °C revealed a similar pattern (see SI), except for the fact that for the band corresponding to the appearance of 1b the λmax is 436 nm, as observed in the experiments with 1a and CN− in the same aqueous DMSO mixture. The detection and quantification limits were 3.59 × 10⁻⁵ mol L−1 and 1.20 × 10⁻⁴ mol L−1, respectively.
+F- N
O -N O Si CH3 C H3 CH3 CH3 C H3 CH3 Si CH3 C H3 CH3 CH3 C
H3 CH3 F
+
2
Colorless solution Orange solution1b
Scheme 3. Nucleophilic attack of F− on the silicon center of chemodosimeter 2.
400 450 500 550
0.0 0.2 0.4 0.6 0.8 1.0
(a, b, d, h, i, j)
(g) (e) (f) A b s o rb a n c e
Wavelength / nm (c) (A)
400 450 500 550
0.0 0.2 0.4 0.6 0.8 1.0 A b s o rb a n c e
Wavelength / nm (a) (g) (e) (f) (c) (B)
400 450 500 550
0.0 0.2 0.4 0.6 0.8 1.0 A b s o rb a n c e
Wavelength / nm (a) (g) (e) (f) (c) (C)
400 450 500 550
0.0 0.2 0.4 0.6 0.8 1.0 A b s o rb a n c e
Wavelength / nm (a) (g) (e) (f) (c) (D)
Figure 8. UV-Vis spectra for solutions of (a) 2 and 2 in the presence of (b) HSO4−; (c) H2PO4−; (d) NO3−; (e) CN−; (f) CH3COO−; (g) F−; (h) Cl−; (i) Br− and
(j) I− as tetra-n-butylammonium salts in DMSO (A) and DMSO with 1.0% (B); 4.0% (C) and 10.0% (D) of water. For concentrations of 2 and anions see Figure 7.
400 450 500 550
0.0 0.2 0.4 0.6 0.8 1.0
(a, b, d, h, i, j)
(g) (e) (f) A b s o rb a n c e
Wavelength / nm (c) (A)
400 450 500 550
0.0 0.2 0.4 0.6 0.8 1.0 A b s o rb a n c e
Wavelength / nm (a) (g) (e) (f) (c) (B)
400 450 500 550
0.0 0.2 0.4 0.6 0.8 1.0 A b s o rb a n c e
Wavelength / nm (a) (g) (e) (f) (c) (C)
400 450 500 550
0.0 0.2 0.4 0.6 0.8 1.0 A b s o rb a n c e
Figure 9. (a) Influence of the addition of increasing amounts of F− on the UV-Vis spectra of 2 (2 × 10⁻⁵ mol L−1) in DMSO at 25 °C. The final concentration
of F− was 8.0 × 10⁻⁴ mol L−1. (b) Curve showing the variation in the absorbance at 468 nm of 2 with the addition of increasing amounts of F−.
400 450 500 550
0.0 0.2 0.4 0.6 0.8 1.0
(a) (b)
A
b
s
o
rb
a
n
c
e
Wavelength / nm c(F–) / 10–3(mol L–1)
0.0 0.2 0.4 0.6 0.8
0.0 0.2 0.4 0.6 0.8 1.0
A
b
s
o
rb
a
n
c
e
a
a
a
b
d
c b
b c
c
d
d (A) without F
-(B) 0.5 eq. F
-(C) 1.0 eq. F
-(D) 2.0 eq. F
-N
O Si N O
TBAF
a b c d DMSO-d6 +
F
Si
2 1b
Figure 10. 1H NMR spectra (200 MHz) for 2 in the absence (A) and in the presence of 0.5 (B); 1.0 (C) and 2.0 (D) equivalents of tetra-n-butylammonium
fluoride in DMSO-d6 solution.
400 450 500 550
0.0 0.2 0.4 0.6 0.8 1.0
(a)
A
b
s
o
rb
a
n
c
e
Wavelength / nm
0.0 0.5 1.0 1.5 2.0 2.5 3.0 3.5
0.0 0.2 0.4 0.6 0.8 1.0
(b)
A
b
s
o
rb
a
n
c
e
c(CN–) / 10–3(mol L–1)
Figure 11. (a) Influence of the addition of increasing amounts of CN− on the UV-Vis spectra of 2 (2 × 10⁻⁵ mol L−1) in DMSO at 25 °C. The final concentration
Conclusions
Compounds 1a and 2 were synthesized and studied in two different strategies for the optical detection of F− and CN−. Compound 1a is a phenol and it was used as an anionic chromogenic chemosensor in DMSO through an acid-base strategy. With the addition of small amounts of water, the system could be used only for the visual and quantitative detection of CN−. Although 1a is not soluble in water at the concentration required for optical chemosensors, the use of a cationic surfactant (CTABr) was found to be a very efficient approach to improve the solubility of the compound and to lower its pKa value, enabling the use of the system for the highly selective optical detection of CN−. In addition, the detection and quantification limits of the method (4.65 × 10⁻⁷ mol L−1 and 1.55 × 10⁻⁶ mol L−1, respectively) are close to the maximum level of c(CN−) in potable water allowed by the World Health Organization, which is 1.7 µmol L−1.82
Another strategy was studied using the basic framework of 1a to construct the chemodosimeter 2. This chemodosimeter approach was studied in DMSO, which is based on the nucleophilic attack of the anionic species on the silicon center, through a nucleophilic substitution at silicon (SN2@Si). Dye 1b is generated in this process, which signals the presence of F− and CN−. With the addition of 10% (v/v) of water, the system is able to detect only CN−. Since water hydrates F−, the action of this anion as a nucleophilic species is hindered.
In conclusion, the system described herein for anionic detection is versatile, allowing its use in organic and aqueous media. In addition, simple synthetic modifications can be envisioned, for instance in the conjugated bridge and the use of substituents at the phenol and pyrene moieties in the molecules, which should allow access to new fluorogenic systems and more efficient techniques for anion sensing.
Supplementary Information
Supplementary data are available free of charge at http://jbcs.sbq.org.br as PDF file.
Acknowledgements
The financial support of the Brazilian Conselho Nacional de Desenvolvimento Científico e Tecnológico (CNPq), Coordenação de Aperfeiçoamento de Pessoal de Nível Superior (CAPES), Laboratório Central de Biologia Molecular (CEBIME/UFSC), and UFSC is gratefully acknowledged.
References
1. Martínez-Máñez, R.; Sancenón, F.; Chem. Rev. 2003, 103, 4419. 2. Cho, D.-G.; Sessler, J. L.; Chem. Soc. Rev. 2009, 38, 1647. 3. Duke, R. M.; Veale, E. B.; Pfeffer, F. M.; Kruger, P. E.;
Gunnlaugsson, T.; Chem. Soc. Rev. 2010, 39, 3936.
4. Gale, P. A.; Busschaert, N.; Haynes, C. J. E.; Karagiannidis, L. E.; Kirby, I. L.; Chem. Soc. Rev. 2014, 43, 205.
5. Kim, H. N.; Guo, Z.; Zhu, W.; Yoon, J.; Tian, H.; Chem. Soc. Rev. 2011, 40, 79.
6. Suksai, C.; Tuntulani, T.; Chem. Soc. Rev. 2003, 32, 192. 7. Wenzel, M.; Hiscock, J. R.; Gale, P. A.; Chem. Soc. Rev. 2012,
41, 480.
8. Nicoleti, C. R.; Marini, V. G.; Zimmermann, L. M.; Machado, V. G.; J. Braz. Chem. Soc. 2012, 23, 1488.
9. Wiskur, S. L.; Ait-Haddou, H.; Lavigne, J. J.; Anslyn, E. V.; Acc. Chem. Res. 2001, 34, 963.
10. Nandi, L. G.; Nicoleti, C. R.; Bellettini, I. C.; Machado, V. G.; Anal. Chem. 2014, 86, 4653.
11. Wang, F.; Wang, L.; Chen, X.; Yoon, J.; Chem. Soc. Rev. 2014, 43, 4312.
12. Moragues, M. E.; Martínez-Máñez, R.; Sancenón, F.; Chem. Soc. Rev. 2011, 40, 2593.
13. Kaur, K.; Saini, R.; Kumar, A.; Luxami, V.; Kaur, N.; Singh, P.; Kumar, S.; Coord. Chem. Rev. 2012, 256, 1992.
14. Zimmermann-Dimer, L. M.; Machado, V. G.; Quím. Nova 2008, 31, 2134.
15. Gunnlaugsson, T.; Glynn, M.; Tocci, G. M.; Kruger, P. E.; Pfeffer, F. M.; Coord. Chem. Rev. 2006, 250, 3094.
16. Anslyn, E. V.; J. Org. Chem. 2007, 72, 687.
17. Du, J.; Hu, M.; Fan, J.; Peng, X.; Chem. Soc. Rev. 2012, 41, 4511.
18. Ma, J.; Dasgupta, P. K.; Anal. Chim. Acta 2010, 673, 117. 19. Hong, K.-H.; Kim, H.-J.; Supramol. Chem. 2012, 25, 24. 20. Männel-Croisé, C.; Probst, B.; Zelder, F.; Anal. Chem. 2009,
81, 9493.
21. Zimmermann-Dimer, L. M.; Machado, V. G.; Dyes Pigm. 2009, 82, 187.
22. Zimmermann-Dimer, L. M.; Reis, D. C.; Machado, C.; Machado, V. G.; Tetrahedron 2009, 65, 4239.
23. Kumar, S.; Singh, P.; Hundal, G.; Hundal, M. S.; Kumar, S.; Chem. Commun. 2013, 49, 2667.
24. Gotor, R.; Costero, A. M.; Gil, S.; Parra, M.; Martínez-Máñez, R.; Sancenón, F.; Gaviña, P.; Chem. Commun. 2013, 49, 5669. 25. Lv, J.; Zhang, Z.; Li, J.; Luo, L.; Forensic Sci. Int. 2005, 148,
15.
26. Schnepp, R.; J. Emerg. Nurs. 2006, 32, S3.
27. Bolarinwa, I. F.; Orfila, C.; Morgan, M. R. A.; Food Chem. 2014, 152, 133.
29. Sweeney, L. M.; Sommerville, D. R.; Channel, S. R.; Toxicol. Sci. 2014, 138, 205.
30. Gupta, R.; Kumar, A. N.; Bandhu, S.; Gupta, S.; Scand. J. Rheumatol. 2007, 36, 154.
31. Choi, A. L.; Sun, G.; Zhang, Y.; Grandjean, P.; Environ. Health Perspect. 2012, 120, 1362.
32. Li, L.; Crit. Rev. Oral Biol. Med. 2003, 14, 100.
33. Yang, Y.; Zhao, Q.; Feng, W.; Li, F.; Chem. Rev. 2012, 113, 192. 34. Marini, V. G.; Torri, E.; Zimmermann, L. M.; Machado, V. G.;
Arkivoc 2010, 146.
35. Zelder, F. H.; Männel-Croisé, C.; Chimia 2009, 63, 58. 36. Chen, C.-H.; Leung, M.-K.; Tetrahedron 2011, 67, 3924. 37. Huang, W.; Li, Y.; Yang, Z.; Lin, H.; Lin, H.; Spectrochim. Acta,
Part A 2011, 79, 471.
38. Zang, L.; Wei, D.; Wang, S.; Jiang, S.; Tetrahedron 2012, 68, 636.
39. Zhang, X.; Fu, J.; Zhan, T.-G.; Dai, L.; Chen, Y.; Zhao, X.; Tetrahedron Lett. 2013, 54, 5039.
40. Zhou, Y.; Zhang, J. F.; Yoon, J.; Chem. Rev. 2014, 114, 5511. 41. Isaad, J.; Salaün, F.; Sens. Actuators, B 2011, 157, 26. 42. Kim, S. Y.; Hong, J.-I.; Org. Lett. 2007, 9, 3109.
43. Ke, B.; Chen, W.; Ni, N.; Cheng, Y.; Dai, C.; Dinh, H.; Wang, B.; Chem. Commun. 2013, 49, 2494.
44. Luo, Z.; Yang, B.; Zhong, C.; Tang, F.; Yuan, M.; Xue, Y.; Yao, G.; Zhang, J.; Zhang, Y.; Dyes Pigm. 2013, 97, 52. 45. Hou, P.; Chen, S.; Wang, H.; Wang, J.; Voitchovsky, K.;
Song, X.; Chem. Commun. 2014, 50, 320.
46. Xu, J.; Sun, S.; Li, Q.; Yue, Y.; Li, Y.; Shao, S.; Anal. Chim. Acta 2014, 849, 36.
47. Cheng, X.; Jia, H.; Feng, J.; Qin, J.; Li, Z.; Sens. Actuators, B 2014, 199, 54.
48. Huang, Y.-C.; Chen, C.-P.; Wu, P.-J.; Kuo, S.-Y.; Chan, Y.-H.; J. Mater. Chem. B 2014, 2, 6188.
49. Roy, A.; Kand, D.; Saha, T.; Talukdar, P.; Chem. Commun. 2014, 50, 5510.
50. Kumari, N.; Dey, N.; Bhattacharya, S.; Analyst 2014, 139, 2370. 51. Sokkalingam, P.; Lee, C.-H.; J. Org. Chem. 2011, 76, 3820. 52. Kim, T.-H.; Swager, T. M.; Angew. Chem., Int. Ed. 2003, 42,
4803.
53. Li, X.; Hu, B.; Li, J.; Lu, P.; Wang, Y.; Sens. Actuators, B 2014, 203, 635.
54. Li, B.; Zhang, C.; Liu, C.; Chen, J.; Wang, X.; Liu, Z.; Yi, F.; RSC Adv. 2014, 4, 46016.
55. Goswami, S.; Das, A. K.; Manna, A.; Maity, A. K.; Fun, H.-K.; Quah, C. K.; Saha, P.; Tetrahedron Lett. 2014, 55, 2633. 56. Cao, X.; Lin, W.; Yu, Q.; Wang, J.; Org. Lett. 2011, 13, 6098.
57. Bao, Y.; Liu, B.; Wang, H.; Tian, J.; Bai, R.; Chem. Commun. 2011, 47, 3957.
58. Li, L.; Ji, Y.; Tang, X.; Anal. Chem. 2014, 86, 10006. 59. Nicoleti, C. R.; Nandi, L. G.; Machado, V. G.; Anal. Chem.
2015, 87, 362.
60. Kung, Y.-C.; Hsiao, S.-H.; J. Mater. Chem. 2010, 20, 5481. 61. Babu, P.; Sangeetha, N. M.; Vijaykumar, P.; Maitra, U.;
Rissanen, K.; Raju, A. R.; Chem. Eur. J. 2003, 9, 1922. 62. Ros-Lis, J. V.; Martínez-Máñez, R.; Soto, J.; Chem. Commun.
2002, 2248.
63. Tomasulo, M.; Raymo, F. M.; Org. Lett. 2005, 7, 4633. 64. Ros-Lis, J. V.; Martínez-Máñez, R.; Soto, J.; Chem. Commun.
2005, 5260.
65. Sun, Y.; Wang, G.; Guo, W.; Tetrahedron 2009, 65, 3480. 66. Marini, V. G.; Zimmermann, L. M.; Machado, V. G.;
Spectrochim. Acta, Part A 2010, 75, 799.
67. Marcus, Y.; J. Chem. Soc., Faraday Trans. 1991, 87, 2995. 68. Zhan, C.-G.; Dixon, D. A.; J. Phys. Chem. A 2004, 108, 2020. 69. Reichardt, C.; Chem. Rev. 1994, 94, 2319.
70. Connors, K. A.; Binding Constants: the Measurement of Molecular Complex Stability; Wiley: New York, 1987. 71. Chen, Y.; Xu, T.; Shen, X.; Gao, H.; J. Photochem. Photobiol., A
2005, 173, 42.
72. Bordwell, F. G.; Acc. Chem. Res. 1988, 21, 456.
73. Tehrani-Bagha, A.; Holmberg, K.; Materials 2013, 6, 580. 74. Li, W.; Zhang, M.; Zhang, J.; Han, Y.; Front. Chem. China 2006,
1, 438.
75. Bento, A. P.; Bickelhaupt, F. M.; J. Org. Chem. 2007, 72, 2201. 76. Pierrefixe, S. C. A. H.; Fonseca-Guerra, C.; Bickelhaupt, F. M.;
Chem. Eur. J. 2008, 14, 819.
77. Clayden, J.; Greeves, N.; Warren, S.; Organic Chemistry; OUP: Oxford, 2012.
78. Spada, L.; Gou, Q.; Vallejo-Lopez, M.; Lesarri, A.; Cocinero, E. J.; Caminati, W.; Phys. Chem. Chem. Phys. 2014, 16, 2149. 79. Caminati, W.; López, J. C.; Alonso, J. L.; Grabow, J.-U.; Angew.
Chem., Int. Ed. 2005, 44, 3840; Caminati, W.; López, J. C.; Alonso, J. L.; Grabow, J.-U.; Angew. Chem. 2005, 117, 3908. 80. Kang, J.; Lee, H. G.; Han, Y.; Hwang, I. H.; Kim, C.; Cho, S.;
J. Supramol. Chem. 2012, 24, 738.
81. Chuit, C.; Corriu, R. J. P.; Reye, C.; Young, J. C.; Chem. Rev. 1993, 93, 1371.
82. World Health Organization (WHO); Guidelines for Drinking-Water Quality, 4th ed., 2011.
Submitted: April 15, 2015