UNIVERSIDADE NOVA DE LISBOA
Faculdade de Ciências e Tecnologia
CHEMICAL REACTION NETWORK OF
FLAVYLIUM IONS IN
HETEROGENEOUS MEDIA
RAQUEL GOMES
Dissertação apresentada para a obtenção do
Grau de Doutor em Química, especialidade em
Química-Física, pela Universidade Nova de
Lisboa, Faculdade de Ciências e Tecnologia
Supervisor:
Professor Doutor Fernando Pina
Co-supervisor:
Professor Doutor A. Jorge Parola
LISBOA
To my parents
Aos meus pais
“O que a vida apresenta de pior não é a violenta catástrofe, mas a monotonia dos
momentos semelhantes; numa ou se morre ou se vence, na outra verás que o maior
número nem venceu nem morreu: flutua sem norte e sem esperança. Não te deixes
derrubar pela insignificância dos pequenos movimentos e serás homem para os
grandes; se jamais te faltar a coragem para afrontar os dias em que nada se passa,
poderás sem receio esperar os tempos em que o mundo se vira.”
Acknowledgments
It’s hard to sit down after all this time and think how many persons have given a contribution to this work. I will give it a try, but I will forget someone, so I apologize right before beginning.
First of all, I would like to thank my supervisor, Professor Fernando Pina, not only because he has believed in me, but most of all for the moments he didn’t. For all the discussions, for all the fights and the moments when he was away which made me grow-up. For giving me all the opportunities… And because I will never forget that the experimental part, the Lab work, I have learned directly from him…
Professor Jorge Parola, my dear co-supervisor, I thank you for letting me think alone before giving me the solution, for all the synthetic help and for making me repeat experiments 1000 times – in the end it was really all right! I thank you for being the glue that keeps our group together and for calming down my nervous crisis. And I will never forget that paper we have written TOGETHER!
Chemical Reaction Network of Flavylium Ions in Heterogeneous Media
I would like to thank Mestre Alexandre Jesus, for the work we have done together and all I have learnt from him in the synthesis Lab, besides a personal friendship. And Mestre Ana Marta Diniz, for being a good master student, for the strict collaboration we have developed and, most of all, for being always there. André Vidal Pinheiro has been an example of intelligence, persistence and integrity throughout these years. I acknowledge you for all the good talks, for listening to me and for precious advices.
I acknowledge Professor Luisa De Cola for accepting me for a short term period in the Westfälische Wilhelms-Universität Münster and for the fruitful discussions, and all the AG De Cola that has integrated me so well. We really had good times there! Particularly, I would like to thank Doctor Rodrigo Q. Albuquerque, for having supervised my work there, for giving me the motivation and the optimism I needed.
I also would like to acknowledge Professor Frank-Gerrit Klärner, Doctor Frank Bastkowski and Doctor Jolanta Polkowska, for providing us the molecular clips, for the collaborative work and for the fruitful discussions on the results.
Professor J. M. G. Martinho and Doctor A. Federov from IST are acknowledged for the time resolved fluorescence and fluorescence anisotropy measurements. BASF Corp. is acknowledged for the kind donation of Pluronic F127.
I deeply thank all my friends, for the help and support and for tolerating my absences and my bad moods. For having believed in me and kept me going forward. You know who you are and I won’t make a list. But, particularly, André Pontes da Costa for the help and support in the initial phase of this thesis and Leonardo Mendes for some pictures’ treatment.
Gabriele De Paoli, I would like to thank you for all the support, the talks (I am never tired of talking to you) and sorry for being so annoying while I was writing this thesis! You know how important you are and the reason why!
Finalmente, e seguramente com a maior importância, quero agradecer aos meus pais todo o seu incondicional apoio.
Abstract
Flavylium compounds (2-phenyl-1-benzopyrylium) constitute a versatile family of molecules that illustrates the concept of multistate system, since different forms exhibiting diverse properties can be obtained by means of external inputs such as pH and light. Dramatic changes in the properties of the flavylium network can be observed in heterogeneous media due to specific interactions of some of the states with different chemical microenvironments. In this thesis, the effects of CTAB micelles (chapters 2 and 3), Pluronic micelles and gels (chapter 4) and encapsulation in molecular clips (chapter 5) and zeolite L (chapter 6) on the chemical reaction network of flavylium ions are reported.
Positively charged CTAB micelles, stabilizing trans-chalcone species, Ct, can be used to achieve efficient photochromism of flavylium compounds. 2-styryl-1-benzopyrylium salts, obtained by the introduction of a double bond between the benzopyrylium and the phenyl units, exhibit red shifted absorption maxima compared with flavylium analogues (up to 90 nm). This new family of compounds allows the design of photochromic systems based on CTAB micelles; in particular, switching from yellow to light blue using these derivatives of natural anthocyanins is possible. Flash photolysis experiments provided evidence for a singlet state isomerization process.
In Pluronic media, photochromic gels based on the flavylium network can be obtained. In chapter 4, the Ct photochromic mechanism was analyzed, using mainly fluorescence techniques such as steady-state, time-resolved and anisotropy. Evidences for Ct distribution among different sites within the Pluronic aggregate and for selective Ct photochemistry were found.
Finally, our approach focused on the encapsulation of flavylium salts. The association between a sulphate molecular clip and the several species from the network of a flavylium salt afforded water soluble host-guest complexes that were thoroughly studied. It was demonstrated that hydrophobic interactions between the molecular clips and the flavylium guest molecules are dominant; the other potential interactions, which certainly determine the structures of these host-guest complexes to a large extent, seem to be of minor importance for their stability. The hydration of the flavylium cation was found to be retarded in the presence of clip and the photochemically induced trans-cis isomerization seems essentially unaffected by the sulphate molecular clip.
Chemical Reaction Network of Flavylium Ions in Heterogeneous Media
Resumo
Os sais de flavílio (2-fenil-1-benzopirílio) constituem uma família versátil de moléculas que ilustra o conceito de sistemas multiestados, uma vez que formas diferentes, exibindo propriedades diversas, podem ser obtidas através de estímulos externos, tais como pH e luz. Mudanças dramáticas nas propriedades da característica rede de reacções dos compostos de flavílio podem ser observadas em meios heterogéneos, devido a interacções específicas de alguns dos estados com diferentes ambientes químicos. Nesta tese estuda-se o efeito na rede de reacções químicas dos flavílios de micelas de CTAB (capítulos 2 e 3), de micelas e géis de Plurónico (capítulo 4) e da encapsulação em clips moleculares (capítulo 5) e no zeólito L (capítulo 6).
As micelas de CTAB positivamente carregadas, estabilizando a trans-chalcona, Ct, podem ser utilizadas para obter fotocrosmismo eficiente com flavílios. Os sais de 2-estiril-1-benzopirílio, obtidos pela inserção de uma ligação dupla entre as unidades fenil e 2-estiril-1-benzopirílio, exibem um desvio do comprimento de onda máximo de absorção para o vermelho, comparativamente aos flavílios análogos (até 90 nm). Esta nova família de compostos permite o design de sistemas fotocrómicos, baseados em micelas de CTAB; em particular, é possível mudar de amarelo para azul, usando estes derivados sintéticos das antocianinas. Utilizando fotólise de laser pulsado, pôde concluir-se que o processo de isomerização ocorre no estado excitado singuleto.
Na presença de Plurónico, géis fotocrómicos podem ser obtidos. No Capítulo 4, o mecanismo do fotocromismo da Ct foi analisado, usando sobretudo técnicas de fluorescência, tais como fluorescência de estado estacionário, resolvida no tempo e anisotropia. Foram encontradas provas experimentais para a distribuição de Ct por diferentes regiões dos agregados de Plurónico e para a ocorrência de fotoquímica selectiva.
Finalmente, a nossa abordagem concentrou-se na encapsulação de sais de flavílio. A associação entre o clip molecular sulfato e as diferentes espécies da rede de um flavílio, resulta na formação de complexos hospedeiro-hóspede que foram sistematicamente estudados. Foi demonstrado que as interacções hidrofóbicas entre os clips moleculares e os hóspedes de flavílio são dominantes; as outras interacções potenciais, que condicionam largamente as estruturas dos complexos hospedeiro-hóspede, parecem ter menor importância na sua estabilidade. A hidratação do catião flavílio é mais lenta e a fotoisomerização trans-cis parece não ser afectada na presença do clip sulfato.
Résumé
Les ions flavyliums constituent une famille versatile de molécules et illustrent le concept de systèmes multi-états où différentes espèces dotés de propriétés singulières peuvent être obtenues par l’intervention de stimuli comme le pH ou la lumière. Des changements importants des propriétés de ce réseau moléculaire peuvent être obtenus dans des milieux hétérogènes du fait d’interactions spécifiques de certains états avec les différents microenvironnements chimiques. Dans cette thèse, les effets de micelles CTAB (chapitre 2 et 3) de micelles et gels pluroniques (chapitre 4), l’encapsulation dans des clips moléculaires (chapitre 5) et dans des zéolites L (chapitre 6) sur le réseau de réactions chimiques des ions flavyliums sont reportés.
Les micelles chargées positivement CTAB, qui stabilisent l’espèce trans-chalcone Ct peuvent être utilisées pour réaliser un photochromisme efficace des ions flavyliums. Des sels de 2-styryl-1-benzopyrylium, obtenus par l’introduction d’une double liaison entre les unités benzopyrilium et phenyl montrent des déplacements vers le rouge par rapport aux analogues flavylium (jusqu’à 90nm). Cette nouvelle famille de composés permet la conception de systèmes photochromiques basés sur des micelles CTAB; en particulier, un changement de couleur du jaune au bleu est possible en utilisant ces dérivés synthétiques des anthocyanines. Des expériences de spectroscopie d’absorption transitoire ont mis en évidence une photoisomérisation à l’état singulet.
Dans les milieux pluroniques, des gels photochromiques basés sur le réseau des ions flavyliums peuvent être obtenus. Dans le chapitre 4, le mécanisme du photochromisme de Ct a été analysé en utilisant principalement des techniques de fluorescence (i.e. spectroscopies stationnaires, d’anisotropie et résolues dans le temps). Une distribution de Ct sur différents sites au sein des agrégats pluroniques et une photochimie sélective ont pu être prouvées.
Finalement, notre approche a été étendue à l’encapsulation des ions flavyliums. L’association entre un clip moléculaire sulfaté et les différentes espèces du réseau ont permis la formation de complexes hôte-invité hydrosolubles. Leur étude a permis de démontrer que les interactions hydrophobiques entre les clips moléculaires et les espèces invités de type flavylium sont prédominantes ; les autres interactions potentielles qui déterminent la structure des complexes sont de moindres importances pour leur stabilité. Il a été démontré que la réaction d’hydratation des ions flavyliums est retardée en présence du clip moléculaire et que la réaction de photoisomerisation cis-trans n’est pas affectée dans le complexe.
Chemical Reaction Network of Flavylium Ions in Heterogeneous Media
Abbreviations List
A a.u. C0 c
CMC CMT COSY CTAB
δ ε Φi
F I0
I IC ISC J
kj
λ
λ em λ exc λ irr λ max
ν
η ηi
NMR NOESY P PSS
r
r0
T
τl
U.V.-Vis
Absorbance Arbitrary unit
Total concentration of species Speed of light
Critical micelle concentration Critical micelle temperature Correlation spectroscopy
Cetyl trimethylammonium bromide Chemical shift
Molar absorption coefficient Quantum yield for a given process i
Fluorescence
Light intensity emitted by irradiation source at a selected wavelength Intensity of emission
Internal Conversion Intersystem crossing Coupling constant
Rate constant for a given process j, e. g. , knr = rate constant for non radiative
processes Wavelength
Emission wavelength Excitation wavelength Irradiation wavelength
Wavelength of maximum emission or absorption Wavenumber
Viscosity
Efficiency for a given process i
Nuclear magnetic resonance spectroscopy Nuclear Overhauser effect spectroscopy Phosphorescence
Photostationary state Anisotropy
Fundamental anisotropy Temperature
Lifetime for a given process l
AH22+
AH+ A A- B Cc Cc -Ct Ct- CtH+ CB
Ka+
Ka(1) Ka2
KCt+
KCt(1)
Kh
Kt
Ki
K’a
ka
k-a
kh
k-h
kt
k-t
ki
k-i
k-i+
...
Protonated amino flavylium cation Flavylium cation
Quinoidal base Ionized quinoidal base Hemiketal
Cis-chalcone Ionized cis-chalcone
Trans-chalcone Ionized trans-chalcone
Protonated amino trans-chalcone Conjugated bases (A, B, Cc and Ct)
Equilibrium constant for the deprotonation of AH22+
Equilibrium constant for the deprotonation of AH+ Equilibrium constant for the deprotonation of A Equilibrium constant for the deprotonation of CtH+ Equilibrium constant for the deprotonation of Ct Equilibrium constant for the hydration of AH+ Equilibrium constant for the tautomerization of the B Equilibrium constant for the isomerization of Cc Apparent equilibrium constant between AH+and CB
Kinetic constant for the direct deprotonation reaction (formation of A) Kinetic constant for the inverse deprotonation reaction (the protonation of A) Kinetic constant for the direct hydration reaction
Kinetic constant for the inverse hydration reaction (the dehydration of B) Kinetic constant for the direct tautomerization reaction
Kinetic constant for the inverse tautomerization reaction Kinetic constant for the direct isomerization reaction Kinetic constant for the inverse isomerization reaction
Kinetic constant for the inverse isomerization reaction (of CtH+)
Index
1. Introduction ...1
1.1. Basic principles of photophysics and photochemistry ... 1
1.1.1. Light absorption ... 1
1.1.2. Fate of the excited state... 4
1.1.3. Lifetimes, quantum yields and efficiencies... 6
1.1.4. An example of an unimolecular process: cis-trans isomerization ... 8
1.1.5. Bimolecular processes... 9
1.1.6. Emission and excitation spectra ... 10
1.1.7. Fluorescence anisotropy... 11
1.2. Flavylium ions... 15
1.2.1. Structure of flavylium salts and historical background... 15
1.2.2. Network of reactions ... 16
1.2.3. Thermodynamics of the network of reactions... 17
1.2.4 Kinetics of the network of reactions ... 20
1.2.5. Flash photolysis and continuous irradiation... 22
1.2.6. Photostationary state ... 24
1.2.7. Synthesis ... 25
1.2.8. Multistate/Multifunctional molecular-level systems based on photochromic flavylium compounds ... 28
1.3. Scope of the present thesis ... 40
1.4. References ... 41
2. Efficient photochromism from the network of chemical reactions of flavylium ions in CTAB micelles ...43
2.1 Introduction ... 43
2.2 7,4’-Dihydroxyflavylium (DHF)... 46
2.2.1 The reaction network in water... 47
2.2.2 Addition of CTAB micelles ... 48
2.2.3 How CTAB micelles improve the photochromism... 50
2.3 7-(N,N-Diethylamino)-4’-hydroxyflavylium (DEF) ... 54
2.3.1 The reaction network in water... 54
2.3.2 Addition of CTAB micelles ... 56
2.3.3 Kinetics of the flavylium network in the presence of CTAB micelles ... 60
2.3.4 Photochemistry: a gradient of color between yellow and pink-red... 61
2.4 Experimental Part... 68
2.5 Conclusions ... 68
2.6 References ... 69
3. 2-Styryl-1-benzopyrylium compounds: extending the color palette ...71
3.1 Introduction ... 71
3.2 Synthesis and characterization ... 72
3.3 Networks of 2-styryl-1-benzopyrylium in water... 73
3.3.1 2-Styryl-1-benzopyrylium salts without OH in position 7... 73
3.3.2 7-Hydroxy-2-styryl-1-benzopyrylium tetrafluoroborate (HS) ... 74
3.3.3 7-Hydroxy-2-(4-hydroxystyryl)-1-benzopyrylium chloride (DHS)... 78
3.3.4 7-Hydroxy-2-(4-dimethylaminostyryl)-1-benzopyrylium chloride (DAS)... 80
3.3.5 Comments on the water networks ... 81
3.4 Efficient photochromism in the presence of CTAB micelles... 82
3.5 Photochemistry of 7-Hydroxy-2-(4-hydroxystyryl)-1-benzopyrylium and related compounds... 83
3.5.1 Chalcones lacking a hydroxyl group in position 2 ... 83
3.5.2 7,4’-Dihydroxyflavylium (DHF)... 90
3.5.3 7-Hydroxy-2-(4-hydroxystyryl)-1-benzopyrylium (DHS)... 92
3.5.4 Effects of the addition of CTAB micelles ... 94
3.6 Experimental Part... 95
3.6.1 Synthesis of styrylmethylketones... 96
3.6.2 Synthesis of 2-styryl-1-benzopyrylium salts... 96
3.6.3 Synthesis of model compounds... 99
3.6.4 Measurements ... 99
3.6.5 Data Analysis ... 100
3.7 Conclusions ... 100
3.8 References ... 101
4. Photochromism of the flavylium network in Pluronic F127 micelles and gels...102
4.1 Introduction ... 102
4.2 General properties of DAF and its photochromism in Pluronic micelles and gels ... 104
4.3 Ct and A from DAF in pure solvents ... 109
4.4 Photophysics of Ct from DAF in Pluronic medium ... 115
4.5 Photochromic mechanism in Pluronic media... 118
4.6 Experimental Part... 126
4.6.1 Synthesis ... 126
Chemical Reaction Network of Flavylium Ions in Heterogeneous Media
4.7 Conclusions ... 128
4.8 References ... 129
5. Host-guest interactions between molecular clips and multistate systems based on flavylium salts ...130
5.1 Introduction ... 130
5.2 Host-guest formation with molecular clip C1 ... 131
5.2.1 UV-Vis and fluorescence and studies in methanol ... 132
5.2.2 NMR studies in methanol... 137
5.2.3 Studies in water ... 142
5.3 Host-guest formation with molecular clip C2 in aqueous solutions ... 144
5.4 Experimental Part... 152
5.4.1 Synthesis ... 152
5.4.2 Measurements ... 152
5.5 Conclusions ... 153
5.6 References ... 154
6. Supramolecular host-guest flavylium-loaded zeolite L hybrid materials: network of reactions of encapsulated 7,4’-dihydroxyflavylium ...156
6.1 Introduction ... 156
6.2 Incorporation of the flavylium dyes in zeolite L... 158
6.3 Evidences for the incorporation ... 159
6.4 Network of reactions inside the zeolite ... 161
6.5 Experimental Part... 162
6.6 Conclusions ... 163
6.7 References ... 163
7. Conclusions...165
8. Publications ...167
9. Supplementary Material ...168
9.1 Water network of flavylium ions with low barrier... 168
9.1.1 Kinetics of thermal reaction – deduction of equations 1.45 and 2.14 ... 168
9.1.2 Flash photolysis kinetics – equation 1.46... 170
9.1.3 Quantum yields – equation 1.48... 170
9.2 DHF in CTAB micelles - deduction of equations 2.2, 2.4, 2.5 and 2.6 ... 171
9.2.1 Thermodynamic equilibrium... 171
9.2.4 Quantum yields – equation 2.12... 175
9.3 DEF in CTAB micelles - deduction of equations 2.27-2.32 ... 176
9.3.1 Thermal kinetics... 176
9.3.2 Flash photolysis kinetics ... 179
9.3.3 Quantum yields – equation 2.36... 181
9.4 Water network of 4’-N,N-dimethylamino-7-hydroxyflavylium (DAF)... 186
9.5 Deduction of equations 3.4-3.6. ... 190
Scheme Index
Scheme 1.1 – Potential energy surfaces for bound states, S0 and S1, and a dissociative state, S2.4
Scheme 1.2 – Perrin–Jablonski diagram and illustration of the relative positions of absorption, fluorescence and phosphorescence spectra.. ... 5 Scheme 1.3 – Unimolecular (a) and bimolecular (b) processes for the deactivation of the excited state. kr, knr and kp are unimolecular radiative constants for radiative decay, radiationless
deactivation and chemical reaction, and kq is a bimolecular (quenching) rate constant... 7
Scheme 1.4 – A schematic representation of the isomerization coordinate is shown for reaction from both the trans and cis sides. The rate constants kiso and k’iso are for isomerization on the
singlet surface and the rate constants kr and k’r are radiative constants ... 8
Scheme 1.18 – Example of a flow diagram over memory cycles, defining a sequence of algorithms to be operated in both 4’-acetamidoflavylium and 4’-aminoflavylium chemical
networks. ... 38
Scheme 1.19 – An electric pulse operating on the Ct of 6-hydroxyflavylium. ... 39
Scheme 1.20 –a) 1-n-Butyl-3-methylimidazolium hexafluorophosphate,[bmim][PF6] (lower phase), DHF in 0.01M HCl, AH+ species (upper phase); b) after moderate shaking, A species (lower phase); c) after vigorous shaking, AH+ species (lower phase); d) after making the aqueous phase alkaline (pH 12) with minimum shaking, A- (lower phase), Ct2- (upper phase); e) after moderate shaking; f) after vigorous shaking, Ct2- species (upper phase); g) after reacidification of the aqueous phase and vigorous shaking, Ct species (lower phase); h) after irradiation of the ionic-liquid phase at 366 nm, AH+ species… ... 39
Scheme 1.21 –A cycle to write-red-erase in solid state: DHF in PHEMA. The first step (write) consists in the irradiation of the film containing Ct form in acidic media (metastable). The read step can de achieved using a wavelength at which Ct species does not absorb, for example 470 nm. To erase the system, a sequence of two pH jumps are necessary: the first one to basic medium produces Ct2- species; the second one, back to acidic medium, restores the original Ct species… ... 40
Scheme 2.1 – Photochromism in flavylium networks: A) and B) High thermal barrier compound at acidic and neutral pH values, respectively; C) and D) Low thermal barrier compound at acidic and neutral pH values, respectively. ... 46
Scheme 2.2 – General scheme in the presence of CTAB micelles. ... 48
Scheme 2.3 – Reaction network for DEF... 55
Scheme 2.4 – Species involved in the kinetics of the flavylium thermal formation... 61
Scheme 2.5 – Species involved in the kinetics of the flavylium photochemical formation. ... 64
Scheme 3.1 – Structure of 2-styryl-1-benzopyrilium compared with flavylium. ... 71
Scheme 3.2 – Network of reactions of 2-styryl-1-benzopyrylium salts in water... 73
Scheme 3.3 – Structure of model chalcones. ... 84
Scheme 3.4 – Tautomerization of Ct-. ... 85
Scheme 3.5 – Excited state deactivations. ... 87
Scheme 3.6 – Tautomer from trans-chalcone of DHS. ... 92
Scheme 4.1 –Network of ground-state reactions of DAF in aqueous solutions. ... 102
Chemical Reaction Network of Flavylium Ions in Heterogeneous Media
Table Index
Table 1.1 – Flavylium ions used in multistate/multifunctional systems... 27 Table 1.2 – Truth Table for the AND logic behavior of the 4'-hydroxyflavylium compound starting from Ct at pH = 5.5…... 34 Table 1.3 – Truth Table for the XOR (eXclusive OR) logic behavior of the 4'-methoxyflavylium [Co(CN)6]3- system starting from pH = 3.6… ... 35
Table 2.1 – Frequent photochromic compounds. ... 44
Table 3.1 – Thermodynamic constants obtained in aqueous solutions at 298 K for HF, DHF, DAF, HS and DHS (constants for DAS were obtained in 29 % acetonitrile). ... 77 Table 3.2 – Kinetic constants obtained in aqueous solutions at 298 K for HF, DHF, DAF, HS and DHS (constants for DAS were obtained in 29 % acetonitrile) ... 78 Table 3.3 – pK’a and kh (s-1) obtained in aqueous solutions at 298 K for HF, DHF , DAF, HS
and DHS (constants for DAS were obtained in 29 % acetonitrile) ... 82
Table 4.1 – Parameters from the fittings of experimental points in Fig. 4.8 with eq. 2.9. ... 109 Table 4.2 – Correlation of Ct absorption and emission maxima (exciting at 390 nm) with Kamlet-Taft parameters... 112 Table 4.3 – Fluorescence quantum yields in different media. ... 113 Table 4.4 – Analysis of fluorescence decays 20 % Pluronic F127, pH = 5.9, λexc = 390 nm in the
indicated conditions. 25 ºC = micelles, 40 ºC = gels... 123
Figure Index
Figure 1.1 – Global rate constant as a function of pH, for the cases where there is no thermal barrier from cis-trans isomerisation. ... 21 Figure 1.2 – Transient absorption traces obtained by flash photolysis of the compound 2’-methoxyflavylium at 440 nm (AH+) at indicated pH values…... 22 Figure 1.3 – Spectral variations observed upon continuous irradiation (313 nm) of dark equilibrated aqueous solutions of the Ct of unsubstituted flavylium as a function of time (initial time increments = 30 s); a) pH = 2.0; b) pH =5.2… ... 23 Figure1.4 – Generic synthesis of flavylium salts based on the condensation of β-diketones and resorcinols. Rx, otherwise indicated can represent OHor alkyl chains. In the case where R4 is a
phenyl ring, R4’ must be H, otherwise a mixture of products will be obtained. ... 25
Figure 1.5 – Generic synthesis of flavylium salts based on the condensation of 2-hydroxybenzaldehydes and acetophenones. Rx can represent OH, OCH3, tertiary amines, alkyl
groups (saturated or not), halogens, COOH or NO2... 26
Figure 1.6 – Generic synthesis of flavylium salts based on the condensation of phenols and aryl ethynyl ketones. R5,R6= H,OH; R7=H,CH3; R3’,R4’,R5´= H, OH or OCH3... 26
Figure 1.7 – Mole fraction of the species present at the equilibrium and in the photostationary state. Arrows mark the lock pH. Example of a compound without hydroxyl groups ... 30 Figure 1.8 –Mole fraction distribution of 4’-acetamidoflavylium: a) solid line -thermodynamic equilibrium, dashed line - pseudo-equilibrium AH+/B/Cc/Cc-; b) traced line - pseudo-equilibrium AH+/B/Cc/Cc-, dotted line - pseudo-equilibrium Ct/Ct-... 37
Figure 2.5 – A) Flash photolysis rate constants as a function of pH and fitting achieved with eq. 2.9, inset – representative traces of the flash photolysis experiments obtained at pH = 1.47. B) Time resolved spectra at 0.1, 1, 5 and 15 s at pH = 1.54. ... 52 Figure 2.6 –Quantum yields versus pH: ● - experimental data, line - fitting achieved with eq. 2.12... 53 Figure 2.7 – Cycling in a solution of the flavylium cation [DHF] = 1.46×10⁻⁵ M at pH = 1.47 and [CTAB] = 1.8×10⁻² M. The initial point of a cycle corresponds to absorbance in the beginning of the irradiation and the end point is the absorbance when irradiation is completed. The system takes approximately 2 h to fully recover... 53 Figure 2.8 –Thermodynamic A) and kinetics B) of DEF, [DEF] = 6.7×10⁻⁶ M. A) pH dependent absorption spectra at room temperature after 1 day in the dark. B) ● – reaction rate of AH+/A formation from chalcones as a function of pH upon pH jumps; fitting was achieved by means of eq. 2.14 ○ – experimental rates in the presence of CTAB micelles... 55 Figure 2.9 – Spectral variations of trans-chalcone aqueous solutions at pH 12, Ct2-, A), at pH=5.2, Ct, B), at pH = 2.9,CtH+, C) and flavylium cation, AH+, at pH = 1.3, D) of DEF (full line). Pointed lines were obtained immediately upon addition of CTAB (pointed lines). [DEF] = 3.8×10⁻⁵ M and [CTAB] = 5×10⁻³ M... 57 Figure 2.10 – Spectral variations of DEF obtained immediately after the following procedure: 1 ml of Ct2- 1×10⁻⁴ M at pH 12 was added to 2 ml of a solution containing acid and buffer to give the desired final pH value and CTAB; [CTAB]final = 5×10⁻³ M; inset – absorption at 450 nm (●)
and at 350 nm (○) versus pH, fitting was achieved with pKobs=1.1. ... 58
Figure 2.11 – A) pH dependent spectral changes of DEF in the presence of CTAB micelles at equilibrium, [DEF] = 5×10⁻⁵ M and [CTAB] = 5×10⁻³ M, inset absorption changes at 530 nm in function of pH and fitting with pKobs = 1.9. B) Effect of the addition of CTAB micelles to a
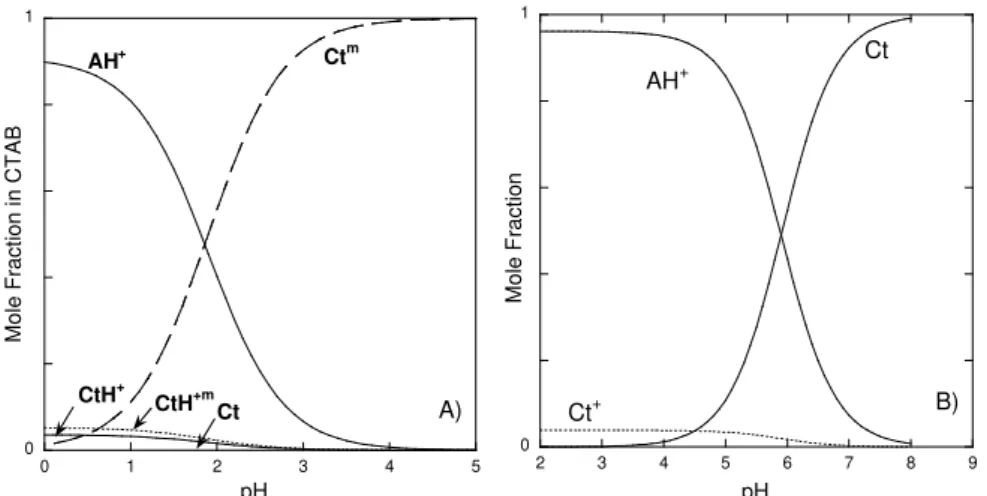
solution of DEF (1 M HCl), [DEF] = 3×10⁻⁵ M and [CTAB] 5×10⁻³ M, inset: absorbance changes at 550 nm as a function of time. ... 59 Figure 2.12 –A) Mole fraction distribution of DEF in the presence of CTAB micelles at equilibrium. B) In the absence of CTAB for comparison purposes. ... 60 Figure 2.13 – Rate constant for the thermal conversion of AH+ into Ctmversus pH at 22 °C. The solid line shows the fit with eq 2.27... 61 Figure 2.14 –A) Kinetics of the thermal transformation of AH+ into Ct, in the presence of CTAB, at pH = 4.25. B) Irradiation of the previous solution at 436 nm Φ = 0.001 (I0 = 2.3×10⁻⁷
Chemical Reaction Network of Flavylium Ions in Heterogeneous Media
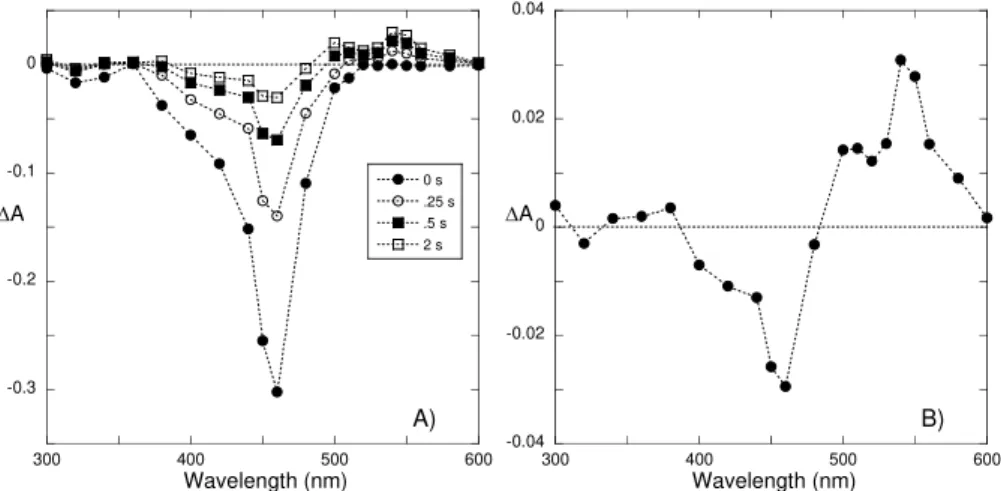
Figure 2.16 – A) Time-resolved absorption spectra at pH = 2.31. B) Detail of the spectrum of the final (30 s) flash photolysis process. ... 63 Figure 2.17 –Traces of the DEF flash photolysis, [DEF] = 5×10⁻⁵ M and [CTAB] = 5×10⁻³ M64 Figure 2.18 – A) Flash photolysis experimental rate constants fitted with eqs. 2.31 and 2.32. B) pre-exponential factors obtained from the analysis of the kinetic traces with biexponential functions, the lines are only guidelines. ... 66 Figure 2.19 – A) Plot for the determination of the kinetic rate constants using eq. 2.33. B) Plot for the determination of the kinetic rate constants using 2.35... 66 Figure 2.20 – p dependence of the flavylium quantum yield formation upon irradiation at 436 nm fitted with eq 2.36. ... 67 Figure 2.21 –Summary of the results obtained for DEF network in water and CTAB micelles 67
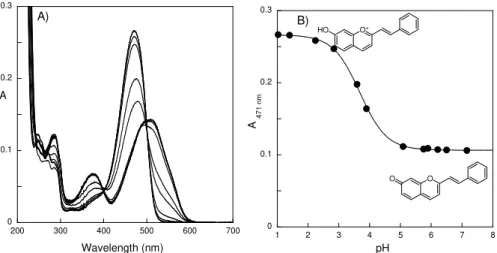
Figure 3.1 – Generic synthesis of 2-styryl-1-benzopyrylium salts based on the condensation of ... 72 Figure 3.2 – A) Spectra run immediately after a pH jump from a 2.5 × 10⁻⁵ M solution at pH = 1 to 1.03, 1.4, 2.24, 2.84, 3.59, 3.9, 5.09, 5.75, 5.89, 6.21, 6.5 and 7.16. B) Changes in absorption at 471 nm, fitted with a pKa = 3.7 ± 0.1... 75
Figure 3.3 – A) Thermal equilibrated solutions in the dark upon a pH jump from 1 to 1.03, 1.4, 2.24 2.84, 3.59, 3.9, 5.09, 5.75 and 5.89. B) Changes in absorption at 471 (●) and 382 nm (■) simultaneously fitted with a pK’a = 3.1 ± 0.1... 75
Figure 3.4 – A) Spectral evolution after a pH jump from pH = 1 to 4.53 followed every 2 min. The pH jump was performed as previously mentioned. B) Fitting of the decay of absorption at 486 nm was achieved with kobs = 1.8 × 10⁻³ s-1. ... 76
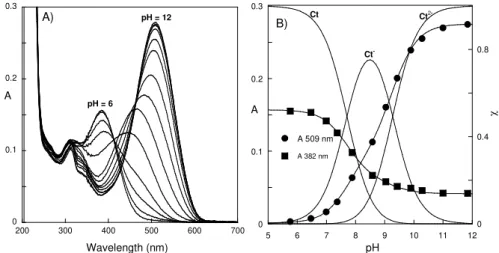
Figure 3.5 – Observed rate constants versus pH for HS (this work ♦) and (▲) for HF.Fitting of experimental data with eq. 1.45 was achieved with constants reported in Table 3.2... 76 Figure 3.6 –A) Spectrophotometric titration of the trans-chalcones of HS; pH values 12.4, 12.19, 11.84, 11.00, 10.28, 9.89, 9.43, 9.04, 8.58, 7.88, 7.37, 6.99, 6.47 and 5.76. B) Changes in absorption at 509 and 382 nm, simultaneously fitted with pKCt1 = 7.7 ± 0.1 and pKCt2 = 9.3 ± 0.1
... 77 Figure 3.7 – A) Immediate titration upon a pH jump from a stock solution of DHS 1.6 × 10⁻⁵ M at pH =1.0 to basic pH values, inset, fitting of the absorptions at 509(●) and 601 nm (♦) with pKa = 4.1 ± 0.1 and pKa2 = 8.1 ± 0.1.(B) The same as A but upon equilibrium, inset, fitting of
the absorptions at 509 (♦) and 390 nm (●) with pK’a = 3.4 ± 0.1. C) Protonation steps of the trans-chalcones, inset, fitting of the absorptions at 396 (●) and 522 nm (♦) with pKCt1 = 7.9 ±
0.1 and pKCt2 = 9.4 ± 0.1. ... 79
Figure 3.9 – Spectrophotometric titration upon pH jumps from a stock solution of DAS at pH = 1.0 to acidic pH values or basic pH values; final [DAS] = 1.7 × 10⁻⁵ M 1. A) From pH 0 to pH 3. B) From pH 3 to pH 7, inset, fitting of the absorption at 639 nm with pKa+ = 0.7 ± 0.1 and
pKa = 5.1 ± 0.1. C) The same as B but upon equilibrium, inset, fitting of the absorptions at 442
(●) and 639 nm (♦) with pKa+ = 0.7 ± 0.1 and pKa+ = 4.0 ± 0.1 C) Spectrophotometric titration of
Ct2-, inset, fitting of the absorptions at 422 (●) and 533 nm (♦) with pKCt1 = 8.6 ± 0.1 and pKCt2
= 10.4 ± 0.1. ... 80 Figure 3.10 – Observed rate constants versus pH for DAS (this work ♦) and for DAF (traced line). Fitting of experimental data with eq. 2.14 was achieved with constants reported in Table 3.2... 81 Figure 3.11 –A) Spectral changes occurring upon irradiation of DHS (4.95 × 10⁻⁵ M) in the presence of CTAB micelles (0.2 M) at pH = 1.44 for the following irradiation times: 0, 0.25, 0.5, 0.75, 1, 1.5, 2, 3, 4, 5, 7, 9, 11, 15, 20, 30, and 40 min (I0 = 2.8 × 10⁻⁷ einstein.min-1 at λirr
=436 nm). B) Color of the solutions at 0, 1, 3, 7, 11, 20, 30 and 40 min of irradiation... 82 Figure 3.12 –A) Irradiation of an equilibrated solution of DAS (Ct) at pH 1.9 in 0.2 M CTAB (I0 = 2.8 × 10⁻⁷ einstein.min-1 at λirr =436 nm, Φ = 0.02), t = 0, 1, 3, 6, 10, 15, 20, 30, 40 and 50
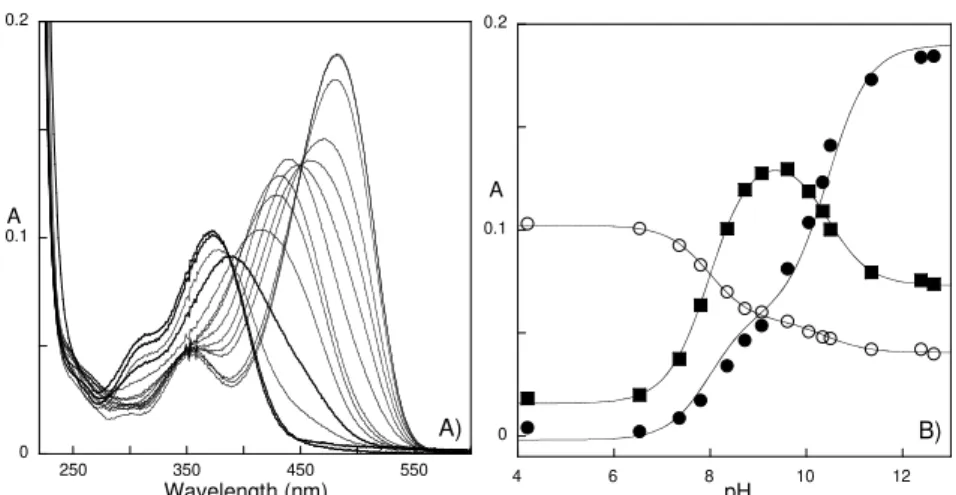
min. B) Observed color at irradiation times t = 0, 15, 30 and 50 min... 83 Figure 3.13 – A) Absorption of compound 31 as a function of pH. B) Mole fractions of Ct, Ct -and Ct2- as a function of pH and fitting of absorptions with pKa’s 7.9 and 9.0. C) Irradiation of
the Ct species (pH=6.1). ... 84 Figure 3.14 – Emission from compound 31 as a function of pH, A) exciting at 370 nm, B) exciting at 420 nm. C) Fitting of the emission at 550 nm as a function of pH, with pKa’s 7.9 and
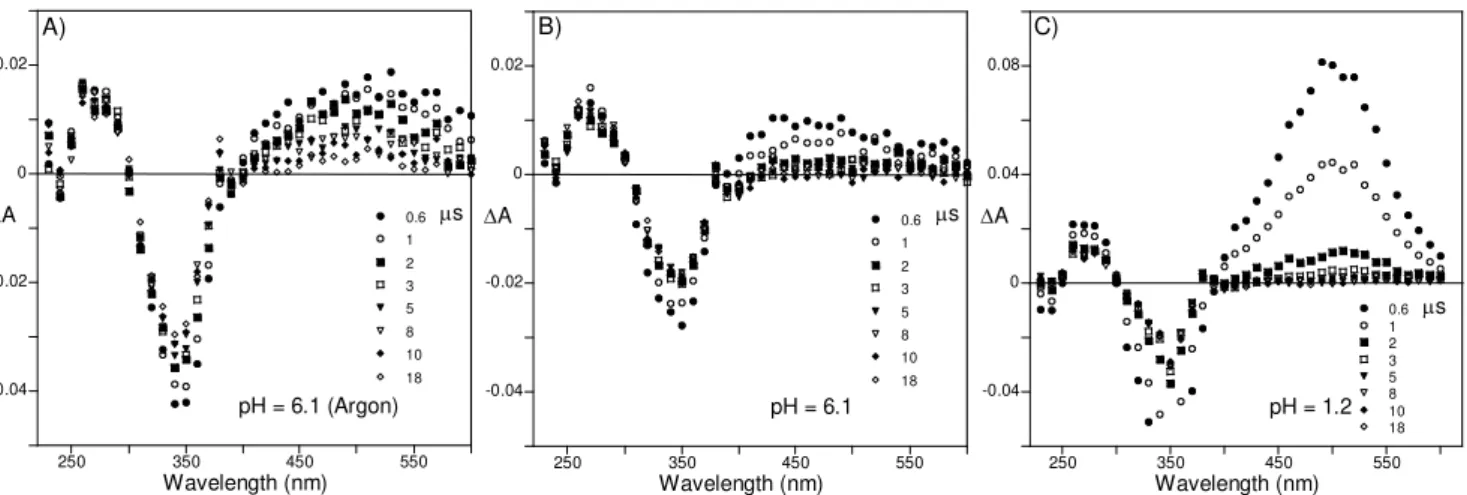
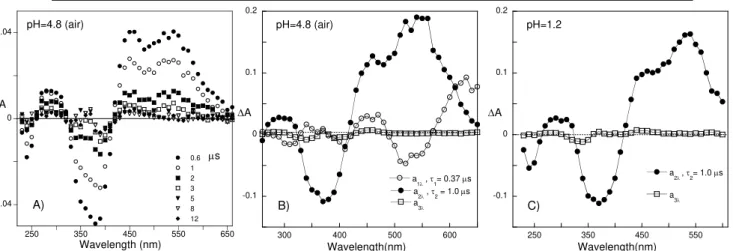
9.0... 84 Figure 3.15 – Transient absorption spectra of compound 31 in a mixture of water (90%) and ethanol (10%). Time indicates the delay after the laser pulse. A) pH = 6.1, solution saturated with argon. B) pH = 6.1, air-equilibrated solution. C) pH = 1.2, air-equilibrated solution... 86 Figure 3.16 –Pre-exponential factors calculated from global analysis of the decays obtained for compound 31 in a mixture of water (90%) and ethanol (10%) at pH = 6.1 A) and 1.2 B) in air-equilibrated solutions (●, a1λ; ○, a2λ; □, a3λ - corresponding lifetimes according to labels in
graphics)... 86 Figure 3.17 – Absorption spectra A), fluorescence emission at λex c= 370 nm B) and
λexc = 410 nm C) of compound 32 as a function of pH. Global fitting was achieved for pKa 8.3
and 8.8. ... 88 Figure 3.18 – Fitting of the fluorescence emission at λem = 625 nm A) and λem = 590 nm B) of compound 32 as a function of pH. Global fitting was achieved for pKa 8.3 and 8.8. ... 89
Chemical Reaction Network of Flavylium Ions in Heterogeneous Media
with argon. B) pH = 6.1, air-equilibrated solution. C) pH = 1.2, air-equilibrated solution (●, a1λ; ○, a2λ; □, a3λ-corresponding lifetimes according to labels in graphics). ... 90
Figure 3.20 – Fitting of laser flash photolysis traces with single and double exponential kinetics with global analysis (sample data: compound 32, pH = 4.8) at selected wavelengths A). B) Least squares sum as a function of time. ... 90 Figure 3.21 – A) Absorption spectra of the chalcones of DHF. B) Fitting of the absorptions at (●) 481 nm, (○)370 nm and (■) 427 nm pKa=8.0 and 10.4... 91
Figure 3.22 – A) Emission spectra of the chalcones of DHF at λexc = 390 nm: inset fitting of the emission at 505 nm (corrected for the absorbed light) for pKa=7.85 and 10.4. B) Emission
spectra of the chalcones of DHF at λexc=450 nm: inset fitting of the emission at 545 nm (corrected for the absorbed light) for pKa = 8.0 and 10.4. ... 91
Figure 3.23 –Transient absorption of the chalcone of DHF at pH = 5.2 in a mixture of water (90%) and ethanol (10%) in an air-equilibrated solution A). Pre-exponential factors obtained from global analysis of the decays B) (●, a1λ; ○, a2λ; □, a3λ-corresponding lifetimes according to
labels in graphics). ... 91 Figure 3.24 – A) Absorption spectral variations upon pH jumps of a solution at pH = 12 (Ct 2-DHS) to less basic pH values, inset: fittings at (●) 525, (O) 400 and (■) 445 nm, with pKa’s of
8.0 and 10.0 in water (90%) and ethanol (10 %). B) Fluorescence emission titration of the trans -chalcones of DHS in water (90%) and ethanol (10 %) λexc = 420 nm; inset: fitting of the emission at λem =550 nm was achieved with pKa’s of 8.0 and 10.0. B) the same upon λexc = 485
nm, inset: fitting of the emission at λem = 620 nm was achieved for pKa’s of 8.4 and 10.0. ... 92 Figure 3.25 –Transient absorption spectra of DHS in water (90%) and ethanol (10%) at pH = 7 obtained by nanosecond flash photolysis in air equilibrated solution A) and upon bubbling argon for 20 min B). C) pre-exponential factors obtained from global analysis of the decays in A). D) global analysis of the decays in B) (●, a1λ; ○, a2λ; □, a3λ-corresponding lifetimes according to
labels in graphics). ... 93 Figure 3.26 – Transient absorption of DHS equilibrated solution at pH = 4.9 followed at 396 A) and 510 nm (B) in the seconds time scale. The fitting was achieved with τ = 2.1 s-1. ... 94 Figure 3.27 –Transient absorptions of DHS in the presence of CTAB 0.2 M at pH = 1.4, in the seconds timescale. ... 95 Figure 3.28 – A) Transient absorption spectra obtained by nanosecond flash photolysis in 0.2 M CTAB at pH = 1.44. B) Pre-exponential factors obtained from global analysis of the decays; τ = 0.9 μs ... 95
Figure 4.1 – A) pK’a of DAF in aqueous solutions. B) Spectra of the main species present in
(DEF) in 30 % Pluronic gel at pH = 4.9, upon sunlight exposure at room temperature (last picture 3.5 minutes)…... 103 Figure 4.3 – Solar irradiation of a gel (25 % Pluronic F127 at 30 ºC) containing DAF at pH = 4.0: 0, 15, 30 and 60 s upon exposure to sunlight. See below for details. ... 104 Figure 4.4 – Energy of the S0->S1 electronic transition of Ct and AH+ of DAF: A) in mixtures
water/1,4-dioxane; B) in the presence of Pluronic F127 (1.5%) as a function of the temperature, pH=6.0 () and pH=2.0 ( ); C) Ct and D) AH+, as a function of the pluronic concentration at 9.20C (z) and 39.20C ({)... 106 Figure 4.5 – Absorption at 412 nm (Ct in water) versus temperature in 5 % Pluronic F127 solution. Illustration of how can Ct absorption maximum be used to determine CMT, in this case 23.8 ºC. ... 106 Figure 4.6 – A) pK’a vs. temperature for water ( ), 1.5 % ({) and 30% (z) of Pluronic. B)
Spectral variations of DAF in the presence of Pluronic F127 30% at pH = 2.6, as a function of temperature... 107 Figure 4.7 – A) Spectral variations of DAF incorporated in a 30 % Pluronic F127 gel. B) Spectral variations of DAF dissolved in micelles of Pluronic F127 (1.5%). ... 108 Figure 4.8 – A) Transient absorption traces of the Ct (400 nm) and AH+ species (540 nm), pH = 5.3 T = 45 0C for a gel 30 % Pluronic F127, both curves decay with the same rate constant. B) Plot of the rate constants obtained at 45 ºC, for 30 % Pluronic F127 (gel ●) and 1.5 % Pluronic F127 (micelles ○). ... 108 Figure 4.9 – A) Normalized absorption spectra of Ct and A species of DAF in tetrahydrofuran, acetonitrile, methanol and glycerol. B) Normalized emission spectra in the same set of solvents, exciting at 390 nm. C) Maximum wavenumber (cm-1) in various solvents as a function of ET(30)
of the solvent, open points refer to emission peaks (○ aprotic solvents, □ protic solvents) and filled ones to absorption peaks (● aprotic solvents, ■ protic solvents) ... 111 Figure 4.10 – A) ln[1/n2(1/φf-1)] as a function of ET(30) of the solvent, □ protic solvents and ■
glycerol. B) Variation of absorbance at 390 nm immediately after the flash, corrected for the absorption of light, as a function of the fluorescence quantum yield in percentage, for protic solvents... 113 Figure 4.11 – Flash photolysis traces obtained in water, methanol, ethanol and decanol, following the variation in absorption at 390 nm. First order rate constants are shown... 114 Figure 4.12 – ln[1/n2(1/φf-1)] for A species in protic solvents as a function of ET(30)... 115
Chemical Reaction Network of Flavylium Ions in Heterogeneous Media
wavenumber of the emission band (it was obtained through the fitting of a Lorentzian to the points near the maximum of the band) versus the excitation wavenumber. ... 116 Figure 4.15 – A) Emission spectra of Ct from DAF in methanol at different excitation wavelengths. B) Emission spectra of A from DAF in Pluronic gel, F127 20 %, at 40 ºC, pH = 5.9 at different excitation wavelengths. ... 117 Figure 4.16 – A) Fluorescence decays 20 % Pluronic F127, pH = 5.9, λexc = 390 nm, after
irradiation, T = 40 ºC, λem = 450 nm (1.3 ps/channel), λem = 470 nm (10 ps/channel), λem = 535
nm (8.4 ps/channel). IRC – Instrument Response Curve. B) Expansion of A) for shorter times. On A) the normalized counts are on logarithmic scale, while in B) the scale is linear (in order to visualize the shorter components of the fluorescence decay). ... 118 Figure 4.17 – A) 20 % Pluronic F127, pH =5.9, T = 40 ºC, slits excitation-emission 10-2 nm,
λexc = 390 nm a) emission intensity at the magic angle λem = 620 nm (A); b) emission intensity at
the magic angle λem = 470 nm (Ct); c) anisotropy λem = 470 nm (Ct); d) anisotropy λem=620 nm
(A). B) Fluorescence anisotropy of the photostationary state: 20 % Pluronic F127, pH = 5.9, T = 40 ºC, λexc = 390 nm on a previously irradiated cell as a function of the emission
wavelength. Normalized emission spectra of the species Ct (obtained upon decomposition) and A... 119 Figure 4.18 – Variation of the fluorescence emission intensity of the species Ct of DAF, λexc=
390 nm; λem =470 nm, upon correction for the absorbed light vs. irradiation time (λrr= 390 nm).
... 120 Figure 4.19 –A) Fluorescence decays 20 % Pluronic F127, pH =5.9, λexc = 390 nm, λem = 470
nm, T = 25 ºC, before irradiation (1.3 ps/channel) and after irradiation (7.5 ps/channel). IRC – Instrument Response Curve. B) Fluorescence anisotropy decays 20 % Pluronic F127, pH = 5.9,
λexc = 390 nm, λem = 470 nm, T = 25 ºC, before irradiation (1.3 ps/channel) and after irradiation
(6 ps/channel). ... 121 Figure 4.20 – Analysis of a fluorescence decay and a fluorescence anisotropy decay. A) Fluorescence decay 20 % Pluronic F127, pH = 5.9, λexc = 390 nm, λem = 470 nm, T = 40 ºC in
PSS (10 ps/channel) and respective fitting. B) Weighted residuals for the fit in A). C) Fluorescence anisotropy decay 20 % Pluronic F127, pH = 5.9, λex c= 390 nm, λem = 470 nm, T =
40 ºC in PSS (10 ps/channel) and respective fitting. D) Weighted residuals for the fit in C) (for details see Table 4.4)... 121 Figure 4.21 –A) Fluorescence decays 20 % Pluronic F127, pH = 5.9, λexc = 390 nm, λem = 620
nm, after irradiation, T = 25 ºC (10 ps/channel) and T = 40 ºC (8.4 ps/channel). IRC – Instrument Response Curve. B) Fluorescence anisotropy decays 20 % Pluronic F127, pH = 5.9,
λexc= 390 nm, λem = 620 nm, T = 25 ºC, after irradiation, T = 25 ºC (10 ps/channel) and T = 40
Figure 4.22 – Analysis of a fluorescence decay and a fluorescence anisotropy decay. A) Fluorescence decay 20 % Pluronic F127, pH = 5.9, λexc = 390 nm, λem = 620 nm, T = 40 ºC in
PSS (10 ps/channel) and respective fitting. B) Weighted residuals for the fit in A). C) Fluorescence anisotropy decay 20 % Pluronic F127, pH = 5.9, λex c= 390 nm, λem = 620 nm, T =
40 ºC in PSS (10 ps/channel) and respective fitting. D) Weighted residuals for the fit in C) (for details see Table 4.4)... 124 Figure 4.23 –Traces of the absorptions at 390 nm and 540 nm respectively from Ct and AH+ of DAF in Pluronic F127 upon a pH jump from pH = 6 to 0.9 M HCl... 125
Figure 5.1 – Spectral modifications observed upon addition of molecular clip, [C1] = 0 – 7 × 10--4 M, to methanolic solutions of DAHF, [51] = 1.92 × 10⁻⁵ M, followed by absorption (A) and fluorescence emission (B, 2 nm slits, λexc = 545 nm); and to methanolic solutions of DEF,
[52] = 2.26 × 10⁻⁵ M, followed by absorption (C) and fluorescence emission (Δ, 2 nm slits,
λexc = 550 nm)... 133
Figure 5.2 – Fitting of the data in Fig. 5.1 using eq. 5.1 for the emission data and a similar equation for absorption data. A) 51@C1, log K = 4.2 ± 0.1; B) 52@C1, log K = 4.7 ± 0.1. ... 135 Figure 5.3 – Fluorescence decays of flavylium DEF, 52 (A) and 52@C1 (84 % complexation, B) in methanol. Excitation at 390 nm, emission at 650 nm, scale 3.44 ps/channel for 52, 8.4 ps/channel for 52@C1. C) Table with fitting parameters for flavylium salt 52 in the absence (lifetime 0.6 ns) and in presence of clip C1 (lifetime 1.8 ns)... 135 Figure 5.4 – Spectral modifications observed upon adition of diphosphate clip C1, 0 – 3.3 × 10⁻³ M, to methanolic solutions of the flavylium salt DHMF, 53, 3.45 × 10⁻⁵ M, followed by absorption (A) and fluorescence emission (B, λexc = 380 nm); Fitting of the data in B) using
eq. 5.1, log K= 1.4 ± 0.5. ... 136 Figure 5.5 – Spectral modifications observed upon addition of clip C1, [C1] = 0 – 8.3 × 10⁻⁵ M, to a methanolic solution of DHMF, [53A] = 3.46 × 10⁻⁵ M, followed by absorption (A) and fluorescence emission (B, λex c= 520 nm); C) Fitting of the data in B) using eq. 5.1 leads to log K = 5.6 ± 0.2... 137 Figure 5.6 – 1H-NMR spectra (500 MHz, CD3OD, 25°C) of clip C1 (5.07 mM, top), a mixture
of C1 (1.53 mM) and flavylium salt 52 (1.50 mM, middle), and flavylium salt 52 (1.50 mM, bottom) (aromatic range); * impurities. ... 138 Figure 5.7 –Dependence of Δδobs (flavylium salt) from the concentration of clip C1 (≡ [R]0): A) Δδobs (4-H) of 51, B) Δδobs (4-H) of 52, C) Δδobs (4-H) of 53A, and D) Δδobs (4-H) of 53AH+.139
Figure 5.8 – Complexation-induced maximum 1H-NMR shifts, Δδmax (= δcomplex -δ0) in ppm,
determined by 1H-NMR titrations for the flavylium protons of 51, 52 and 53AH+ and the quinoidal base 53A in the host-guest complexes with clip C1.... 139 Figure 5.9 – Comparison of the Δδmax values (determined by 1H-NMR titration) with
Chemical Reaction Network of Flavylium Ions in Heterogeneous Media
by a Monte-Carlo conformer search (force field: AMBER*/H2O, 5000 structures implemented
in Macromodel 9.0). ... 140 Figure 5.10 –The electrostatic potential surface (EPS) calculated for clip C1 substituted by dihydrogenphosphate groups (OPO(OH)2 instead of OPO2(OH)- Li+, left) and quinoidal base
53A, right) by the use of density functional B3LYP/6-31G**//AM1 (implemented in SPARTAN) The color code ranges from -25 kcal/mol (red) to +25 kcal/mol (blue). The molecular electrostatic potential (MEP) was calculated at the marked position to be -19 kcal/mol at the clip naphthalene sidewalls and +18 kcal/mol at hydrogen atom 5-H of 53A... 141 Figure 5.11 – The dependence of the UV-Vis spectra of compound DHMF, 53 ([53] = 1.3 × 10
-5 M) from the concentration of clip C1 ([C1] = 0 – 6 × 10⁻⁵ M) in aqueous solution: A) and B) at
pH = 2; C) and D) at pH = 5.3. The association constants were determined from theses concentration dependencies by UV-Vis titration to give the same value of log K = 4.9 ± 0.1 for the formation of both complexes 53AH+@C1 and 53A@C1. At both pH values, clip C1 exists in its negatively charged hydrogenphophate form whereas 53 exist as 53AH+ at pH = 2 and as 53A at pH = 5.3... 143 Figure 5.12 – pH titration of the host-guest complex 53@C1 ([C1] = 5.9 × 10⁻⁵ M, [53] = 1.3 × 10⁻⁵ M) in aqueous solution. A) Change in the UV-Vis spectra of 53@C1 observed in the range from pH = 3.2 to pH = 5.9. B) pH = 5.9 to pH = 9.0. C) The pH dependence of the absorption intensity at 515 nm. The continuous curve presents the fit of these data points leading to the pKa values of 4.8 and 7.0. ... 144
Figure 5.13 – Spectral modifications observed upon addition of clip C2, [C2] = 0 – 7.2 × 10⁻⁵ M, to an aqueous solution of 54 at pH = 2, [54] = 6.9 × 10⁻⁶ M, in the presence of buffer, followed by absorption (A) and fluorescence emission (B, λexc = 420 nm). C) The
dependence of the absorption data on A at 455 nm and emission data on B) at 558 nm from the clip concentration were fitted by the use of eq. 5.1 to give log K = 4.3 ± 0.1 for 54AH+@C2.146 Figure 5.14 – Variation of the absorbance at 370 nm (λmax of Ct) of equilibrated aqueous
solutions of flavylium salt 54 (7.2×10⁻⁶ M) and clip C2 (8.7×10⁻⁵ M) as a function of pH. Fitting was obtained with pK’a= 4.0 ± 0.2; T = 21 ± 1 ºC. ... 147
Figure 5.15 – A) The change in the UV-Vis spectra of 54 in the presence of C2 observed upon pH jumps from pH=2.0 to higher pH values with final concentrations of [54] = 7.2 × 10⁻⁶ M and [C2] = 8.7 × 10⁻⁵ M; B) simultaneous fitting of the mole fractions of AH+ and A calculated from the spectral data leads to pKa=4.5±0.2 for 54@C2, at 21 ± 1 ºC, aqueous solution. ... 147
Figure 5.17 – kobs as a function of pH for 54 in aqueous solution (red) and in the presence of clip
(blue, 54@C2), using [54] = 7.2×10⁻⁶ M and [C2] = 8.7×10⁻⁵ M. Fitting was obtained with eq. 1.45, for pKa = 4.2 for 54 and pKa = 4.5 for 54@C2; T = 21 ± 1 ºC... 149
Figure 5.18–A) Differential absorbance at 450 nm versus time in seconds in the absence (red, 54, pH = 4.66) and in presence of C2 (blue, 54@C2, pH = 4.06), [54] = 7.2 × 10⁻⁶ M
[C2] = 8.7 × 10⁻⁵ M. Fitting was obtained using an exponential function with kflash= 0.91 s-1 in
the presence of clip pH = 4.06 and 0.45 s-1 without clip pH = 4.66. B) Rates of flash photolysis
versus [H+], for 54 (red) and 54@C2 blue. Linear regressions and obtained equations and correlation coefficients are shown... 150 Figure 5.19 – A) Spectral modifications that occur upon irradiation at 390 nm of an aqueous solution ofequilibrated [54] = 6.3×10⁻⁶ Mat pH = 5.7 in presence of clip [C2] = 4.0×10⁻⁵ M. b) Changes in absorbance at 484 nm in the absence (red circles, 54) and in presence of C2 (blue squares, 54@C2) with time at pH = 5.7... 151
Figure 6.1 – Normalized emission and excitation spectra of free DHF in water (full lines) and encapsulated inside the K+-exchanged zeolite L (dashed lines) at room temperature – aqueous suspension, 1.1 mg / ml, after preparation (ca. 32 min, Figure 6.3). The emission spectrum of the free compound (full line) was obtained by excitation at 360 nm at pH = 3.0, where both AH+ and Ct are in equilibrium. The excitation spectrum of free AH+ was performed at 555 nm at pH = 3.0, while the excitation spectrum of free Ct was carried out by recording the emission at 500 nm at pH = 5. The concomitant excitation spectra of the aqueous suspension of the compound encapsulated in zeolite L were obtained by recording the emission at 450 nm (Ct) and 555 nm (AH+), and the respective emission spectrum was obtained exciting at 360 nm... 159 Figure 6.2 – Polarized fluorescence microscope pictures of single crystals of flavylium-loaded K+ exchanged zeolite L. The size of the crystals is ca 1 μm and in every picture their long axis are approximately perpendicular to each other; λexc = 360-370 nm for A) and λexc = 470-490 nm
for B). ... 161 Figure 6.3 – A) Time evolution of the emission spectra of a suspension of Ct loaded in K+ -exchanged zeolite L (1.1 mg /ml) at room temperature. λexc = 360nm. The Ct spectrum was
1.
Introduction
This chapter is intended to serve as an introduction for the following chapters of this thesis. In a first part, the fundamental aspects of photophysics and photochemistry are summarized, as well as the experimental techniques that were applied. In the second part, the most important notions about the characteristic multiequilibria of flavylium salts in aqueous solutions and their applications are described.
1.1.
Basic principles of photophysics and photochemistry
The aim of this subsection is to provide a very concise illustration of the processes taking place when light is absorbed by a molecule, and some of the associated measurements that were used throughout this thesis.
1.1.1.
Light absorption
In photochemistry, focus is given on light, as an electromagnetic radiation (characterized by a wavelength, λ, a frequency, ν, and a velocity, c) in the region ranging from 100 to 1000 nm. However, it is the concept of light as stream of photons, without mass but with a specific energy, that explains the interaction of light with molecular systems – the interaction between one molecule and one photon is represented in equation 1.1:
A + hν→A* (1.1)
where A represents the ground state molecule, hν is the photon and A* is the excited state molecule, that has extra energy hν. Indeed, the excited molecule must be considered a new chemical species with its own chemical and physical properties, often quite different from those of the excited state.
Molecules possess well-defined electronic states, a direct consequence of the separation between electronic and nuclear motions, known as the Born-Oppenheimer approximation. This is based on the difference of masses between protons and electrons, so that electrons can be considered the fast subsystem and protons the slow one. Two orbitals are of the particular importance for the absorption of light: the HOMO (Highest Occupied Molecular Orbital) and the LUMO (Lowest Unoccupied Molecular Orbital). Absorption of a photon with an appropriate energy can promote an electron from a lower energy orbital (frequently the HOMO) to a higher energy orbital (often the LUMO). For instance a transition of an electron from a π orbital to an antibonding π* orbital can take place (π →π* transition), or from a non bonding electron in an
follows the order: n→π* < π→π* < n→σ* < σ→π* < σ→σ*. The n →π*, for instance considering a carbonyl group, implies that an electron is removed from the oxygen atom and goes into the π* orbital localized half on the carbon atom and half on the oxygen atom, meaning that this transition has a charge transfer (CT) character and implying a change in the dipole moment of the molecule.1 Compounds are called solvatochromic when the position of their absorption (and emission) spectra depend on solvent polarity, a consequence of the preferential stabilization of the ground or excited state orbitals. A bathochromic (red) shift and a hypsochromic (blue) shift with increasing solvent polarity relate to positive and negative solvatochromism, respectively. Such shifts of appropriate solvatochromic compounds in solvents of various polarities can be used to construct empirical polarity scales.1
Experimentally, the efficiency of light absorption is characterized by absorbance (A) or transmittance (T):
o
I
I
T
=
(1.2)T
I
I
A
log
log
0
−
=
−
=
(1.3)where I0 and I are light intensities of the beams entering and leaving the absorbing medium,
respectively. In many cases, the absorbance of a sample follows the Beer-Lambert Law:
[ ]
X bA=
ε
(1.4)where ε is the molar absorption coefficient (M-1 cm-1), [X] is the concentration of a given species X (M) and b is the optical path length (cm). Failure to obey this linear dependence of absorbance with concentration may be related to the formation of aggregates or the presence of other absorbing species.1 The ε expresses the ability of a molecule to absorb light in a given medium. Considering a molecule as an oscillating dipole, the oscillator strengthf, related to the integral of the absorption band, is given by:
ν
ν
ε
∫
−
×
=
d
n
f
4
.
32
10
(
)
9
(1.5)
where n is the refractive index,
ν
is the wavenumber (in cm-1) and f values are normalized, so at its maximum it is 1 (for the harmonic oscillator). For n→π* the values of ε are equal or less than a few hundreds and f value no bigger than 10-3, and for π→π* transitions these values areTwo major selection rules stand for absorption transitions:
1) Spin forbidden transitions: transitions between states of the same spin multiplicity are allowed, like singlet (S) → singlet or triplet (T) → triplet, and those transitions between states of different multiplicity are forbidden, (S → T) or ( T → S). These transitions may be observed due to spin-orbit coupling, however with low ε. Crossing between the first singlet excited state (S1) and the first triplet excited (T1), intersystem crossing ISC, is possible thanks to spin-orbit
coupling.
2) Symmetry forbidden transitions: the transition dipole moment is given by an integral dependent of the product of initial orbital and the final orbital functions. If this product is zero, the integral vanishes and the transition is forbidden, meaning that there is no spatial superposition between the two orbitals. Group theory is particularly useful predicting these cases.2 A symmetry forbidden transition can nevertheless be observed because the molecular vibrations cause some departure from perfect symmetry (vibronic coupling).1
The geometry of a molecule in its ground state represents one stationary point (all forces acting on the nuclei are zero) on a 3N-6 dimensional potential hypersurface (3N-5 in the case of linear molecules). It corresponds to a local minimum - all displacements of nuclei from their equilibrium positions lead to a rise in the potential energy. Other stationary points on the ground-state potential energy hypersurface may represent different conformations of the same molecule or different molecules (including dissociation fragments or isomers). Each excited state has a similar potential hypersurface associatedwith it, exhibiting also stationary points that will not generally coincide with those on the ground-state surface. Scheme 1.1 shows a one-dimensional cross section of the ground state, S0, and two excited-state potential surfaces, one
of which is bound likethe ground state, S1, and the other of which is unbound, S2.3
On bound surfaces, the vibrational motion is also quantized. The spacing of the vibrational energy levels is such that at room temperature most of the molecules are in the lowest vibrational state (according to the Boltzmann distribution). In addition, rotational motion of the molecule about its center of mass is also quantized and the spacing of the rotational energy levels depends inversely on the moment of inertia. For large molecules or in solution, the rotational structure is not resolved and at room temperature a number of rotational levels will be populated. The range of structures in the ground vibrational state is given by the vibrational wave function shown for the lowest vibrational level of S0 in Scheme 1.1. The time required to
hot (vibrationally excited) and may dissociate if the vibrational mode of the excited state corresponds to bond stretching.3
In general, the population of an excited state results in bond weakening, because this new orbital has antibonding character, which has two consequences: excited state minima are often less deep than the corresponding for ground state, so that small amplitude vibrations in the excited state have lower frequencies and smaller energy spacing; large-amplitude motions along relatively flat pathways leading to highly distorted geometries will be found more frequently in the excited state.4
Scheme 1.1 – Potential energy surfaces for bound states, S0 and S1, and a dissociative state, S2.3
To summarize, the width of an absorption spectrum is due to the existence of a continuous set of vibrational sublevels in each electronic state, and broadening can be also obtained from fluctuations in the solvation shell of the absorbing species.
1.1.2.
Fate of the excited state
A representation of the sequence of events taking place after photoexcitation is given by a Jablonski diagram, Scheme 1.2. In the next lines, a brief summary of each process following the photoexcitation is given.
1) Internal conversion (IC): non-radiative transition between two excited states of the same spin multiplicity. When a molecule is excited to an energy level higher than the lowest vibrational level of the first electronic state, vibrational relaxation (and internal conversion if the singlet excited state is higher than S1) leads the excited molecule towards the 0 vibrational level
of the S1 singlet state with a time-scale of 10-13-10-11 s. The excess vibrational energy is
and the laws of thermodynamics can be applied. From S1, internal conversion to S0 is possible
but is less efficient than conversion from S2 to S1, because of the much larger energy gap
between S1 and S0.1
2) Fluorescence: emission of photons accompanying the S1→S0 relaxation.
Fluorescence emission occurs from S1 (apart from a few exceptions) and therefore its
characteristics (except polarization) do not depend on the excitation wavelength. The fluorescence spectrum is located at higher wavelengths than the absorption spectrum because of the energy loss in the excited state due to vibrational relaxation, Scheme 1.2. In general, the differences between the vibrational levels are similar in the ground and excited states, so that the fluorescence spectrum often resembles the first absorption band (‘mirror image’ rule). The gap (expressed in wavenumbers) between the maximum of the first absorption band and the maximum of fluorescence is called the Stokes shift. This important parameter can provide information on the excited states. For instance, when the dipole moment of a fluorescent molecule is higher in the excited state than in the ground state the Stokes shift increases with solvent polarity. Excited molecules stay in the S1 state for a certain time (a few tens of
picoseconds to a few hundreds of nanoseconds, depending on the type of molecule and the medium) before emitting a photon or undergoing other deexcitation processes (internal conversion, intersystem crossing). Thus, after excitation of a population of molecules by a very short pulse of light, the fluorescence intensity decreases exponentially with a characteristic time, reflecting the average lifetime of the molecules in the S1 excited state.1
3) Intersystem crossing (ISC): non-radiative transition between two isoenergetic vibrational levels belonging to electronic states of different multiplicities. For example, an excited molecule in the 0 vibrational level of the S1 state can move to the isoenergetic
vibrational level of the Tn triplet state; then vibrational relaxation brings it into the lowest
vibrational level of T1. Intersystem crossing may be fast enough (10-7–10-9 s) to compete with
other pathways of de-excitation.1
4) Phosphorescence and non radiative deactivation: phosphorescence is the radiative de-excitation of T1 and in solution at room temperature, non-radiative de-excitation from the triplet
state T1, is predominant over it. In fact, during such a slow process (10-6-1 s), the numerous
collisions with solvent molecules (or other molecules, e. g., O2) favor intersystem crossing and
vibrational relaxation in S0. However, at low temperatures and/or in a rigid medium,
phosphorescence can be observed. The phosphorescence spectrum is located at wavelengths higher than the fluorescence spectrum, Scheme 1.2, because the energy of the lowest vibrational level of the triplet state T1 is lower than that of the singlet state S1.1
Once a molecule is excited and reaches triplet state T1, it can absorb another photon at a
different wavelength because triplet–triplet transitions are spin allowed. These transitions can be observed provided that the population of molecules in the triplet state is large enough, which can be achieved by illumination with an intense pulse of light.1
Besides all the previously mentioned processes, excited states can be deactivated by a variety of chemical processes, unimolecular or bimolecular. Excited states are more reactive, as energy rich species, than the ground states which generated them, and they must be considered as completely new chemical species, with completely different reactivity. Excited-state reactions must be fast to compete with the other processes and the key to understanding excited state reactivity is the identification of low energy channels along the excited state surface leading, perhaps via some surface crossing, to the potential minima of the ground state products.
1.1.3.
Lifetimes, quantum yields and efficiencies
The processes that can take place in a molecule after its excitation are summarized in Scheme 1.3, where ki is the rate constant for the process i. Please note that knr, the non radiative
constant includes kisc and kic (rate constant for intersystem crossing and internal conversion,
Scheme 1.3 – Unimolecular (a) and bimolecular (b) processes for the deactivation of the excited state. kr,
knr and kp are unimolecular radiative constants for radiative decay, radiationless deactivation and chemical
reaction, and kq is a bimolecular (quenching) rate constant.4
As in classical kinetics, the disappearance of the excited state molecules, excluding bimolecular processes, can be accounted for by:
[ ]
k
k
k
[ ]
A
dt
A
d
p nr r
* *
)
(
+
+
=
−
(1.6)Integration of the previous equation makes possible the definition of the lifetime τ of the excited species.
j j p
nr r
A = k +k +k = ∑ k 1 ) (
1
*
τ
(1.7)And for each process efficiency ηi can be defined as:
A i j j
i A
i
k
k
k
*
*
τ
η
=
∑
=
(1.8)Finally, the quantum yield Φi of a given process originating an excited state is defined as a ratio between the number of molecules undergoing that process per unit time and the number of photons absorbed per unit time. If the excited state is directly reached by light absorption, the quantum yield coincides with the efficiency of the process:
n n A i i
![Figure 2.3 – A) Spectral modifications that occur in a solution of [DHF] = 1.46×10 −5 M at pH = 1.47 upon addition of [CTAB] = 1.8×10 −2 M at 22 ºC, insert shows the decay at two wavelengths with the first](https://thumb-eu.123doks.com/thumbv2/123dok_br/16476012.732030/80.892.130.712.113.518/figure-spectral-modifications-occur-solution-addition-insert-wavelengths.webp)
![Figure 2.8 –Thermodynamic A) and kinetics B) of DEF, [DEF] = 6.7×10 -6 M. A) pH dependent absorption spectra at room temperature after 1 day in the dark](https://thumb-eu.123doks.com/thumbv2/123dok_br/16476012.732030/85.892.183.814.90.770/figure-thermodynamic-kinetics-def-dependent-absorption-spectra-temperature.webp)