Performance comparison of biotic indices measuring the ecological status
base on soft-bottom macroinvertebrates: a study along the shallow Gomishan
lagoon (Southeast Caspian Sea)
This paper aims to test the suitability of some biotic
indices for their application in Southeast Caspian
Sea. For this purpose, the ecological quality of the
Gomishan lagoon was assessed using three biotic
indices (AMBI, BENTIX, BOPA) during summer
and autumn 2010. The results from the application of
the biotic indices do not highlight a clear distinction
between the stations. The results show that two of
the indices (AMBI and BENTIX) are very close
in terms of diagnosis (good and high) and seem to
generally perform better than BOPA. In addition,
Principal Component Analysis (PCA) based on
abiotic parameters showed clear spatial and temporal
differences in environmental variables. However,
at this shallow sites with low human pressure and
high water residence times, such benthic community
composition can be associated with physical stress due
to salinity increase and to changes in environmental
characteristics, triggered by conventional seasonal
variations. Natural variability of transitional waters is a
crucial factor for a correct evaluation of the ecological
condition of macroinvertebrate communities across
the lagoonal system.
A
bstrAct
Nabee Basatnia
1,*, Seyed Abbas Hosseini
1, Rasoul Ghorbani
1, Pablo Muniz
21 Faculty of Fisheries and Environmental Sciences, Gorgan University of Agricultural Sciences and Natural Resources, Golestan, Iran.
(Nº 6, Safari Alley, Besat St, Emam Khomeini Sq, Ilam, Iran)
2 Oceanografía y Ecología Marina, IECA, Facultad de Ciencias, UdelaR.
(Iguá 4225, Montevideo 11400, Uruguay)
*Corresponding author: [email protected]
Descriptors: Ecological status, Coastal lagoon,
Natural variability, Benthic indices.
O presente trabalho objetiva testar a viabilidade
do emprego de alguns indices bióticos para o Mar
Caspio Sudeste. Para tanto, a qualidade ecológica
da lagoa Gomishan foi utilizada para avaliar três
in-dices bióticos (AMBI, BENTIX, BOPA) durante o
verão e o outono de 2010. Os resultados da
aplica-ção dos indices não permitiram uma distinaplica-ção clara
entre as estações de coleta. Dois dos indices (AMBI
e BENTIX) são bastante próximos em termos de
diagnose (bom ou alto) e parecem funcionar melhor
do que o BOPA. Adicionalmente, a Análise em
Com-ponentes Principais (ACP), baseada em parâmetros
abióticos, mostrou claras diferenças espaciais e
tem-porais nas variáveis ambientais. Contudo, nesses
lo-cais rasos e sem pressão do homem e com alto tempo
de residência da água, a composição da comunidade
bêntica pode ser associada ao estressse físico, devido
ao aumento de salinidade e mudanças nas
caracterís-ticas ambientais, aliado a mudanças sazonais
conven-cionais. A variabilidade natural de águas de transição
mostrou ser um fator crucial para a correta avaliação
da condição ecológica das comunidades de
macroin-vertebrados ao longo do sistema lagunar.
r
esumo
Descritores:
Status ecológico, Lagoa costeira,
Variabilidade natural, Indices bênticos.
INTRODUCTION
Marine and estuarine ecosystems, particularly in coastal areas, are facing great and increasing impacts, including those resulting from physical and chemical transformations, habitat destruction and changes in biodiversity (SERHAT et al., 2006). The increasing impact of human activities on marine ecosystems over
recent decades requires great effort for the assessment of
their ecological quality.
Benthos is an important component of these systems and plays an important role in the maintenance of ecological balance and in the transfer of matter and energy along the trophic chain, and it also participates directly in biogeochemical processes of the cycling of nutrients such as carbon and nitrogen at the sediment-water interface (INGOLE et al., 2006). Given recent concerns about global warming, climate change and habitat degradation, the knowledge and protection of marine biodiversity have become paramount and these include studies on benthic communities and assemblages in pristine and degraded areas.
In recent years, various benthic biotic indices have been applied in different geographical areas in order to establish the environmental quality of benthic soft-bottom marine communities. Univariate diversity indices such as the Shannon diversity index (H’) were commonly used in the past, while most of the recently developed biotic indices rely on the model of organic enrichment proposed by PEARSON and ROSENBERG (1978), i.e. AMBI (BORJA et al., 2000; MUXIKA; BORJA, 2005), the BENTIX (SIMBOURA; ZENETOS, 2002), and the Benthic Opportunistic Polychaete Amphipod Index (BOPA) (DAUVIN; RUELLET, 2007), all of which divide soft-bottom benthic species into previously deined ecological groups (PEARSON; ROSENBERG, 1978).
The AMBI has been proposed for the assessment of the ecological status of estuarine and coastal waters (ZETTLER et al., 2007). BORJA et al. (2004) and MUXIKA et al. (2005) state that AMBI was validated in areas involving a large range of impact sources (domestic waste, heavy metals, submarine outfalls, drilling cuts with ester-based mud, industrial and mining waste). Generally, this was done in accordance with the community structure measurements and multivariate methods used in assessing anthropogenic impacts (MUNIZ et al., 2005, 2011; PRATO et al., 2009). A few years later, the same research group proposed a new multivariate index combining AMBI
with species richness (S) and community diversity (H’): M-AMBI (MUXIKA et al., 2007). This index is based on the observation that benthic communities respond to improvements in environmental quality in three stages. First, species abundance increases, subsequently species diversity rises, and inally the dominant species change (PEARSON; ROSENBERG, 1978).
The BENTIX index (SIMBOURA; ZENETOS, 2002) is a marine biotic index based on the concept of indicator species and was also developed for the purpose of the classiication of the ecological status of the marine environment, using the macroinvertebrate quality elements. This index is designed for the assessment of the impact caused by general stress factors and does not discriminate amongst natural and anthropogenic disturbances (SIMBOURA et al., 2007). It has been tested successfully in a variety of Hellenic benthic ecosystems (SIMBOURA; ZENETOS, 2002), in areas subject to organic pollution such as Athens and theSaronikos gulf (SIMBOURA et al., 2005), and to oil spills (ZENETOS et al., 2004). Currently it is undergoing testing in other Mediterranean areas within the Water Framework Directive intercalibration exercise (VINCENT et al., 2002; SIMBOURA et al., 2007).
Nevertheless there are others, such as the BOPA index, in which the taxonomic effort is reduced. The BOPA index is based on the ratio between opportunistic Polychaetes and Amphipods (except the genus Jassa). The main
advantages of this index, as well as the reduced taxonomic knowledge involved, are its independence of sampling protocols, since this frequently uses data in the proportion of each category of organism (PINTO et al., 2009).
The coastal lagoons of the southern Caspian Sea are an essential habitat for a range of fauna. Gomishan lagoon (Iran), which met the criteria of the Ramsar Convention on wetlands, is one of the most important ecosystems of the south Caspian Sea (GANDOMI et al., 2011). Saltmarsh vegetation as well as lats of glasswort species cover the central part of the lagoon. In addition, this lagoon has a diverse, abundant bird population and provides important feeding grounds and a wintering habitat for waterfowl during the autumn and winter, and is, therefore, an important source of food for 15 ish species (ECE, 2011).
Thus, the lagoon is partly connected to the Caspian Sea, which directly inluences its hydrological features (RIAZI, 2001). The major factor, which has a potentially detrimental effect on the natural ecological character of the lagoon, is the Caspian Sea’s seasonal water level luctuation. According to BASATNIA et al. (2012), water depth and residence times play a vital role in the biochemical processes of theGomishan coastal ecosystem. The Caspian Sea is non-tidal and conined, so the sea’s ability to absorb pollution is less than that of an open ocean. Additionally, oil spills can remain localized thus becoming a greater threat to marine life than if they were broken up and dispersed by a rough sea (NEVILLE, 2006). Also industries such as wood and paper, textile, chemicals, food products and foods processing, electronics, and ish processing are the major ones in the surrounding seaboard cities (JAFARI, 2010). As this lagoon is connected with the sea, a great amount of polluted material enters the Caspian Sea from it (RIAZI, 2001).
The aim of the present study, in view of all the above, was to investigate the suitability of different univariate indices (AMBI, BENTIX, BOPA) to distinguish between ecological conditions in Gomishan lagoon with different types of anthropogenic impacts and high levels of natural variability.
MATERIAL AND METHODS
Study area
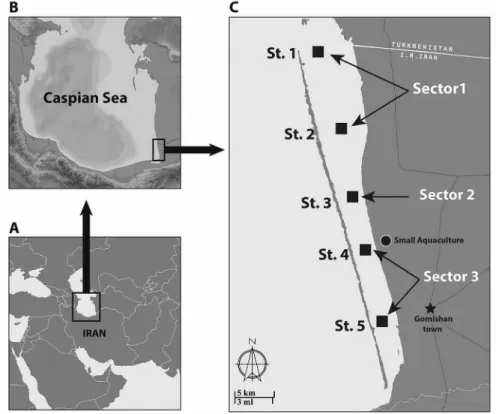
The study area, the Gomishan lagoon, is situated on the southeastern coast of the Caspian Sea (N 37º09ʹ0 9ʺ to 37º, 20ʹ, 2ʺ; E 53º 54ʹ 34ʺ to 53º 58ʹ 54ʺ), has a surface area of 17,700 hectares and is a natural coastal lagoon located in Golestan province in the Islamic Republic of
Iran. Previous study has shown that the depth of water
is variable and depends on the luctuations in the water level of the Caspian Sea. In spite of this variation, the Gomishan lagoon is only of about 1m depth throughout, except inits north-west region where the water depth may reach up to 2.5 m (GANDOMI et al., 2011). The main lagoon area comprises shallow, brackish lagoons with salt marsh vegetation and seasonally looded lats with species of Salicornia, Halostachys and Halocnemum. To the west (Figure 1) the site is bounded by low coastal dunes with typically sand-dune vegetation and the Caspian beach, but it is completely connected to the Caspian Sea in the north. To the east, the site extends onto the short-grass
plains of the Turkaman Steppes, large areas of which are under cultivation for wheat and cotton (SCOTT, 2013). Most of the northern half of the lagoon is a no-hunting and no-ishing zone and regularly supports more than 20,000 water birds (ECE, 2011).
The water quality and macrobenthic structure sampling was carried out during summer and autumn 2010 at ive stations (sampled monthly) (Figure 1). The range of sampling depth was between 30 and 143 cm. In this system, three equivalent sectors were deined in order to include the wide depth range: sector A (stations 1, 2), near the lagoon mouth, was the deepest; sector B (station 3) was of intermediate depth, and sector C (stations 4, 5), in the lower part of the lagoon, was less affected by marine inluence and was shallower. Station 1 was located in the marine zone adjacent to the lagoon’s opening. In this part of the lagoon the hydrological features are directly inluenced by the Caspian Sea; there is no anthropogenic activity or agricultural land use at this station. Stations 2 and 3 are located near the coast of the Turkmen Steppe plain along which there is cultivated land use. These parts of the lagoon are covered by salt marsh vegetation during the summer months. There is a shrimp farm under construction in the area. Station 4 is located in a small aquaculture area with a view to assessing the inluence of aquaculture. Station 5 is located near the small town of Gomishan; in this area, the principal human activity is livestock grazing and the second main land use agriculture (wheat and cotton cultivation) (RIAZI, 2001). This lagoon is part of the Gorganrood basin. However, this river does not play a major role in the lagoon’s water supply (ECE, 2011).
Abiotic parameter sampling and analysis
In situ measurements of temperature, salinity anddissolved surface water oxygen (DO) were taken at all stations with a YSI-85 multiparameter. The water samples were collected at surface level using a 2l van Dorn bottle because of the low depth and absence of stratiication.
The water samples were stored and refrigerated at 4ºC
for later laboratory analysis. All the sampling trips were carried out between 8:00 a.m. and 12:00 noon, local time. The water samples were analyzed for assessment of NO3- with reduction of NO
3- to NO2- using a
Figure 1. Gomishan lagoon and sampling stations (St. 1 to St. 5).
determined using a BOD5 Track apparatus (CAMLAB Ltd., UK). The measurement of pH was made using a pH-meter in the ield.
One extra grab sample was obtained at each station monthly to determine the Total Organic Carbon (TOC). Organic matter content in the sediment was measured in order to test the pressure-impact relationship of the assessment methods. This environmental variable was chosen as a surrogate for generalized anthropogenic pressures since it tends to correlate with a wide set of factors causing ecological stress in benthic communities (e.g. low dissolved oxygen, high ammonia and sulphide, chemical contamination) (HYLAND et al., 2005). TOC of sediments was determined by the WALKLEY and BLACK (1934) procedure.
Macroinvertebrate sampling and
laboratory procedure
At each station samples for benthic macroinvertebrates were collected in triplicate using a van Veen grab (0.026 m2), between the summer and autumn (monthly
surveys between June and November) 2010. The sediment was sieved on a 1 mm mesh size sieve and the animals were preserved in the ield in a 4% formalin solution in
seawater, and dyed with Rose Bengal. In the laboratory, macrofauna was sorted manually under stereomicroscopy and then identiied to the lowest tractable taxonomic group (in most cases to Family level) and, inally, counted.
Data analysis
Without any previous data that could provide a proper basis for reference, in the present study we computed three types of indices based on pollution-indicative or sensitive taxa: BOPA, AMBI and BENTIX.
The values of the AMBI, BENTIX and BOPA indices were calculated on the benthic data series using the following algorithms:
Owing to the nature of data (Ecological Quality classes), correlations between indices-based classiications were tested on the basis of ranks through the use of the non-parametric Spearman rank-correlation coeficient. Analyses were performed with R v2.9.0 (http://www.R-project.org).
Hierarchical agglomerative cluster analysis was carried out on the normalized data by means of Ward’s method, an extremely powerful grouping mechanism, which yields a larger proportion of correct classiied observations (WILLET, 1987), using squared Euclidean distances as a measure of similarity (MASSART; KAUFMAN, 1983; WILLET, 1987).
A principal component analysis (PCA) (LEGENDRE; LEGENDRE, 1984) was performed utilizing a two-way table of chemico-physical parameters (IZZO et al., 2005) and sampling stations. These multivariate ordination analyses were carried out with XLSTAT2010 software.
RESULTS
Abiotic parameters
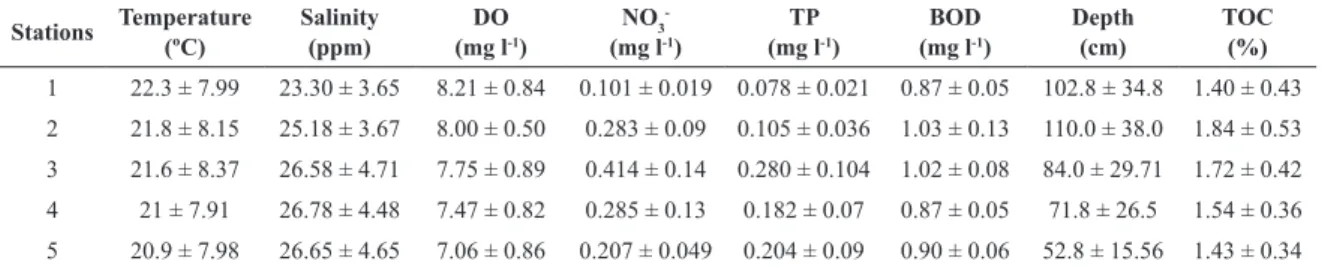
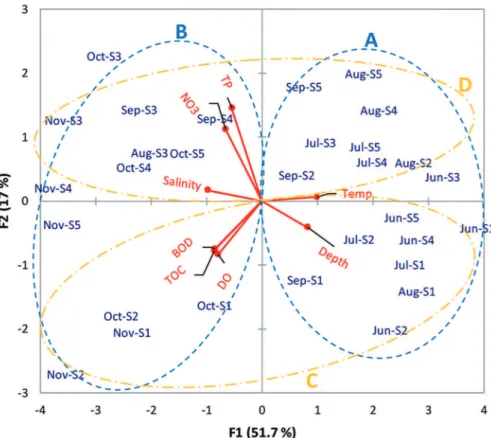
The abiotic parameter measurements are summarized in Table 1. The salinity decreased from the innermost part of the lagoon towards its mouth to the Sea presenting a minimum (19.8) at Station 1 and maximum (34) at Station 5, in June and November, respectively. A similar temporal trend was observed also for dissolved oxygen (5.6 mg.l-1 at Station 1 in June and 10.4 mg.l-1 at Station
2 in November). Regarding nutrient concentrations, the highest concentrations for total phosphorus and nitrate were observed at station 3 (0.39 mg l-1, 0.74 mg l-1)
in August and October, respectively, while the lowest concentrations were observed at station 1 (0.078 mg l-1,
0.101 mg l-1) in June near the marine zone adjacent to
the opening. Contrary to expectations, the highest BOD concentration (1.5 mg l-1) was observed at station 2 and
the lowest were found at stations 1 and 3 (0.66 mg l-1) in
November and August, respectively.
General characteristics of the
macrobenthic fauna
Table 2 shows the benthic macroinvertebrate taxa recorded for the ive sampling stations in the Gomishan lagoon during the sampling period. Overall, a total of 59,299 individuals belonging to 10 taxa were collected. Gastropoda were dominant (65.4% of total abundance), followed by Polychaeta (21.7%), Insecta (6.2%), Crustacea the list were classiied according to the literature and the
knowledge of the authors and other experts with a wide knowledge of the study area.
Where %GI, %GII, %GIII, %GIV, and %GV are the relative abundance of disturbance-sensitive, disturbance-indifferent, disturbance-tolerant, second-order opportunistic, irst-second-order opportunistic species, respectively. Low values are indicative of undisturbed habitats. AMBI methods were calculated using the AMBI software (http://www.azti.es).
BENTIX: was calculated according to SIMBOURA and ZENETOS (2002), using the same principle as AMBI, based on the classiication of the ecological group of soft-bottom species according to their sensitivity to an increasing stress gradient (MUNIZ et al., 2012).
Where GS and GT are “sensitive” (including the indifferent) and “tolerant” (including tolerant and opportunistic) species, respectively. BENTIX values range from 6 (only “sensitive” species are present) to 2 (“tolerant” species constitute 100% of the total abundance) (SIMBOURA; ZENETOS, 2002). The BENTIX index was applied using the Add-In (1.1. Version) software package for MS Excel 2007 (http://bentix.ath.hcmr.gr/).
BOPA: The Benthic Opportunistic Polychaete-Amphipod Index (BOPA) is also based on the ecological characteristics of speciic taxonomic groups and compares percentage ratios of opportunistic Polychaetes and Amphipods (DAUVIN; RUELLET, 2007). The BOPA is low when the environment is of good quality, but it increases when the environmental conditions degenerate.
Where fp is opportunistic polychaete frequency, fa
is amphipod (excluding genera Jassa) frequency. BOPA
index varies between 0 (when fp = 0) and 0.30103 (when fa = 0) (DAUVIN; RUELLET, 2007).
Table 1. Summary results (mean value of six months sampling) for abiotic parameters with one standard error (S.E.) at each
sampling site from June to November 2010.
Stations Temperature
(ºC)
Salinity (ppm)
DO (mg l-1)
NO3
-(mg l-1)
TP (mg l-1)
BOD (mg l-1)
Depth (cm)
TOC (%)
1 22.3 ± 7.99 23.30 ± 3.65 8.21 ± 0.84 0.101 ± 0.019 0.078 ± 0.021 0.87 ± 0.05 102.8 ± 34.8 1.40 ± 0.43 2 21.8 ± 8.15 25.18 ± 3.67 8.00 ± 0.50 0.283 ± 0.09 0.105 ± 0.036 1.03 ± 0.13 110.0 ± 38.0 1.84 ± 0.53 3 21.6 ± 8.37 26.58 ± 4.71 7.75 ± 0.89 0.414 ± 0.14 0.280 ± 0.104 1.02 ± 0.08 84.0 ± 29.71 1.72 ± 0.42 4 21 ± 7.91 26.78 ± 4.48 7.47 ± 0.82 0.285 ± 0.13 0.182 ± 0.07 0.87 ± 0.05 71.8 ± 26.5 1.54 ± 0.36 5 20.9 ± 7.98 26.65 ± 4.65 7.06 ± 0.86 0.207 ± 0.049 0.204 ± 0.09 0.90 ± 0.06 52.8 ± 15.56 1.43 ± 0.34
Table 2. Mean abundance (A, ind.m-2), dominance (D, %) and assignment of ecological groups (EG) to taxa by BENTIX and
AMBI indices of the macroinvertebrates taxa at the ive stations sampled in the Gomishan lagoon from June to November 2010.
Taxa Station 1 Station 2 Station 3 Station 4 Station 5 BENTIX
EG
AMBI EG
A D A D A D A D A D
Balanidae - - - - 102 0.48 102 0.48 16 0.07 - -Gammaridae 1150 6.50 2123 5.11 - - - - 557 2.37 GS I
Chironomidae 2944 16.64 2803 6.75 1571 7.35 1571 7.35 272 1.16 GT III
Odostomia sp 10242 57.9 33273 80.11 14529 68.00 14529 68.00 11336 48.19 GS II
Cardium sp 515 2.91 563 1.36 72 0.34 72 0.34 341 1.45 GT III
Abra ovata 78 0.44 171 0.41 264 1.24 264 1.24 120 0.51 GT III
Mytilaster sp 109 0.62 80 0.19 7 0.03 7 0.03 - - GS I
Ampharete sp 1853 10.48 2461 5.92 4540 21.25 4540 21.25 10649 45.27 GS I
Nereididae sp 70 0.40 38 0.09 75 0.35 75 0.35 73 0.31 GS III
Tubiicidae 726 4.11 22 0.05 206 0.96 206 0.96 158 0.67 GT V GT: Tolerant species; GS: Sensitive species.
(3.2%), Bivalva (2.3%) and Oligochaeta (1.3%). The total abundance (ind.m-2) indicated a large difference
between the lowest (8700 ind.m-2 at station 1, June) and
the highest (86954 ind.m-2 at station 2, November) values
recorded. On average, during the survey, two top taxa
(Odostomia sp. and Ampharete sp.) constituted between
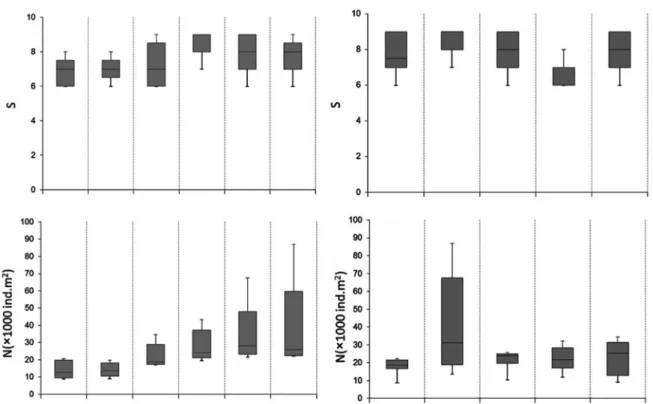
68.4% and 94% of the total abundance (Table 2). Stations 1 and 2 (located near the opening to the sea) were, in general, dominated by the Gastropoda Odostomia sp. and by the Insecta Chironomidae. Chironomidae were present at all the sampling sites but particularly abundant at station 2 during autumn. Stations 3, 4 and 5, located in the central and inner part of the lagoon, were mainly dominated by the Gastropoda Odostomia sp. and the Polychaeta Ampharete
sp. At each station, the species number was lower during summer, increasing during autumn (Figure 2).
Benthic indices and ecological quality
AMBI
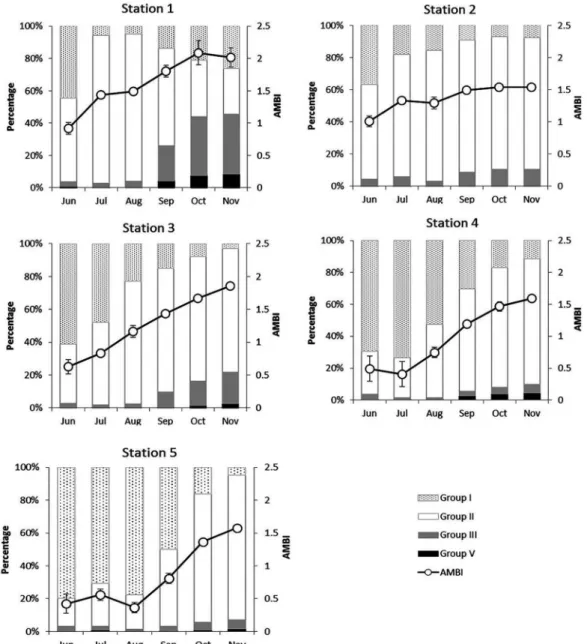
Figure 3 shows the temporal changes of the percentage of Ecological Groups (EG) and AMBI at every sampling location. In some cases, less than 4% of the individuals per
sample were not assigned to the ecological groups, i.e. at the sampling sites 3, 4 and 5.
According to the classiication proposed by BORJA et al. (2000), the benthic community health of this lagoon presented stations classiied as ‘‘good” or ‘‘high”. In the area, AMBI values ranged from 0.36 to 2.35 (both at station 5, in August and September, respectively). The proportion of the EG at each station changed slightly during the study period (Figure 3). For example, at stations 3, 4 and 5 the abundance of group I species (disturbance-sensitive) increased during summer, but the abundance of group II species (disturbance-indifferent) was highest in autumn. However, changes in abundance, due to recruitment, were mainly evident for the dominant species (ecological groups) of the community and, thus, the ecological status remained rather constant (KRÖNCKE; REISS, 2010).
BENTIX
Figure 2. Box-and-whisker plots showing the distribution of the species richness (S) and abundance (N ind.m-2) values in the ive stations and each
one of the six surveys.
BOPA
The BOPA showed a different pattern from that of the other indices concerning the classiication of the ecological quality status (Figure 4). According to the results of this index, the quality of the lagoon was classiied as ‘poor’ to ‘moderate’ at stations 3, 4 and 5 during summer (June-August), whereas it was ‘good’ and ‘high ‘during the autumn (September-November). Stations 1 and 2 were classiied as ‘moderate’ in June, and as ‘good’ and ‘high ‘during the rest of the sampling period.
Correlations between different indices
The highest correlations (Figure 5) were found between AMBI and BOPA and between BENTIX. The results shown that in Gomishan lagoon, BOPA was always signiicantly correlated with the other taxa indices (AMBI and BENTIX).
When considering the ive EcoQS classes, most indices showed signiicant correlations with each other. This means that the AMBI, BENTIX and BOPA basically ranked the stations in the same way, from worst EcoQS to best EcoQS. However, these results showed that AMBI,
BENTIX and BOPA basically differed in the range of EcoQS attributed to the stations. As an example, using the same set of stations, AMBI and BENTIX would classify these stations from ‘Good’ to ‘High’, whereas BOPA index would classify this same set from ‘Bad’ to ‘High’ (Figure 4).
PCA and Cluster analysis
Figure 3. Percentage of ecological groups (I, II, III and V) and AMBI values at each one of the ive sampling locations in each
one of the six months sampled.
Figure 4. Comparisons of indices among the ive stations and each one of the months sampled. Classes range associated
Figure 5. Scatterplot matrix of the different biotic indices (AMBI, BENTIX and BOPA), community parameters
(N: total abundance) and the TOC (total organic carbon) for Gomishan lagoon.
Figure 6. Diagram of the principal components analysis results based on environmental variables (Red vectors).
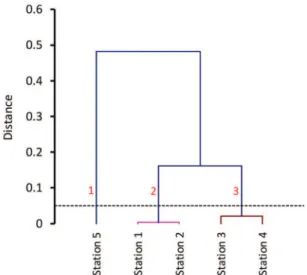
Figure 7. Cluster analysis of sampling stations based on environmental
variables (mean values) during study period.
According to Figure 7, three statistically signiicant clusters are formed: Cluster 1 (sampling site 5, near the town of Gomishan) corresponds to station 5 in the south of the lagoon. Cluster 2 (sampling sites 1 and 2) corresponds to the lagoon inlet. Cluster 3, consisting of stations 3 and 4, located in the middle of the lagoon, was less inluenced by the Caspian Sea.
DISCUSSION
This study provided a table of reference for the structural composition of the subtidal benthic communities in the Gomishan lagoon. Although the macroinvertebrate communities found in the lagoon presented a poor set of species, this does not relect any disturbed conditions in this transitional ecosystem. Many of the benthic indices have been tested successfully to detect anthropogenic disturbances such as dredging, dumping, engineering works, sewage plans and gravel extraction (MUXIKA et al., 2005). However, most biological indices may be affected by any kind of disturbance whether caused by anthropogenic impacts or natural processes (WILSON; JEFFREY, 1994; KRÖNCKE; REISS, 2010; MUNIZ et al., 2012). The high seasonal variability of abundances seems mainly to be due to the different life cycles of several of the taxa which dominate in the lagoon such as the Polychaetes and Molluscs. Moreover, the seasonal trends presented by the macrobenthic communities of this lagoon can be attributed to the naturally luctuating environmental conditions. Similar results were obtained previously by GRAVINA et al. (1989) and PRATO
et al. (2009). To our knowledge, despite human activity in this area) such as aquaculture, agricultural and urban) no
disturbances caused by anthropogenic activities occurred at the stations sampled during this study. Thus, we assume that changes in the macrofauna communities relected the “natural” seasonal variability. This is discussed in more detail below.
Abiotic parameters
Transitional waters are very heterogeneous and physico-chemically unique ecosystems, characterized by the temporal and spatial variability of the environmental features and ecological processes involved (CHAPMAN; WANG, 2001). The temporal variations of water salinity in the lagoon constitute an equilibrium between the temperature and the seawater exchange (BASATNIA et al., 2012). The water salinity of the lagoon is higher than that at the opening (station 1). According to our own direct observations, it seems that the water exchange between the lagoon and the Caspian Sea, through the inlet, plays a vitally important role in water salinity variations. The maximum mean DO values recorded at stations 1 and 2 can be explained by the fact that the dominant wind direction throughout the study period was northerly as this introduces marine water into the lagoon. This was shown by the marine inluence that characterized the stations near the lagoon inlet (stations 1 and 2). Also, the higher DO in the north of the lagoon can be associated with the low atmospheric humidity (ECE, 2011) and low water salinity (TAPIA GONZÁLEZ et al., 2008) in this part of the lagoon.
The highest Nitrate concentrations were observed at station 3, while low concentrations were observed at station 1, near the marine zone adjacent to the opening. The disappearance of aquatic plants in the central part of the lagoon (during autumn) can lead to increased amounts of organic nutrients in the sediments; these results are in accordance with those of MCELROY et al. (2002). The release of inorganic nitrogen from the bottom sediments may regulate the nitrogen load in lakes (GETA et al., 2004). The source of nitrogen released by sediment is the decomposition of organic matter, though it is not
contribute to the process of eutrophication. However, FLEMING and FRASER (2001) and BOROS et al. (2008) stated that migratory birds did not greatly affect nutrient levels in water. The TP changes are similar to the trends of nitrate, reinforcing the argument that variability in these parameters has a common origin. These results are in accord with those of ALDRIDGE et al. (2009).
In our study, mean TOC values were very similar at all the sampling stations (1.4 to 1.8%). According to HOLMER et al. (2005), in coastal sediments where only natural sources of organic enrichment occur, the TOC sediment content was < 5%, while in organically rich sediments, the proportion of TOC can increase to8%, although higher levels of TOC (> 10%) are seldom observed in coastal sediments without anthropogenic disturbances.
Spatial and Temporal patterns of biotic
indices
Since the aim of this study was to compare the ecological status obtained using benthic indices, the use of reference conditions was not considered necessary. The approach followed did not focus on the inal score of each index, rather emphasizing index values and the distinctiveness of the ecological status of each station. A similar approach was followed by CARDOSO et al. (2012) using four benthic community based indices in ive small estuaries.
Several studies have demonstrated that in soft sediment invertebrates show patchy distributions on small spatial scales (MORRISEY et al., 1992; YSEBAERT; HERMAN, 2002; TATARANNI et al., 2010). The spatial resolution and sample number for this study was not suficient to delineate detailed zonation patterns, however, as the results show, there is a clear dominance of ecological groups II and I at all the stations respectively, except at station 5 where ecological group I was more abundant than ecological group II. For this reason, AMBI generally classiies the sites as unpolluted. Tolerant species are predominantly found in disturbed environments whereas sensitive species are mostly restricted to undisturbed or only slightly disturbed environments (ROSENBERG et al., 2004). Although the AMBI is particularly useful in detecting the temporal and spatial impact gradient, its robustness is reduced when a very low number of taxa exist (BORJA et al., 2004). The same could occur when studying naturally stressed locations (e.g. naturally organic matter enriched bottoms) (SERHAT et al., 2006). In the above mentioned particular cases, BORJA and MUXIKA (2005) recommend the use of AMBI, together with other
metrics, in order to obtain a more comprehensive view of the benthic community.
According to AMBI and BENTIX, during the study period all stations should be considered as displaying
an undegraded EcoQS (good or high); also the temporal
variability of these indices is generally low. The results of AMBI, developed speciically to measure the benthic response to organic enrichment, indicate that a slight degradation occurs in ecological status between June and November, with the benthic community changing from a high to a good status. These results were due to a gradual replacement of dominant sensitive taxa such as Odostomia sp. by more disturbance tolerant species in the lagoon (e.g., Cardium sp. and Tubiicidae). This can explain the spatial and temporal changes presented by BENTIX as well. This change was more severe at station 1 than at the other stations for AMBI and BENTIX. It is believed that this may be due to the effect of the luctuations of the Caspian Sea water level, because this station is located near the lagoon’s opening.
According to BOPA, a more degraded situation was present. BOPA index shows that most samples in the summer ranged from bad to poor. The Polychaete/ Amphipod ratio is probably inluenced by a large spectrum of ecological factors, including some types of pollution (SALAS et al., 2006). However, regarding the Polychaete/ Amphipod ratio, most samples in summer did not permit its application simply due to the absence or low abundance of amphipods. In such a case, the ratio would relect an extremely polluted scenario, which was certainly not the case. This is one of the disadvantages of the BOPA index, as mentioned by DAUVIN and RUELLET (2007).
Coincidence among the indices
AMBI and Bentix produced ‘high’ or ‘good’ EcoQS in the Gomishan lagoon. This means that the AMBI and BENTIX indices generally ranked the stations similarly, but disagreed on the precise level of EcoQS attributed to each station by the different indices. However, the BOPA index rating ranged from ‘bad’ to ‘high’ (during all the surveys), with a predominance of ‘good’ and ‘high’ ratings.
High correlations were observed between AMBI and BENTIX. This comparison, in the context of the general concordance of the patterns, highlights some differences. For AMBI, most samples in summer were classiied as of ‘high’ quality, but most samples in autumn were classiied as of ‘good’ quality. Whereas, according to BENTIX,
with the exception of two samples. Station 1 in October and November was classiied as ‘good’. According to SIMBOURA and REIZOPOULOU (2007), this could be related to the different design of each index. On the other hand, in BENTIX each ecological group is weighted equally, whereas AMBI renders a different coeficient for each one; moreover, the scaling of the distances between classes is different in the two methods.
The average number of taxa identiied at each sampling station never exceeded 9 in any one sample. However, SIMBOURA (2004) recommends using AMBI rather than BENTIX for sites where speciic richness is low and total abundance high, considering that AMBI more exactly deines the ecological groups of the sampled species (ive groups for AMBI versus only two for BENTIX). However, in this study, the BENTIX index showed the same reliability as AMBI.
BOPA showed high correlations with AMBI, as is to be expected, since it classiies opportunistic Polychaetes according to AMBI’s list of ecological groups (SUBIDA et al., 2012). Furthermore, signiicant correlations were also found between BOPA and BENTIX.
As mentioned, BOPA showed a different EQ classiication. The BOPA index only takes into account amphipods and opportunistic Polychaetes, whereas AMBI and BENTIX consider the whole community. For example, some bivalves, such as Cardium sp or Abra sp, are assessed in this study as group tolerant. This in view of the fact that these bivalves would allow the detection of changes in benthos that are not detected by the BOPA index.
Many researchers (LABRUNE et al., 2006; BLANCHET et al., 2008; BORJA; DAUER, 2008; BAKALEM et al., 2009; DAUVIN et al., 2009; GRÉMARE et al., 2009; RANASINGHE et al., 2009) have highlighted the differences in assessments produced by the various benthic indicators. These differences are caused by several things, in particular by the fact that the indicators do not use the same method for species classiication (e.g., the AMBI classiies species into Ecological Groups following PEARSON and ROSENBERG’s concept. The BOPA takes into account only amphipod sensitive and Polychaete opportunistic species). The EcoQS of coastal waters is impacted by both natural and anthropogenic factors. WFD wishes that the assessment method, based on ecological elements, should respond to anthropogenic pressures, rather than to natural variability (TUEROS et al., 2009). Our results show that all the indices tested in this study respond to natural disturbances such as low temperatures
in autumn and the effects of the saline intrusion from the Caspian Sea. As a result, the ecological quality status changed from ‘high’ to ‘good’ (AMBI and BENTIX) or even ‘bad’ (BOPA) conditions. However, not all indices respond to the disturbances in the same way, consequently, the strength of response varied between the indices and the different disturbance events.
Nevertheless, the use of different indices is always advisable in order to obtain a better evaluation of the benthic community’s health (MUNIZ et al., 2011; LABRUNE et al., 2006), consequently, it is necessary to include different indices in the assessment schemes to make sure that the natural variability can be detected and considered.
Cluster analysis and PCA
The dendrogram clariies the difference at sampling station 5, which makes one group, Cluster 1, receive polluted efluents from point or non-point sources, i.e., from agricultural and urban activities. Sampling sites 1 and 2 (Cluster 2) correspond to the lagoon’s opening. These stations are placed in the same group because both extremes have similar water column conditions. These stations are located near the lagoon inlet which seems to
be affected by the Caspian Sea water; Stations 3 and 4 (Cluster 3) indicate similar water conditions, despite the aquaculture efluent in the station 4.
The PCA analysis (Figure 6) showed a clear spatial and temporal division, and the sampled stations subdivide
lagoon water, indicating the healthy state of the ecosystem (PRASANNA; RANJAN, 2010; PANIGRAHY et al., 1999; UPADHYAY, 1988).
CONCLUSIONS
The present study constituted the irst attempt to use AMBI, BENTIX and BOPA in the small shallow Gomishan lagoon, south east of the Caspian Sea. This area is characterized by unstable environmental conditions (salinity, depth, temperature) and macrobenthic communities dominated by few species.
Based on the agreement between the indices, our results show that two of them (AMBI and BENTIX) are very close in terms of diagnosis (good and high) and seem generally to perform better in the case of our study sites than BOPA does. In addition the EcoQS assessment was validated by abiotic parameters and human pressure information. However, it did not detect clear temporal and spatial changes, despite using the BOPA index. For the assessment of the ecological status of marine benthic environments univariate indices are not appropriate and depend on the seasonal variability.
In the near future, the establishment of aquaculture production in these areas may have negative effects on the benthic communities. However, the potentially deleterious effect of these new culture practices on surrounding lagoonal areas requires further assessment.
ACKNOWLEDGEMENTS
The authors wish to express their gratitude to the “Gorgan University of Agricultural Sciences and Natural Resources” and “Inland Waters Aquatic Stocks Research Center-Gorgan” for providing the Framework of the studies and the access to data. We would also thank K. BozorgOmid for his help in the ield work. PM also thanks SNI-ANII (Uruguay) and the Universidad de la República.
REFERENCES
AFLI, A.; AYARI, R.; ZAABI, S. Ecological quality of some Tunisian coast and lagoon locations, by using benthic community parameters and biotic indices. Estuar. Coast. Shelf Sci., v. 80, n. 2, p. 269-280, 2008.
ALDRIDGE, K. T.; DEEGAN, B. M.; LAMONTAGNE, S.; BISSETT, A.; BROOKES, J. D. Spatial and temporal changes in water quality and sediment character in Lake Alexandrina and Lake Albert during a period of rapid water level drawdown. Canberra: CSIRO: Water for a Healthy Country National Research Flagship, 2009.
ANDERSEN, D. C.; SARTORIS, J. J.; THULLEN, J. S.; REUSCH, P. G. The effects of bird use on nutrient removal in a constructed wastewater-treatment wetland. Wetlands, v. 23, n. 2, p. 423-435, 2003.
ARASAKI, E.; MUNIZ, P.; PIRES-VANIN, A. M. S. A functional analysis of the benthic macrofauna of the São Sebastião Channel (Southeastern Brazil). Pubbl. Staz. Zool. Napoli (I: Mar. Ecol.)., v. 25 n. 4, p. 249-263, 2004.
BAKALEM, A.; RUELLET, T.; DAUVIN, J. C. Benthic indices and ecological quality of shallow Algeria ine sand community. Ecol. Indic., v. 9, n. 3, p. 395-408, 2009. BALD, J.; BORJA, A.; MUXIKA, I.; FRANCO, J.; VALENCIA,
V. Assessing reference conditions and physico-chemical status according to the European Water Framework Directive: a case-study from the Basque Country (Northern Spain). Mar. Pollut. Bull., v. 50, n. 12, p. 1508-1522, 2005.
BASATNIA, N.; HOSSEINI, S. A.; KHALEDIAN, Y. Monitoring some ecological affected parameters of water quality of the Gomishan Lagoon, south-east of Caspian Sea. ASA-CSSA-SSSA International Annual Meetings. Cincinnati: Ohio, 2012. BIGOT, L.; GRÉMARE, A.; AMOUROUX, J. M.; FROUIN, P.;
MAIRE, O.; GAERTNER, J. C. Assessment of the ecological quality status of soft-bottoms in Reunion Island (tropical Southwest Indian Ocean) using AZTI marine biotic indices. Mar. Pollut. Bull., v. 56, n. 4, p. 704-722, 2008.
BLANCHET, H.; LAVESQUE, N.; RUELLET, T.; DAUVIN, J. C.; SAURIAU, P. G.; DESROY, N.; DESCLAUX, C.; LECONTE, M.; BACHELET, G.; JANSON, A. L.; BESSINETON, C.; DUHAMEL, S.; JOURDE, J.; MAYOT, S.; SIMON, S.; DE MONTAUDOUIN, X. Use of biotic indices in semi-enclosed coastal ecosystems and transitional waters habitats - implications for the implementation of the European Water Framework Directive. Ecol. Indic., v. 8, n. 4, p. 360-372, 2008.
BORJA, A.; DAUER, D. M.; DÍAZ, R.; LLANSÓ, R. J.; MUXIKA, I.; RODRÍGUEZ, J. G.; SCHAFFNER, L. Assessing estuarine benthic quality conditions in Chesapeake Bay: a comparison of three indices. Ecol. Indic., v. 8, n. 4, p. 395-403, 2008.
BORJA, A.; DAUER, D. M. Assessing the environmental quality status in estuarine and coastal systems: comparing methodologies and indices. Ecol. Indic., v. 8, v. 4, p. 331-337, 2008.
BORJA, A.; FRANCO, J.; MUXIKA, I. The biotic indices and the Water Framework Directive: the required consensus in the new benthic monitoring tools. Mar. Pollut. Bull., v. 48, n. 3/4, p. 405-408, 2004.
BORJA, A.; FRANCO, J.; PÉREZ, V. A marine biotic index to establish the ecology quality of soft bottom benthos within European estuarine coastal environments. Mar. Pollut. Bull., v. 40, n. 12, p. 1100-1114, 2000.
BORJA, A.; MUXIKA, I. Do benthic indicator tools respond to all impact sources? The case of AMBI (Azti Marine Biotic Index). Proceedings of the Workshop ‘‘Indicators of Stress in the Marine Benthos’’. Torregrande-Oristano: Italy, 2005. p. 14-17.
BOROS, E.; NAGY, T.; PIGNICZKI, C.; KOTYMÁN, L.; BALOGH, K. V.; VÖRÖS, L. The Effect Of Aquatic Birds On The Nutrient Load And Water Quality Of Soda Pans In Hungary. Acta. Zool. Academ. Sci. Hung., v. 54, Suppl 1, p. 207-224, 2008.
CAI, L.; TAM, N. F. Y.; WONG, T. W. Y.; MA, L.; YANG, G.; WONG, Y. S. Using benthic macrofauna to assess environmental quality of four intertidal mudlats in Hong Kong and Shenzen coast. Acta Ecol. Sin., v. 22, n. 22, p. 309-319, 2003.
CALLIER, M. D.; RICHARD, M.; MCKINDSEY, C. W.; ARCHAMBAULT, P.; DESROSIERS, G. Responses of benthic macrofauna and biogeochemical luxes to various levels of mussel biodeposition: an in situ “benthocosm” experiment. Mar. Pollut. Bull., v. 58, n. 10, p. 1544-1553, 2009.
CARDOSO, I.; CANCELA DA FONSECA, L.; CABRAL, H. N. Ecological quality assessment of small estuaries from the Portuguese coast based on benthic macroinvertebrate assemblages indices. Mar. Pollut. Bull., v. 64, n. 6, p. 1136-1142, 2012.
CARVALHO, S.; BARATA, M.; PEREIRA, F.; GASPAR, M. B.; CANCELA DA FONSECA, L.; POUSÃO-FERREIRA P. Distribution patterns of macrobenthic species in relation to organic enrichment within aquaculture earthen ponds. Mar. Pollut. Bull., v. 52, n. 12, p. 1573-1584, 2006.
CHAPMAN, P. M.; WANG, F. Y. Assessing sediment contamination in estuaries. Environ. Toxicol. Chem., v. 20, n. 1, p. 3-22, 2001.
CLESCERI, S. L.; GREENBERG, E. A.; TRUSSELL, R. R. Standard Methods for the Examination of Water and Wastewater. Washington: American Public Health Association, 1989.
DAUVIN, J. C.; BACHELET, G.; BARILLÉ, A. L.; BLANCHET, H.; DE MONTAUDOUIN, X.; LAVESQUE, N.; RUELLET, T. Development of benthic indicators and index approaches in the three main estuaries along the French Atlantic coast (Seine, Loire and Gironde). Mar. Ecol., v. 30, n. 2, p. 228-240, 2009.
DAUVIN, J. C.; RUELLET, T. Polychaete/amphipod ratio revisited. Mar. Pollut. Bull., v. 55, n. 1/6, p. 215-224, 2007. ECONOMIC COMMISSION FOR EUROPE. Second Assessment
of Transboundary Rivers, lakes and groundwaters. Geneva: United Nations, 2011.
FLEMING, R.; FRASER, H. The Impact of Waterfowl on Water Quality. Literature Review. Ontario: Ridgetown College, University of Guelph, 2001.
GANDOMI, Y.; SHADI, A.; SAVARI, A. Classiication of gomishan lagoon (caspian sea, iran) by using the coastal and marine ecological classiication standard (CMECS). Middle-East J. Sci. Res., v. 8, n. 3, p. 611-615, 2011.
GETA, R.; POSTOLACHE, C.; VĂDINEANU, A. Ecological signiicance of nitrogen cycling by tubiicid communities in shallow eutrophic lakes of the Danube Delta. Hydrobiologia, v. 524, n. 1, p. 193-202, 2004.
GOLTERMAN, H. L. The Chemistry of Phosphate and Nitrogen Compounds in Sediments. Dordrecht: Kluwer Academic Publisher, 2004.
GRAVINA, M. F.; ARDIZZONE, G. D.; SCALETTA, F.; CHIMENZ, C. descriptive analysis and classiication of benthic communities in some mediterranean coastal lagoons
(Central Italy). Pubbl. Staz. Zool. Napoli (I: Mar. Ecol.)., v. 10, n. 2, p. 141-166, 1989.
GRÉMARE, A.; LABRUNE, C.; VANDEN BERGHE, E.; AMOUROUX, J. M.; BACHELET, G.; ZETTLER, M. L.; VANAVERBEKE, J.; FLEISCHER, D.; BIGOT, L.; MAIRE, O.; DEFLANDRE, B.; CRAEYMEER-SCH, J.; DEGRAER, S.; DOUNAS, C.; DUINEVELD, G.; HEIP, C.; HERRMANN, M.; HUMMEL, H.; KARAKASSIS, I.; KEDRA, M.; KENDALL, M.; KINGSTON, P.; LAUDIEN, J.; OCCHIPINTI-AMBROGI, A.; RACHOR, E.; SARDÁ, R.; SPEYBROECK, J.; VAN HOEY, G.; VINCX, M.; WHOMERSLEY, P.; WILLEMS, W.; WLODARSKA-KOWALCZUK, M.; ZENETOS, A. Comparison of the performances of two biotic indices based on the MacroBen database. Mar. Ecol. Prog. Ser., v. 382, p. 297-311, 2009. HOLMER, M.; WILDUSH, D.; HARGRAVE, B. T. Organic
enrichment from marine inish aquaculture and effects on sediment biogeochemical processes. In: Hargrave, B.T. (Ed.). Environmental Effects of Marine Finish Aquaculture. The Handbook of Environmental Chemistry. Heidelberg: Springer, 2005. 467 p.
HYLAND, J.; BALTHIS, L.; KARAKASSIS, I.; MAGNI, P.; PETROV, A.; SHINE, J.; VESTERGAARD, O.; WARWICK, R. Organic carbon content of sediments as an indicator of stress in the marine benthos. Mar. Ecol. Prog. Ser., v. 295, p. 91-103, 2005.
INGOLE, B.; SIVADAS, S.; GOLTEKAR, R.; CLEMENTE, S.; NANAJKAR, M.; SAWANT, R.; D’SILVA, C.; SARKAR, A.; ANSARI, Z. Ecotoxicological effect of grounded MV River Princess on the intertidal benthic organisms off Goa. Environ. Int., v. 32, n. 2, p. 284-291, 2006.
IZZO, G.; SIGNORINI, A.; MASSINI, G.; ALLEGRO, A.; TOSONI, M.; VARRONE, C.; MIGLIORE, G.; SBRANA, M.; MORGANA, G.; PRATO, S.; PROCACCI, S.; LA VALLE, P.; NICOLETTI, L. L’uso dei sedimenti per la valutazione della qualita` delle acque di transizione: correlazione tra test isici, chimici e biologici. In: Apat (Ed.). Metodologie per il rilevamento e la classiicazione dello stato di qualita` ecologico e chimico delle acque con part icolare riferimento all’applicazione del decreto legislativo. Roma: Istituto Superiore per la Protezione e la Ricerca Ambientale, 2005. p. 345-377.
JAFARI, N. Review of pollution sources and controls in Caspian Sea region. J. Ecol. Nat. Environ., v. 2, n. 2, p. 25-29, 2010. JOSEFSON, A. B.; BLOMQVIST, M.; HANSEN, J. L. S.;
ROSENBERG, R.; RYGG, B. Assessment of marine benthic quality change in gradients of disturbance: comparison of different Scandinavian multi-metric indices. Mar. Pollut. Bull., v. 58, n. 9, p. 1263-1277, 2009.
KRÖNCKE, I.; REISS, H. Inluence of macrofauna long-term natural variability on benthic indices used in ecological quality assessment. Mar. Pollut. Bull., v. 60, n. 1, p. 58-68, 2010.
LABRUNE, C.; AMOUROUX, J. M.; SARDA, R.; DUTRIEUX, E.; THORIN, S.; ROSENBERG, R.; GRÉMARE, A. Characterization of the ecological quality of the coastal Gulf of Lions (NW Mediterranean). A comparative approach based on three biotic indices. Mar. Pollut. Bull., v. 52, n. 1, p. 34-47, 2006.
MAGURRAN, A. E. Diversidad ecológica y su medición. Barcelona: Ediciones Vedrá, 1989.
MASSART, D. L.; KAUFMAN, L. The Interpretation of Analytical Chemical Data by the Use of Cluster Analysis. New York: Wiley, 1983.
MCELROY, R.; MEERES, V.; PICKETT, L. Development of a Water and Sediment Sampling & Monitoring Program for the Esquimalt Lagoon. Victoria: Royal Roads University, 2002. MORRISEY, D. J.; HOWITT, L.; UNDERWOOD, A. J.; STARK,
J. S. Spatial variation in soft sediment benthos. Mar. Ecol. Prog. Ser., v. 81, p. 197-204, 1992.
MUNIZ, P.; HUTTON, M.; KANDRATAVICIUS, N.; LANFRANCONI, A.; BRUGNOLI, E.; VENTURINI, N.; GIMÉNEZ, L. Performance of biotic indices in naturally stressed estuarine environments on the Southwestern Atlantic coast (Uruguay): A multiple scale approach. Ecol. Indic., v. 19, p. 89-97, 2012.
MUNIZ, P.; VENTURINI, N.; HUTTON, M.; KANDRATAVICIUS, N.; PITA, A.; BRUGNOLI, E.; BURONE, L.; GARCÍA-RODRÍGUEZ, F. Ecosystem health of Montevideo coastal zone: A multi approach using some different benthic indicators to improve a ten-year-ago assessment. J. Sea. Res., v. 65, p. 38-50, 2011.
MUNIZ, P.; VENTURINI, N.; PIRES-VANIN, A. M. S.; TOMMASI, L. R.; BORJA, A. Testing the applicability of a Marine Biotic Index (AMBI) to assessing the ecological quality of soft-bottom benthic communities, in the South America Atlantic region. Mar. Pollut. Bull., v. 50, n. 6, p. 624-637, 2005.
MUXIKA, I.; BORJA, A.; BALD, J. Using historical data, expert judgement and multivariate analysis in assessing reference conditions and benthic ecological status, according to the European Water Framework Directive. Mar. Pollut. Bull., v. 55, n. 1/6, p. 16-29, 2007.
MUXIKA, I.; BORJA, A.; BONNE, W. The suitability of the marine biotic index (AMBI) to new impact sources along European coasts. Ecol. Indic., v. 5, n.1, p. 19-31, 2005. NEVILLE, R. Environmental Protection in the Caspian Sea:
Policy Constraints and Prescription. International Institute for Caspian Studies. 2006. Available at: < http://www. caspianstudies.com/article/Rachel%20Nevil.htm >. PANIGRAHY, P. K.; DAS, J.; DAS, S. N.; SAHOO, R. K.
Evaluation of the Inluence of various physicochemical parameters on coastal water quality, around Orissa, by factor analysis. Indian. J. Mar. Sci., v. 28, p. 360-364, 1999. PEARSON, T. H.; ROSENBERG, R. Macrobenthic succession
in relation to organic enrichment and pollution of the marine environment. Oceanogr. Mar. Biol., v. 16, p. 229-311, 1978. PINTO, R.; PATRÍCIO, J.; BAETA, A.; FATH, B. D.; NETO, J.
M.; MARQUES, J. C. Review of estuarine biotic indices to assess benthic condition. Ecol. Indic., v. 9, n. 1, p. 1-25, 2009. PRASANNA, M. B.; RANJAN, B. C. Physico chemical
properties of water collected from Dhamra. Int. J. Environ Sci., v. 1, n. 3, p. 334-342, 2010.
PRATO, S.; MORGANA, J. G.; LA VALLE, P.; FINOIA, M. G.; LATTANZI, L.; NICOLETTI, L.; ARDIZZONE, G. D.; LZZO, G. Application of biotic and taxonomic distinctness indices in assessing the ecological quality status of two coastal lakes: Gaprolace and Foglino Lakes (Central Italy). Ecol. Indic., v. 9, p. 568-583, 2009.
RANASINGHE, J. A.; WEISBERG, S. B.; SMITH, R. W.; MONTAGNE, D. E.; THOMPSON, B.; OAKDEN, J. M.; HUFF, D. D.; CADIEN, D. B.; VELARDE, R. G.; RITTER, K. J. Calibration and evaluation of ive indicators of benthic community condition in two California bay and estuary habitats. Mar. Pollut. Bull., v. 59, n. 1/3, p. 5-13, 2009. REIZOPOULOU, S.; NICOLAIDOU, A. Index of size
distribution (ISD): a method of quality assessment for coastal lagoons. Hydrobiologia, v. 577, n. 1, p. 141-149, 2007. RIAZI, B. Information Sheet on Ramsar Wetlands (RIS). Ramsar
Convention Secretariat, 2001. 8 p.
ROSENBERG, R.; BLOMQVIST, M.; NILSSON, H. C.; CEDERWALL, H.; DIMMING, A. Marine quality assessment by use of benthic species-abundance distributions: a proposed new protocol within the European Union Water Framework Directive. Mar. Pollut. Bull., v. 49, n. 9/10, p. 728-739, 2004. SALAS, F.; MARCOS, C.; NETO, J. M.; PATRÍCIO, J.; PÉRES-RUZAF, A.; MARQUES, J. C. User-friendly guide for using benthic ecological indicators in coastal a marine quality assessment. Ocean Coast. Manag., v. 49, n. 5/6, p. 308-331, 2006.
SCOTT, D. A. Important Bird Areas factsheet: Gomishan marshes and Turkoman steppes. 2013. Available at: < http://www. birdlife.org/datazone/sitefactsheet.php?id=8086 >.
SERHAT, A.; HUSAMETTIN, B.; ARGYRO, Z.; KURUN, A.; KUBANC, C. Ecological quality status of coastal benthic ecosystems in the Sea of Marmara. Mar. Pollut. Bull., v. 52, n. 7, p. 790-799, 2006.
SHIRODKAR, P. V.; PRADHAN, U. K.; VETHAMONY, P. Impact of Water Quality Changes on Harbour Environment Due to Port Activities along the West Coast of India. Second International Conference on Coastal Zone Engineering and Management (Arabian Coast 2010). Muscat: Oman; 2010. SIMBOURA, N. Bentix index vs Biotic Index in monitoring: an
answer to Borja et al., 2003. Mar. Pollut. Bull., v. 48, n. 3/4, p. 403-404, 2004.
SIMBOURA, N.; PANAYOTIDIS, P.; PAPATHANASSIOU, E. A synthesis of the Biological Quality Elements for the implementation of the European Water Framework Directive in the Mediterranean Ecoregion: the case of Saronikos Gulf. Ecol. Indic., v. 5, n. 3, p. 253-266, 2005.
SIMBOURA, N.; PAPATHANASSIOU, E.; SAKELLARIOU, D. The use of a biotic index (Bentix) in assessing long-term effects of dumping coarse metalliferous waste on soft bottom benthic communities. Ecol. Indic., v. 7, n. 1, p. 164-180, 2007. SIMBOURA, N.; REIZOPOULOU, S. A comparative approach
of assessing ecological status in two coastal areas of Eastern Mediterranean. Ecol. Indic., v. 7, n.2, p. 455-468, 2007. SIMBOURA, N.; ZENETOS, A. Benthic indicators to use in
ecological quality classiication of Mediterranean soft bottom marine ecosystems, including a new biotic index. Mediterr. Mar. Sci., v. 3, n. 2, p. 77-111, 2002.
SOLORZANO, L.; SHARP, J. H. Determination of total dissolved phosphorus and particulate phosphorus in natural waters. Limnol. Oceanogr., v. 25, n. 4, p. 754-758, 1980.
TAPIA GONZÁLEZ, F. U.; HERRERA-SILVEIRA, J. A.; AGUIRRE-MACEDO, M. L. Water quality variability and eutrophic trends in karstic tropical coastal lagoons of the Yucatán Peninsula. Estuar. Coast. Shelf Sci., v. 76, n. 2, p. 418-430, 2008.
TATARANNI, M.; LARDICCI, C. Performance of some biotic indices in the real variable world: a case study at different spatial scales in North-Western Mediterranean Sea. Environ. Pollut., v. 158, n. 1, p. 26-34, 2010.
TUEROS, I.; BORJA, A.; LARRETA, J.; RODRÍGUEZ, J. G.; VALENCIA, V.; MILLÁN, E. Integrating long-term water and sediment pollution data, in assessing chemical status within the European Water Framework Directive. Mar. Pollut. Bull., v. 58, n. 9, p. 1389-1400, 2009.
UPADHYAY, S. Physico-chemical characteristics of Mahanadi estuarine ecosystem, East coast of India. Indian J. Mar. Sci., v. 17, p. 19-23, 1988.
VINCENT, C.; HEINRICH, H.; EDWARDS, A.; NYGAARD, K.; HAYTHORNTHWAITE, J. Guidance on typology, classiication and reference conditions for transitional and coastal waters. Commission Européenne, 2002. 119 p.
WALKLEY, A.; BLACK, I. A. An examination of the Degtjareff method for determining soil organic matter, and a proposed modiication of the chromic acid titration method. Soil. Sci., v. 37, p. 29-38, 1934.
WILLET, P. Similarity and Clustering in Chemical Information Systems. New York: Research Studies Press, 1987.
WILSON, J. G.; JEFFREY, D. W. Benthic biological pollution indices in estuaries. In: Kramer, K. J. M. (Ed). Biomonitoring of Coastal Waters and Estuaries. Baton Rouge: CRC Press, 1994. p. 311-327.
YSEBAERT, T.; HERMAN, P. M. J. Spatial and temporal variation in benthic macrofauna and relationships with environmental variables in an estuarine, intertidal soft-sediment environment. Mar. Ecol. Prog. Ser., v. 244, p. 105-124, 2002.
ZENETOS, A.; CHADJIANESTIS, I.; LANTZOUNI, M.; SIMBOURA, M.; SKLIVAGOU, E.; ARVANITAKIS, G. The Eurobulker oil spill: mid-term changes of some ecosystem indicators. Mar. Pollut. Bull., v. 48, n. 1/2, p. 122-131, 2004. ZETTLER, M. L.; SCHIEDEK, D.; BOBERTZ, B. Benthic