A
rti
g
o
*e-mail: [email protected]
COMBINED EXPERIMENTAL POWDER X-RAY DIFFRACTION AND DFT DATA TO OBTAIN THE LOWEST ENERGY MOLECULAR CONFORMATION OF FRIEDELIN
Djalma Menezes de Oliveira, Wagner da Nova Mussel, Lucienir Pains Duarte, Grácia Divina de Fátima Silva, Hélio Anderson Duarte e Elionai Cassiana de Lima Gomes
Departamento de Química, Instituto de Ciências Exatas, Universidade Federal de Minas Gerais, Av. Antônio Carlos, 6627, 31270-901 Belo Horizonte – MG, Brasil
Luciana Guimarães
Departamento de Ciências Naturais, Universidade Federal de São João Del-Rei, Praça Dom Helvécio, 74, 36301-160 São João Del Rei – MG, Brasil
Sidney A. Vieira Filho*
Departamento de Farmácia, Escola de Farmácia, Universidade Federal de Ouro Preto, Rua Costa Sena, 171, 35400-000 Ouro Preto – MG, Brasil
Recebido em 4/1/12; aceito em 9/7/12; publicado na web em 5/10/12
Friedelin molecular conformers were obtained by Density Functional Theory (DFT) and by ab initio structure determination from powder X-ray diffraction. Their conformers with the five rings in chair-chair-chair-boat-boat, and with all rings in chair, are energy degenerated in gas-phase according to DFT results. The powder diffraction data reveals that rings A, B and C of friedelin are in chair, and rings D and E in boat-boat, conformation. The high correlation values among powder diffraction data, DFT and reported single-crystal data indicate that the use of conventional X-ray diffractometer can be applied in routine laboratory analysis in the absence of a single-crystal diffractometer.
Keywords:powder X-ray diffraction; conformational study; friedelin.
INTRODUCTION
Establishing the stereochemistry of organic compounds often represents a challenge for organic chemistry researchers. NMR experiments have been used as an adequate instrument commonly applied for the structural elucidation of compounds such as penta-cyclic triterpenes (PCTT). Based on 1D/2D NMR spectral data, the five-ring conformation of PCTT dissolved in deuterated solvent has been established. For pachisandiol, the chair-chair-chair-boat-boat (c-c-c-b-b) conformation was attributed to rings A, B, C, D and E, respectively1 and c-c-c-c-c-c2 for 16α-hydroxy-friedelin, both dis-solved in CDCl3. However, it is important to consider the interference of deuterated solvent and the temperature of the analysis in deter-mining the molecular conformation of the compound. This influence is more marked when polar deuterated solvent is used, due to hydrogen bonding and solvation processes.
Another alternative is the use of ab initio Hartree-Fock and den-sity functional theory (DTF) in the conformational studies of PCTT. In this case, the molecule is considered as being in a vacuum, in the absence of any influencing factors.
Single-crystal X-ray diffractometry is also commonly applied to determine the crystal structure of PCTT. A single, pure, stable and representative crystal, with sufficient size to have the overall intrinsic properties of a compound, is necessary for submission to single-crystal X-ray diffractometry for structure elucidation. This necessity becomes more complex for the structural elucidation of natural compounds, such as pentacyclic triterpenes (PCTT), isolated from plants in small amounts, which may not crystallize in this way with a well-defined crystal that represents the overall properties of the natural phase.3
Crystal structure determination by powder diffraction data (SDPD) has been widely and successfully applied for organic,
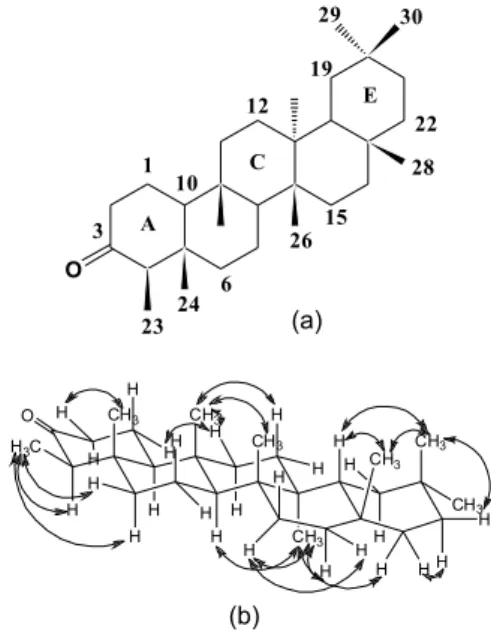
inorganic and organometallic molecules with low molecular mass.4 Furthermore, the SDPD procedure of an organic molecule is de-pendent on some factors related to its crystallinity, purity, size, low conformational energy, polymorphism and some additional chemical characteristics.5 It poses a challenge in phytochemistry studies. We present a procedure in which SDPD was applied in the study of friedo-olean-3-one (friedelin) structure (Figure 1a) using Rietveld structure determination combined with theoretical calculations by density functional theory (DFT)6,7 and additional NMR spectral data of the compound in CDCl3 solution.
This work reports a new approach for crystal structural deter-mination from powder diffraction of friedelin triterpene, associated with NMR spectral data obtained in CDCl3 solution and DFT. It is envisaged that the implementation and optimization of methods commonly found in ordinary laboratories can contribute toward elu-cidating structural problems of PCTT family compounds, as well as other simple organic molecules, without the need for single-crystal experiments. Previously reported data for a single-crystal of friedelin8 and NMR studies9 were used to validate our results.
EXPERIMENTAL
Plant material
A sample of Maytenus acanthophylla (Celastraceae) was collec-ted from the Planalto de Maracás, Maracás, Bahia, Brazil. A voucher specimen was deposited (Collection No. 27182) at the Herbarium of the Botanical Department of the Universidade Federal de Viçosa (UFV), Viçosa, Minas Gerais, Brazil.
Isolation of friedelin
In the course of the phytochemical study of Maytenus acantho-phylla (Celastraceae), a mixture of friedelin and 3β-friedelinol (2:8) was isolated from their leaves by powder static extraction using hexane as the solvent. These PCTTs were characterized by comparing their 13C NMR data with that previously published10. A sample (1.5 g) was further oxidized11 and recrystallized in CHCl
3-MeOH (8:2), yielding a white solid (1.22 g) of friedelin (C30H50O; melting point: 259.7-262.1 °C - Lit. 258.0-260.0 °C),12 with 98.5% purity grade as attested by CG analysis.
General procedures
The 1H and 13C NMR spectra were recorded on a Bruker spectrom-eter operating at 400.13 (1H) and 100.62 (13C) MHz at 300 K, with direct 5 mm detection dual probe 1H/13C (90° pulse width - PW - of 9.8 µs and 7.8 µs) for 1H and 13C, respectively. The sample (10 mg) was dissolved in CDCl3 (0.5 mL) and transferred to a 5.0 mm o.d. NMR tube. TMS was used as the internal standard (δH = δC = 0). NMR data manipulations were carried out on a Bruker Avance DRX-400 with SGI workstation software. Melting points were obtained on a Mettler FP 80 HT apparatus.
DFT calculations
Theoretical studies for ccccc and cccbb friedelin conformers were carried out using the Gaussian 03 program package.13 The geometry optimizations were performed using density functional theory (DFT) with the B3LYP functional7 employing the standard Pople’s split valence 6-31G(d,p) basis set.14,15 Geometries were characterized as true minima in the potential energy surface (PES) with all harmonic frequencies being real. The energy between the two conformers
(∆Gtotal) was calculated as the sum of two parts: electronic plus
nuclear repulsion energy (∆Eele) and thermal correction to the Gibbs
free energy (∆Gtherm). The thermal contribution in gas phase was
evaluated using the canonical formalism at 298 K.16 The calculated harmonic vibrational frequencies were used to estimate the correc-tions of zero point energy (ZPE) due to the thermal population of the vibrational levels. The initial geometry optimization of the friedelin molecule started with two conformational forms (cccbb and ccccc) expected for the D:A-friedooleananes17 and were carried out with the experimental geometrical parameters for 3α-friedelinol18 and methyl-3-oxofriedelan-20α-oate,19 respectively.
Friedelin sample was size-reduced to a very fine powder and deposited as a film suspension in a Zero Field Sample Holder (ZFSH) composed of polished SiC in a 3° angle mount to reduce background contributions to the X-ray diffraction experiment. The material was initially suspended in isopropyl alcohol and homogenously spread over the sample holder under spinning to prevent preferred orienta-tion and to minimize rugosity effects over the exposed surface, and was subsequently left to dry at room temperature.
The powder X-ray diffraction data were collected on a Siemens D5000 diffractometer under 40KV, 30mA, using Cu Kα (λ= 1.54056 Å) coupled with a graphite monochromator, scanned over an angular range of 4-40° (2θ) with a step size of 0.01° (2θ) and a time constant of 15 s step-1. The sample holder was submitted to a spinning speed of 60 cycles per minute to reduce any preferred orientation and to minimize rugosity effects. The final matrix was averaged over 3 independent scans.
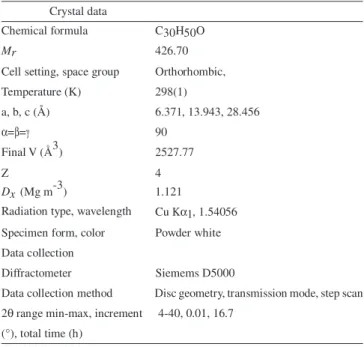
The crystal structure was determined by ab initio calculations. The powder indexing tool used for peak identification, indexing and automatic space group determination was DICVOL91.20 The peaks were searched and fitted with a Pseudo-Voigt peak profile, performing both modified Pawley and Rietveld refinement to optimize powder diffraction parameters and crystal structure so that the best possible agreement between simulated and experimental powder patterns was achieved. It crystallized in a P212121 space group with a = 6.371 Å, b = 13.943 Å, c = 28.456 Å, α=β=γ=90°, Z = 4, Rwp = 0.1153%, Rp = 0.0638%.
Initially the pattern was processed for background contribution; peaks were searched and manually inspected when necessary to prevent background fluctuations from being considered reflections. The molecule was sketched using ChemSketch® (ACD-LabsV.12.0 for Microsoft Windows®, 2009),21 the hydrogen atoms were intro-duced based on the NMR spectra and the molecule allowed to have its energy minimized by the Monte Carlo method before using it as a model. The crystal structure solution was first obtained without any preferred orientation correction and close-contact penalty. The results were compared with the fit using Marck-Dollese preferred orienta-tion and close-contact penalty algorithm. The result that combined the lowest final energy obtained by Monte-Carlo optimization was used as the solution. Details of refinements and experimental data of X-ray diffraction are summarized in Table 1.
Table 1. Experimental details of X-ray diffraction
Crystal data
Chemical formula C30H50O
Mr 426.70
Cell setting, space group Orthorhombic, Temperature (K) 298(1)
a, b, c (Å) 6.371, 13.943, 28.456
α=β=γ 90
Final V (Å3) 2527.77
Z 4
Dx (Mg m-3) 1.121
Radiation type, wavelength Cu Kα1, 1.54056 Specimen form, color Powder white Data collection
Diffractometer Siemems D5000
Data collection method Disc geometry, transmission mode, step scan 2θ range min-max, increment 4-40, 0.01, 16.7
RESULTS AND DISCUSSION
NMR spectral data
The chemical shifts of 1H and 13C and the correlation data (Table 2) obtained from COSY and NOESY contour maps indicated confor-mation cccbb (Figure 1b) for friedelin in CDCl3. The COSY contour map revealed the absence of correlations between vicinal hydrogen at δΗ 1.28, m (Hα−15) and at δΗ 1.58, m (Hβ-16, ring D) as well as between the signal at Hβ-18 (δΗ 1.57, dd, J = 5.0, 12.0 Hz) and Hβ-19 (δΗ 1.38, m, ring E). Conversely, correlations of Hβ-18 and Hα-19 (δΗ 1.21, m, ring E) were observed. The correlations observed in the NOESY contour map of β−equatorial methyl-23, δΗ 0.88 (d, J = 6.8 Hz) with the signal of Hβ-6 (1.76, dt, J = 2.5, 5.0 Hz), as
well as between Hα−1 (δΗ 1.97, tdd, 2.5, 7.0, 13.0 Hz) and Hβ−11 (δΗ 1.48, m) (Table 2) provided confirmation of the chair-chair-chair conformation of rings A, B and C (Figure 1b). The intercrossed NOE correlations between the signal of Hα−15 (δΗ 1.28, m) and Hβ-16 (δΗ 1.58, m) and the signals of Hβ-15 (δΗ 1.50, m) and Hα−16 (δΗ 1.35, m) indicated that Hα−16 is at the bottom of ring D. The conforma-tion of ring E was confirmed based on the correlaconforma-tions of methylene hydrogen H-19 δΗ 1.21, (m, Hα-19) and δΗ 1.38, (m, Hβ-19) with the signal of methyl hydrogen Hα -29 at δΗ 0.95, and the signals of Hβ-18 (δΗ 1.57, dd, J = 5.0, 12.0 Hz) and Hβ-21 (δΗ 1.30, m) with Hβ-30 at δΗ 1.01. Based on the NMR data (Table 2), it was established that friedelin in CDCl3 solution acquires preferential conformation cccbb (Figure 1b).
It is possible to apply these procedures to similar PCTTs in an
Table 2. 1D/2D NMR spectral data of friedelin
1H and 13C NMR, DEPT-135 and HSQC data
COSY NOESY
C type δC δH [m, J (Hz)]
C-5 42.16 C-9 37.47 C-13 39.72 C-14 38.32 C-17 30.01 C-20 28.18 O=C-3 213.22
HC-4 58.25 Hα-4: 2.25 (q, 6.8) Meβ-23 Hα-10, Meβ-23
HC-8 53.13 Hα-8: 1.40 (m) Hβ-7 Hα-10, Meα-27
HC-10 59.51 Hα-10: 1.53 (dd, J = 2.5, 12.5) Hα-1, Hβ-1 Hα-1, Hα-4, Hα-8 HC-18 42.82 Hβ-18: 1.57 (d, J = 5.0) Hα-19 Hβ-21, Meβ-28, Meβ-30 H2C-1 22.30 Hα-1: 1.97 (tdd, 2.5, 7.0, 13.0)
Hβ-1: 1.68 (dd, 5.0, 13.0 )
Hβ-1, Hα-2, Hβ-2, Hα-10 Hα-1, Hα-2, Hα-10
Hβ-1, Hα-2, Hβ-2, Hα-10, Hβ-11 Hα-1
H2C-2 41.54 Hα-2: 2.31 (dd, 7.0, 13.0)
Hβ-2: 2.39 (dd, 2.5, 5.0)
Hα-1, Hβ-1, Hβ-2 Hβ-1, Hα-2
Hα-1, Hβ-2 Hα-1, Hα-2 H2C-6 41.32 Hα-6: 1.28
Hβ-6: 1.76 (dt, J = 2.5, 5.0)
Hβ-6, Hβ-7 Hα-6
Hα-4, Hβ-6, Meβ-23 Hα-6, Hα-7, Hβ-7, Meβ-23, Meβ-24 H2C-7 18.25 Hα-7: 1.40 (m)
Hβ-7: 1.50 (m)
Hβ-7 Hα-7, Hα-8
Hβ-6, Hβ-7 Hβ-6, Hα-7, Meβ-24 H2C-11 35.65 a Hα-11: 1.26 (m)
Hβ-11: 1.48 (m)
Hβ-11, Hβ-12 Hα-11,
Hα-8, Hβ-11, Meα-27 Hα−1, Hβ−11, Hβ-12, Meβ-25 H2C-12 30.52 Hα-12: 1.19(m)
Hβ-12: 1.35 (m)
Hβ-12 Hα-12, Hα-11
Meα-27 Hβ-11, Meβ-25 H2C-15 32.44a Hα-15: 1.28 (m)
Hβ-15: 1.50 (m)
Hβ-15 Hα-15
Hβ-15, Hβ-16, Hα-22, Meα-27 Hα-15, Hα-16, Meβ-28 H2C-16 36.03 Hα-16: 1.36 (m)
Hβ-16: 1.58 (m)
Hβ-16 Hα-16
Hβ-15, Hα-15, H2C-19 35.36a Hα-19: 1.21 (m)
Hβ-19: 1.38 (m)
Hβ-19, Hβ-18, Meβ-30 Hα-19
Hβ-19, Meα-27, Meα-29 Hα-19, Meα-29 H2C-21 32.78a Hα-21: 1.53 (m)
Hβ-21: 1.30 (m)
Hβ-21, Hβ-22 Hα-21
Hβ-21, Hα-22, Meα-27 Hα-21, Hβ-18, Hα-22, Meβ-28, Meβ-30 H2C-22 39.27 Hα-22: 0.94 (m)
Hβ-22: 1.51 (m)
Hβ-22 Hα-22, Hα-21
Hβ-22, Hα-21, Hβ-21, Meα-27 Hα-22, Meβ-28 H3C-23 6.83 Meβ-23: 0.88 (d, J = 6.8 ) Hα-4 Hβ-1, Hα-4, Hα-6, Hβ-6, Meβ-24
H3C-24 14.67 Meβ-24: 0.73 (s) Hβ-7, Meβ-23, Meβ-25
H3C-25 17.96 Meβ-25: 0.87 (s) Hβ-11, Hβ-12, Meβ-24, Meβ-26
H3C-26 20.28 Meβ-26: 1.00 (s) Hβ-7, Hβ-25, Meβ-28
H3C-27 18.67 Meα-27: 1.05 (s) Hα-8, Hα-12, Hα-15, Hα-16, Hα-19, Hα-22, Meβ-29
H3C-28 32.10 Meβ-28: 1.18 (s) Hβ-15, Hβ-18, Hβ-21, Hβ-22, Meβ-26, Meβ-30
H3C-29 35.03 Meα-29: 0.95 (s) Hα-19, Hβ-19, Meα-27
H3C-30 31.79 Meβ-30: 1.01(s) Hβ-18, Hβ-21, Meβ-28
a interchangeable signals. * 1H (CDCl
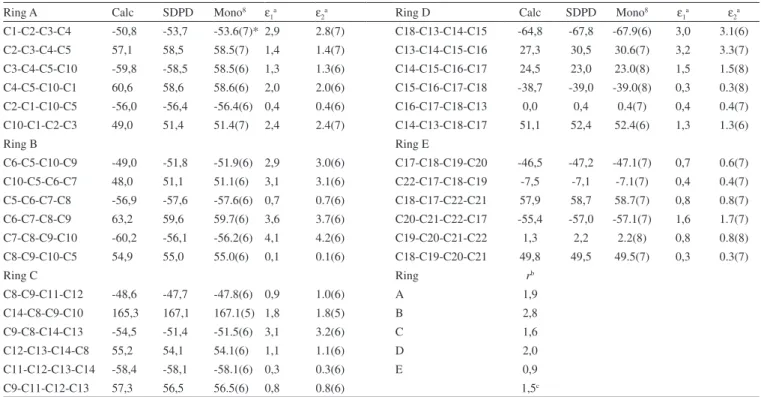
Table 3. Comparison of torsion angles (o) as observed (Obs) in powder diffraction experiment with calculated (Calc) by DFT for friedelin structure. The mono
data were extracted from Table 1 in ref 23. The observed differences are shown for each set of carbon connection Ring A Calc SDPD Mono8 ε
1a ε2a Ring D Calc SDPD Mono8 ε1a ε2a
C1-C2-C3-C4 -50,8 -53,7 -53.6(7)* 2,9 2.8(7) C18-C13-C14-C15 -64,8 -67,8 -67.9(6) 3,0 3.1(6) C2-C3-C4-C5 57,1 58,5 58.5(7) 1,4 1.4(7) C13-C14-C15-C16 27,3 30,5 30.6(7) 3,2 3.3(7) C3-C4-C5-C10 -59,8 -58,5 58.5(6) 1,3 1.3(6) C14-C15-C16-C17 24,5 23,0 23.0(8) 1,5 1.5(8) C4-C5-C10-C1 60,6 58,6 58.6(6) 2,0 2.0(6) C15-C16-C17-C18 -38,7 -39,0 -39.0(8) 0,3 0.3(8) C2-C1-C10-C5 -56,0 -56,4 -56.4(6) 0,4 0.4(6) C16-C17-C18-C13 0,0 0,4 0.4(7) 0,4 0.4(7) C10-C1-C2-C3 49,0 51,4 51.4(7) 2,4 2.4(7) C14-C13-C18-C17 51,1 52,4 52.4(6) 1,3 1.3(6)
Ring B Ring E
C6-C5-C10-C9 -49,0 -51,8 -51.9(6) 2,9 3.0(6) C17-C18-C19-C20 -46,5 -47,2 -47.1(7) 0,7 0.6(7) C10-C5-C6-C7 48,0 51,1 51.1(6) 3,1 3.1(6) C22-C17-C18-C19 -7,5 -7,1 -7.1(7) 0,4 0.4(7) C5-C6-C7-C8 -56,9 -57,6 -57.6(6) 0,7 0.7(6) C18-C17-C22-C21 57,9 58,7 58.7(7) 0,8 0.8(7) C6-C7-C8-C9 63,2 59,6 59.7(6) 3,6 3.7(6) C20-C21-C22-C17 -55,4 -57,0 -57.1(7) 1,6 1.7(7) C7-C8-C9-C10 -60,2 -56,1 -56.2(6) 4,1 4.2(6) C19-C20-C21-C22 1,3 2,2 2.2(8) 0,8 0.8(8) C8-C9-C10-C5 54,9 55,0 55.0(6) 0,1 0.1(6) C18-C19-C20-C21 49,8 49,5 49.5(7) 0,3 0.3(7)
Ring C Ring rb
C8-C9-C11-C12 -48,6 -47,7 -47.8(6) 0,9 1.0(6) A 1,9 C14-C8-C9-C10 165,3 167,1 167.1(5) 1,8 1.8(5) B 2,8 C9-C8-C14-C13 -54,5 -51,4 -51.5(6) 3,1 3.2(6) C 1,6 C12-C13-C14-C8 55,2 54,1 54.1(6) 1,1 1.1(6) D 2,0 C11-C12-C13-C14 -58,4 -58,1 -58.1(6) 0,3 0.3(6) E 0,9 C9-C11-C12-C13 57,3 56,5 56.5(6) 0,8 0.8(6) 1,5c (a) ε
1 = |calc-SDPD|; ε2 = |calc-MC|; (b) n= 6; (c) n = 5
* Parenthesized figures represent the estimated standard deviation (esd) in terms of least units cited for the value to the immediate left.
Figure 3. An ORTEP3 view of friedelin. Displacement ellipsoids are draw at 50% probability level and H atoms shown as small spheres of arbitrary radii attempt to obtain the low energy conformation in solid state as shown
in our work.
The optimized structures of cccbb and ccccc conformers for the friedelin molecule are depicted in Figure 2. The ∆Gtotaldifference
be-tween cccbb and ccccc conformers is only 1.4 KJ mol-1, at B3LYP/6-31G(d,p) level of theory. An ORTEP322 view of friedelin is shown in Figure 3. This means that these species are energetically degenerated in gas-phase, in agreement with force field calculations presented by
Figure 2. DFT/B3LYP optimized structures of D:A-3-friedoolean-3-one (frie-delin): (a) low energy chair-chair-chair-boat-boat (cccbb) conformer and (b) high energy chair-chair-chair-chair-chair (ccccc) conformer
Mo et al..8 According to these calculations, the intermolecular forces related to crystal packing, solvation and solubility also determine the preferred conformer in crystalline state.
The calculated and observed values for endocyclic torsion angles for friedelin rings are given in Table 3. A significant agreement was attained where the largest r.m.s deviation between experimental and calculated torsion angles was 2.8° while an overall deviation of around 1.8° was verified. The correlation between experimental and calculated values was significantly higher (r2 = 0.9990), indicating that the crystallographic solution details of the molecular conforma-tion of friedelin were reproduced with excellent agreement by the DFT calculations.
Powder X-ray diffraction data of friedelin
Table 4. Atomic fractional coordinates (xexp, yexp, zexp) and related isotropic displacement Uiso (Å2). The atomic fractional coordinates (xmono, ymono, zmono) and
Uisomono were extracted from Table 1 in ref. 23
Atom Xexp Yexp Zexp Uiso* Xmono Ymono Zmono Uisomono
O(1) 0,0859 0,2123 0,5126 0,05000 0.0876 0.2133 0.5126 0.0415
C(1) 0,2208 0,2771 0,4003 0,05000 0.2206 0.2781 0.3997 0.0327
C(2) 0,0671 0,2970 0,4401 0,05000 0.0649 0.2969 0.4394 0.0383
C(3) 0,0466 0,2104 0,4702 0,05000 0.0485 0.2105 0.4709 0.0323
C(4) -0,0091 0,1184 0,4457 0,05000 -0.0107 0.1183 0.4453 0.0317
C(5) 0,1634 0,0964 0,4077 0,05000 0.1601 0.0960 0.4074 0.0290
C(6) 0,0918 0,0074 0,3786 0,05000 0.0928 0.0076 0.3788 0.0332
C(7) 0,2163 -0,0085 0,3340 0,05000 0.2179 -0.0078 0.3337 0.0338
C(8) 0,2059 0,0801 0,3018 0,05000 0.2041 0.0808 0.3017 0.0270
C(9) 0,2956 0,1711 0,3266 0,05000 0.3001 0.1704 0.3270 0.0263
C(10) 0,1703 0,1840 0,3727 0,05000 0.1691 0.1847 0.3732 0.0253
C(11) 0,2699 0,2577 0,2949 0,05000 0.2662 0.2580 0.2949 0.0315
C(12) 0,3415 0,2417 0,2443 0,05000 0.3411 0.2425 0.2443 0.0308
C(13) 0,2294 0,1559 0,2202 0,05000 0.2333 0.1570 0.2197 0.0260
C(14) 0,2713 0,0637 0,2496 0,05000 0.2714 0.0638 0.2496 0.0279
C(15) 0,1375 -0,0195 0,2278 0,05000 0.1392 -0.0194 0.2283 0.0368
C(16) 0,0992 -0,0124 0,1746 0,05000 0.0977 -0.0125 0.1746 0.0432
C(17) 0,2528 0,0472 0,1441 0,05000 0.2517 0.0471 0.1442 0.0355
C(18) 0,3258 0,1421 0,1695 0,05000 0.3261 0.1430 0.1693 0.0288
C(19) 0,2881 0,2319 0,1392 0,05000 0.2890 0.2322 0.1382 0.0360
C(20) 0,3632 0,2236 0,0862 0,05000 0.3648 0.2248 0.0870 0.0395
C(21) 0,2804 0,1314 0,0645 0,05000 0.2751 01319 0.0650 0.0527
C(22) 0,1390 0,0723 0,0987 0,05000 0.1387 0.0741 0.0980 0.0466
C(23) 0,6093 0,2258 0,0862 0,05000 -0.0548 0.0370 0.4800 0.0472
C(24) 0,2843 0,3121 0,0606 0,05000 0.3694 0.0752 0.4326 0.0384
C(25) 0,4410 -0,0177 0,1313 0,05000 0.5384 0.1648 0.3376 0.0371
C(26) 0,0008 0,1822 0,2172 0,05000 -0.0052 0.1819 0.2168 0.0339
C(27) 0,5049 0,0328 0,2480 0,05000 0.5050 0.0323 0.2484 0.0356
C(28) 0,5415 0,1628 0,3377 0,05000 0.4380 -0.0176 0.1306 0.0470
C(29) 0,3705 0,0751 0,4321 0,05000 0.2839 0.3126 0.0610 0.0583
C(30) -0,0579 0,0381 0,4813 0,05000 0.6067 0.2274 0.0858 0.0631
(*) Due to the reduced number of independent reflections for an usual powder diffraction, 284 in this work, the hydrogen (0.06000 Å2) carbon and oxygen (0.05000
Å2) displacements were based as reported elsewhere in literature.
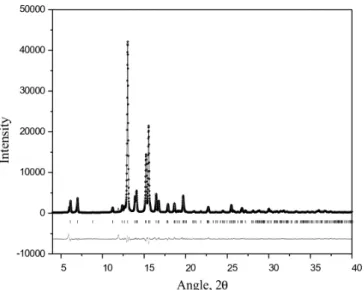
Figure 4. Final Rietveld refinement plot of friedelin. The observed data are shown by dots (.) and the calculated pattern represented by a solid line (-). The difference is plotted below; vertical bars indicate the Bragg reflection positions (|)
CONCLUSION
This study using SDPD revealed that the rings A, B and C of frie-delin adopt a chair conformation and that the cis-decalin D/E system has a boat-boat conformation. The success of this SDPD was based on the purity grade (> 98%) of friedelin. The correlations between SDPD and DFT calculations were significantly higher, indicating that the experimental crystallographic solution details of the molecular conformation of friedelin were reproduced with excellent agreement by the gas phase DFT calculations. It is important to point it out that the degenerated conformation was based on no solute-solvent interaction since it is obtained in gas phase. These interactions would be responsible for the final crystal conformation.
Based on the results found in this work, it can be concluded that Crystalline Powder X-ray Diffraction represents an adequate alternative for application in conformational studies of PCTT and other organic compounds.
ACKNOWLEDGMENTS
REFERENCES
1. Oliveira, D. M.; Silva, G. D. F.; Duarte, L. P.; Vieira Filho, S. A.; Gui-marães, L.; Duarte, H. A.; De Souza, E.; Struct. Chem.2009, 20, 1005. 2. Duarte, L. P.; Miranda, R. R. S.; Rodrigues, S. B. V.; Silva, G. D. F.;
Vieira Filho, S. A.; Knupp, V. F.; Molecules 2009, 14, 598.
3. Tedesco, E.; Turner, G. W.; Harris, K. D. M.; Johnston, R. I.; Kariuki, B. M.; Angew. Chem., Int. Ed.2000, 39, 4488.
4. David, W. I. F.; Shankland, K.; Mccusker, L. B.; Baerlocher, C. H.; Structure Determination from Powder Diffraction Data, Oxford Uni-versity Press Inc.: New York, 2002.
5. David, W. I. F.; Shankland, K.; Acta Crystallogr., Sect. A: Found. Crys-tallogr.2008, 64, 52.
6. Becke, A. D.; Phys. Rev. A: At., Mol., Opt. Phys. 1988, 38, 3098. 7. Becke, A. D.; J. Chem. Phys.1993, 98, 5648.
8. Mo, F.; Winther, S.; Scrimgeour, S. N.; Acta Crystallogr., Sect. B: Struct. Sci.1989, B45, 261.
9. Gottlieb, H. E.; Ramaiah, P. A.; Lavie, D.; Magn. Reson. Chem.1985, 23, 616.
10. Mahato, S. B.; Kundu, A. P.; Phytochemistry1994, 37, 1517. 11. Sen-Gupta, H. K.; Tucker, S. H.; J. Chem. Soc., Trans. 1922, 121, 557. 12. Chauham, S. M. S.; Singh, M.; Kumar, A.; Indian J. Chem., Sect. B:
Org. Chem. Incl. Med. Chem.2004, 43, 223.
13. Frisch, M. J.; Trucks, G. W.; Schlegel, H. B.; Scuseria, G. E.; Robb, M. A.; Cheeseman, J. R.; Montgomery Jr., J. A.; Vreven, T.; Kudin, K. N.; Burant, J. C.; Millam, J. M.; Iyengar, S. S.; Tomasi, J.; Barone, V.; Mennucci, B.; Cossi, M.; Scalmani, G.; Rega, N.; Petersson, G. A.; Nakatsuji, H.; Hada, M.; Ehara, M.; Toyota, K.; Fukuda, R.; Hasegawa, J.; Ishida, M.; Nakajima, T.; Honda, Y.; Kitao, O.; Nakai, H.; Klene, M.; Li, X.; Knox, J. E; Hratchian, H. P.; Cross, J. B.; Bakken, V.; Adamo, C.; Jaramillo, J.; Gomperts, R.; Stratmann, R. E.; Yazyev, O.; Austin, A.
J.; Cammi, R.; Pomelli, C.; Ochterski, J. W.; Ayala, P. Y.; Morokuma, K.; Voth, G. A.; Salvador, P.; Dannenberg, J. J.; Zakrzewski, V. G.; Dapprich, S.; Daniels, A. D.; Strain, M. C.; Farkas, O.; Malick, D. K.; Rabuck, A. D.; Raghavachari, K.; Foresman, J. B.; Ortiz, J. V.; Cui, Q.; Baboul, A. G.; Clifford, S.; Cioslowski, J.; Stefanov, B. B.; Liu, G.; Liashenko, A.; Piskorz, P.; Komaromi, I.; Martin, R. L.; Fox, D. J.; Keith, T.; Al-Laham, M. A.; Peng, C. Y.; Nanayakkara, A.; Challacombe, M.; Gill, P. M. W.; Johnson, B.; Chen, W.; Wong, M. W.; Gonzalez, C.; Pople, J. A.; Gaussian 03, Revision D.01; Gaussian, Inc., Wallingford CT, 2004.
14. Ditchfield, R.; Hehre, W. J.; Pople, J. A.; J. Chem. Phys.1971, 54, 724. 15. Hariharan, P. C.; Pople, J. A.; Mol. Phys.1974, 27, 209.
16. Mcquarrie, D. A.; Simon, J. D.; Molecular Thermodynamics, University Science Books: Sausalito, 1999.
17. Masaki, N.; Mineo, N.; Kikuchi, T.; J. Chem. Soc., Perkin Trans.1975, 2, 610.
18. Jiang, R. W.; Ma, S. C.; He, Z. D.; Huang, X. S.; But, P. P. H.; Wang, H.; Chan, S. P.; Ooi, V. E. C.; Xu, H. X.; Mak, T. C. W.; Bioorg. Med. Chem.2002, 10, 2161.
19. Cota, A. B.; Mascarenhas, Y. P.; Silva, G. D. F.; de Souza, J. R.; Acta Crystallogr., Sect. C: Cryst. Struct. Commun.1990, 46, 326.
20. Boultif, A.; Louër, D.; J. Appl. Crystallogr.1991, 24, 987.
21. Advanced Chemistry Development Inc.; ACD/Labs; Software for Ana-lytical and Chemical Knowledge Management, Chemical Nomenclature, and In-Silico PhysChem and ADME-Tox; Canada, 1994.
22. Burnett, M. N.; Johnson, C. K.; ORTEP-III: Oak Ridge Thermal El-lipsoid Plot Program for Crystal Structure Illustrations, Oak Ridge National Laboratory Report ORNL-6895: Tennessee, 1996.
23. Declercq, B. J. P.; Puryvelde, L. V.; De Kimp, N.; Nage, M.; Verhegge, G.; De Vierman, R.; Acta Crystallogr., Sect. C: Cryst. Struct. Commun.