Quim. Nova, Vol. 35, No. 10, 1912-1915, 2012
Artigo
*e-mail: [email protected]
PARTITION OF PROTEASES FROM Lentinus citrinus DPUA 1535 BY THE PEG/PHOSPHATE AQUEOUS TWO-PHASE SYSTEM
Larissa de Souza Kirsch*, Ana Carolina dos Santos Pinto e Maria Francisca Simas Teixeira
Departamento de Parasitologia, Universidade Federal do Amazonas, Av. Gal. Rodrigo Octávio Jordão Ramos, 3000, 69077-000 Manaus - AM, Brasil
Tatiana Souza Porto
Unidade Acadêmica de Garanhuns, Universidade Federal Rural de Pernambuco, Av. Bom Pastor, s/n, 55296-901 Garanhuns - PE, Brasil
Ana Lúcia Figueiredo Porto
Departamento de Morfologia e Fisiologia Animal, Universidade Federal Rural de Pernambuco, Av. Dom Manuel de Medeiros, s/n, 52171-900 Recife - PE, Brasil
Recebido em 1/11/11; aceito em 25/6/12; publicado na web em 18/9/12
A full two-levelfactorial design was employed to study the influence of PEG molar mass (MMPEG), PEG concentration (CPEG) and phosphate concentration (CPHOSPH) on proteases partition by Lentinus citrinus DPUA 1535 in a PEG/phosphate aqueous two-phase system (ATPS). For all ATPS studied, proteases partitioned for the top phase and the best proteases extraction condition was obtained with MMPEG = 6000 g mol
-1, C
PEG = 17.5% (w/w) and CPHOSPH = 25% (w/w) with (1.1) purification factor and (151%) activity yield. Findings reported here demonstrate a practical strategy that serves as a first step for proteases purification from crude extract by L. citrinus.
Keywords: Lentinus citrinus; proteases; aqueous two-phase systems.
INTRODUCTION
Proteases or peptidases are hydrolases that account for approxi-mately 60% of total worldwide sales of industrial enzymes. Proteases have applications in detergent formulation, beverage and food proces-sing, leather tenderization, waste-water treatment and medical formu-lations.1-4 These enzymes are commonly found in mushrooms, such as Agaricus bisporus, Armillaria mellea, Flammulina velutipes, Grifola frondosa, Pleurotus ostreatus, Lentinus edodes, Lyophyllum cine-rascens, Tricholoma saponaceum, Coprinus sp. and Irpex lacteus.5
Proteases purification usually involves traditional techniques, such as chromatography and ammonium sulphate precipitation. Alternatively, the aqueous two-phase system (ATPS) has been used to separate and purify several biological products from different sour-ces.6-8 Furthermore, some of the advantages of ATPS include lower production and operation expenses compared to other methods.9-11
ATPS are usually formed by mixing certain hydrophilic polymers or polymers and salts, where phase separation spontaneously occurs from the critical concentrations of such components.12,13 An important characteristic of these systems is their high water composition (65-90%), in mass, which guarantees maintenance of the biomolecule’s biological properties under non-denaturing conditions.14,15
The use of statistical designs are an important tool to understand the effects of the variables involved on proteases extraction, since it allows estimation of the main variables interfering significantly in the ATPS, indicates the interaction effects among variables and reduces the number of experiments required.16,17
In this research, a two-level factorial design was devised to study proteases partitionby Lentinus citrinus DPUA 1535 using a PEG/ phosphate aqueous two-phase system based on three experimental responses: partition coefficient, purification factor and activity yield.
EXPERIMENTAL
Chemicals
Azocasein, 550 and 8000 g mol-1 poly (ethylene glycol), were purchased from Sigma Chemical (St. Louis, MO, USA). 6000 g mol-1 poly (ethylene glycol), potassium dihydrogen phosphate (KH2PO4) and dipotassium phosphate (K2HPO4) were sourced from Vetec (Rio de Janeiro, Brazil). Bovine serum albumin (BSA) was obtained from Doles Reagentes (Goiás, Brazil). All other chemicals and reagents used were of analytical grade.
Organism, growth and proteases production
L. citrinus from the DPUA Culture Collection of the Universidade Federal do Amazonas was used in this study.
L. citrinus was cultured on potato dextrose agar (PDA) plates, with 0.5% (w/v) yeast extract, for 8 days. Subsequently, 8 mm diameter agar discs from culture growth on PDA were transferred to 125 mL Erlenmeyer flasks containing 30 mL of medium composed of (per li-ter): KH2PO4, 0.5 g; MgSO4.7H2O, 0.5 g; gelatin, 2.0 g; soluble starch, 5.0 g and 0.1 mL of mineral salt solution [5 mg de MnSO4, CuSO4, ZnSO4, Na2B4O7, Co(NO3)2].
18,19 The experiments were performed on a rotary shaker incubator (Certomat MO) at 150 rpm for 5 days. The crude extract was filtered through a polyethersulfone membrane (0.22 µm) and the supernatant was used to determine proteolytic activity. Proteolytic activity
Partition of proteases from Lentinus citrinus DPUA 1535 1913
Vol. 35, No. 10
(w/v) trichloroacetic acid solution and the remaining unhydrolyzed substrate was removed by centrifugation (8000 xg for 15 min). The colored supernatant was spectrophotometrically assayed at 440 nm. One unit of proteolytic enzyme was defined as the amount of enzyme that produces an increase in absorbance of 0.01 in 1 h at 440 nm.20 Effect of pH on proteolytic activity
The effect of pH on the proteolytic activity of L. citrinus ex-tract was determined. The pH ranged from 5.0 to 9.0, using 0.2 M Citrate-Phosphate (pH 5.0-6.0), 0.2 M Tris-HCl (7.0-8.0), and 0.2 M Carbonate-Bicarbonate (9.0) buffers. The samples were incubated for 1 h at 25 ºC and proteolytic activity then determined.
Preparation of aqueous two-phase systems
The PEG/phosphate systems were prepared for a final mass of 6 g, by mixing appropriate amounts of equimolar solutions of (50% w/w) PEG, (40% w/w) phosphate solution [potassium dihydrogen phosphate (KH2PO4) and dipotassium phosphate (K2HPO4)], at pH 7.0, deionized water, in 15 mL graduated Falcon tubes. The crude extract (0.5 mL) was added to the systems, homogenized in a vortex for 1 min, and the mixture separated by decantation for 1 h. The two phases (top and bottom) were separately withdrawn with pipettes and assayed for protein concentration and proteolytic activity.21 Experimental design and statistical analysis
The influence of the factors PEG concentration (CPEG), phosphate concentration (CPHOSPH), and PEG molar mass (MMPEG) on the partition coefficient (K), purification factor (PF) and yield (Y), was evaluated according to a 23 full factorial design with 3 repetitions in the central point, as shown in Table 1.22
All statistical and graphical analyses were carried out using the software Statistica 8.0 (StatSoft, Inc., Tulsa, OK, USA).23
Protein determination
The total protein concentration was determined according to the method described by Bradford,24 using bovine serum albumin as the standard protein.
Determination of partition coefficient, purification factor and yield
The partition coefficient was determined as the ratio of the pro-tease activity values (in units mL-1) in the top phase (A
t) to those in the bottom phase (Ab), respectively.
The purification factor (PF) was calculated as the ratio of specific activity in the top phase to the specific activity in the crude extract
where Ai is the enzyme activity in the initial extract while Ct and Ci are protein concentrations (µg mL
-1) in the top phase and initial extract, respectively.
The activity yield was determined by the ratio between the total activity in the top phase and in the initial extract.
where Vt and Vi are the volumes in the top phase and the initial extract, respectively.
RESULTS AND DISCUSSION
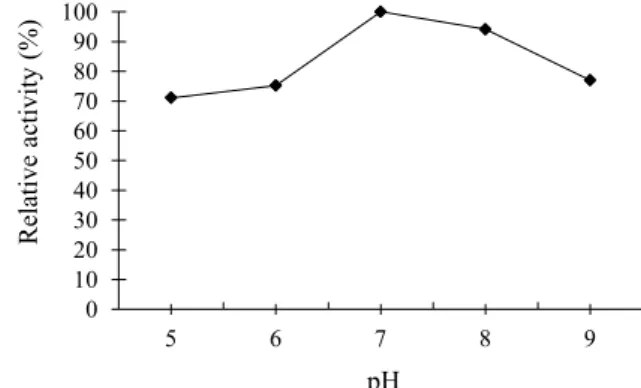
In order to estimate the best proteases partition conditions using the PEG/phosphate system, the pH effect on the proteases activity from L. citrinus was evaluated. Results showed that the enzyme was active in the pH range from 5.0 to 9.0, but exhibited maximum activity at pH 7.0 (Figure 1). Based on these results, it was decided to maintain a pH of 7.0 in the experiments with the ATPS.
The results obtained in the 11 runs of the 23 factorial design as well as the values of partition coefficient (K), purification factor (PF) and activity yield (Y), are presented in Table 2. Run 1 did not form two phases because this condition (PEG 550 g/mol) was below the binodal curve, but the concentrations above the binodal curve for PEG 550 g/mol, and all runs for PEG 6000g/mol tested, were used in the study to prevent high PEG mass concentration from influencing the biomolecule’s extraction. This same phenomenon was obtained by Cavalcanti et al.25 when extracting phospholipase by the PEG/ phosphate system.
For the partition coefficient (K), proteases preferably partitioned to the top phase, rich in PEG, in all tested systems. These data corrobo-rated those obtained by Nitsawang et al.26 and Nalinanon et al.27 who reported proteases partition to the top phase when processing Carica papaya and Thunnus alalunga proteases with the PEG/phosphate and PEG/ammonium sulphate systems, respectively.
The results obtained for the partition coefficient (Table 3) showed that only CPEG and CPHOSPH were significant and positive at a 95% con-fidence level. This means that increases in CPEG and CPHOSPH favored proteases partition to the top phase, increasing the partition coefficient. The optimum for K (23.0) was obtained with MMPEG (550 g mol
-1), CPEG (17.5% w/w) and CPHOSPH (25% w/w) in run 7 (Table 2).
In general, it is known that the presence of phosphate concen-tration in aqueous two-phase systems influences the partition of Table 1. Factor levels used in the 23 design used for studying mycelial biomass
and proteases production by Lentinus citrinus DPUA 1535
Factors Levels
Lower (-1) Center (0) Higher (+1) MMPEG
a 550 4000 6000
CPEG % (w/w)
b 12.5 15.0 17.5
CPHOSPH %(w/w)
c 15 20 25
a PEG molar mass (g mol-1); b PEG concentration (%); c Phosphate concen-tration (%).
Kirsch et al.
1914 Quim. Nova
molecules by the charge of proteins.28 In this work, an increase in phosphate concentration promoted L. citrinus proteases migration to the top phase rich in polymer (PEG). This phenomenon can be explained by the “salting out effect”, where the biomolecule is driven to another phase due to a high amount of salt in the bottom phase.
Also, phosphate ions can influence protein partition by electros-tatic charge between biomolecules and the components of the ATPS. With an increase in phosphate salt concentration, negatively charged proteins prefer the PEG-rich phase, due to the repulsive force caused by salt anions.25,29
Similar results were also found by Babu et al..10 These authors reported that the switch from 14% (w/w) phosphate concentration to 20% (w/w) in the PEG/phosphate system resulted in an increase in partition coefficients of bromelain. The increase in salt concentration reduces the biomolecule’s solubility in the salt-rich (bottom) phase, resulting in increased partitioning of biomolecules to the top phase and is referred to as the “salting out effect”.
The polymer molar mass is a very important variable in the partition coefficient (K), given that its effect is highly dependent on the biomolecule molecular mass.11 Typically, the partition of high molecular mass proteins is more influenced by changes in the poly-mer molecular mass than low molecular mass proteins. The increase in molecular weight of polymer results in an increase in the chain
length of the polymer and the exclusion effect, which lead to the reduction in free volume.29 However, the results of proteases from L. citrinus revealed that the MMPEG parameter was not significant in the partition coefficient. A possible explanation is that the protease is likely to be of low molecular mass and therefore not influenced by the exclusion effect.
The results of purification factor demonstrate that all variables and interactions among them were statistically significant. The posi-tive CPHOSPH effect was the most significant, indicating that elevated phosphate salt concentration provided the highest purification factor values.
The interaction among MMPEG, CPEG and CPHOSPH was significant and positive indicating that simultaneous increase in these three variables led to improved purification factor of proteases. The opti-mum condition was obtained in run 8, with MMPEG (6000 g mol
-1), CPEG (17.5%) and CPHOSPH (25%), with purification factor (PF=1.1), as indicated in Figure 2.
Similar results were reported for extraction of polyphenol oxidase using the PEG/phosphate system. Babu et al.10, using a MM
PEG 4000 system, verified that increase in potassium phosphate concentration from 14% (w/w) to 20% (w/w) increased the purification factor, despite a decrease in activity recovery in the bottom phase.
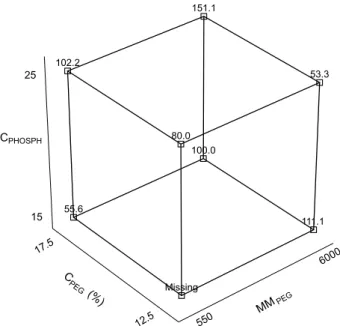
For the activity yield (Y), it was verified that the positive MMPEG effect was the most significant, which means that MMPEG increase favors this parameter increase. As shown in Figure 3, the best activity yield (151.1) was obtained in run 8, represented by MMPEG 6000, CPEG (17.5%) and CPHOSPH (25%). In addition, the highest values were obtained under this condition, both for the purification factor (1.1) and activity yield (151.1%).
The results obtained in this study differ to those obtained by Mayolo-Deloisa et al.30 in the laccase extraction of Agaricus bisporus. These authors reported that, although enzyme recovery was higher in the PEG/phosphate system at pH 7.0, the use of PEG with lower molar masses led to 80% recovery.
There are frequent reports in the literature regarding recoveries exceeding 100% for enzyme extraction using ATPS, as shown by Cavalcanti et al.25 and Cavalcanti et al..31 These authors cited enzyme yields of around 230 and 168%, respectively, when the PEG/phos-phate ATPS was used for phospholipase C extraction. According to Table 2. Results obtained in the 23 experimental design by the levels of Table 1
Runs MMPEG a C
PEG (%)
b C
PHOSPH (%)
c Kd PFe Yf
1 550 12.5 15 - -
-2 6000 12.5 15 6.7 1.0 111.1
3 550 17.5 15 1.3 0.3 55.6
4 6000 17.5 15 7.5 0.2 100.0
5 550 12.5 25 4.0 0.5 80.0
6 6000 12.5 25 4.0 0.2 53.3
7 550 17.5 25 23.0 1.0 102.2
8 6000 17.5 25 17.0 1.1 151.1
9 4000 15.0 20 6.2 0.4 137.8
10 4000 15.0 20 7.8 0.5 137.8
11 4000 15.0 20 5.3 0.4 142.0
a PEG molar mass (g mol-1); b PEG concentration (%); c Phosphate concen-tration (%); d Partition coefficient (K); e Purification factor (PF); f Activity yield (Y) on top phase. Formation of two phases was not observed in run 1 Table 3. Effects estimates calculated from the response in Table 2
Factors Effect estimate
Kd PFe Yf
(1)MMPEG
a 1.99 ± 0.85 5.10 ± 0.03+ 24.49 ± 1.81+ (2)CPEG
b 9.84 ± 0.85+ 7.09 ± 0.03+ 22.65 ± 1.81+ (3)CPHOSPHc 9.40 ± 0.85+ 11.00 ± 0.03+ 16.53 ± 1.81+ 1*2 -1.85 ± 0.85 -5.62 ± 0.03+ 1.22 ± 1.81 1*3 -5.46 ± 0.85+ -8.05 ± 0.03+ -18.37 ± 1.81+ 2*3 8.63 ± 0.85+ 14.51 ± 0.03+ 10.41 ± 1.81+ 1*2*3 -1.61 ± 0.85 12.22 ± 0.03+ 19.59 ± 1.81+ a PEG molar mass (g mol-1); b PEG concentration (%); c Phosphate concentra-tion (%); d Partition coefficient (K); e Purification factor (PF); f Activity yield (Y). + Statistically significant values at the 95% confidence level. The standard errors are estimated from the replicate runs at the central point. The error is
descriptive around of the contrast estimate, after symbol ± Figure 2. Cubic plot of the purification factor values obtained in the design
Partition of proteases from Lentinus citrinus DPUA 1535 1915
Vol. 35, No. 10
Mayerhoff et al.,32 high values in the recovery of these biomolecules can be explained by the decrease in concentration of potential enzyme inhibitors and activation of enzyme interaction with components of the system, which can favor enzymatic activity.
In the present work, purification factor was not high although this phenomenon has proven common in some studies reported in the literature using biological extracts such as phytase,33 exopectinase34 and alcohol dehydrogenase.35 Furthermore, activity yield recovery of the L. citrinus proteases was good, indicating that there was no loss of activity after extraction of this enzyme.
CONCLUSION
The results reported here showed that the PEG/phosphate aqueous two-phase system proved ineffective for total purification of proteases from L. citrinus, although represented a simple, economically feasible and promising tool for use in the first stages of enzyme purification. ACKNOWLEDGMENTS
The authors wish to acknowledge the finantial support from Capes (Coordenação de Aperfeiçoamento de Pessoal de Nível Superior, Brasília, Brazil), FAPEAM (Fundação de Amparo à Pesquisa do Amazonas, Manaus, Brazil) and the CNPq (Conselho Nacional de Desenvolvimento Científico e Tecnológico, Brasília, Brazil). REFERENCES
1. Joo, H. S.; Chang, C. S.; Process Biochem.2005, 40, 1263.
2. Laxman, R. S.; Sonawane, A. T.; More, S. V.; Rao, B. S.; Rele, M. V.; Jogdad, V. V.; Deshpande, V. V.; Rao, M. B.; Process Biochem.2005,
40, 3152.
3. Falahatpishe, H.; Jalali, M.; Badami, N.; Mardani, N.; Khosravi-Darani, K.; Iranian J. Biotechnol. 2007, 5, 110.
4. Thys, R. C. S.; Guzzon, S. O.; Cladera-Oliveira, F.; Brandelli, A.; Pro-cess Biochem. 2006, 41, 67.
5. Sabotic, J.; Treek, T.; Popovic, T.; Brzin, J.; J. Biotechnol.2007, 128, 297.
6. Chouyyok, W.; Wongmongkol, N.; Siwarungson, N.; Prichanont, S.;
Process Biochem. 2005, 40, 3514.
7. Rawdkuen, S.; Pintathong, P.; Chaiwut, P.; Benjakul, S.; Food Bioprod. Process. 2011, 89, 73.
8. Ketnawa, S.; Rawdkuen, S.; Chaiwut, P.; Biochem. Eng. J.2010, 52, 205.
9. Chethana, S.; Nayak, C. A.; Raghavarao, K. S. M. S.; J. Food Eng.2007,
81, 679.
10. Babu, B. R.; Rastogi, N. K.; Raghavaro, K. S. M. S.; Chem. Eng. Pro-cessing2008, 47, 83.
11. Imelio, N.; Marini, A.; Spelzini, D.; Picó, G.; Farruggia, B.; J. Chroma-togr., B: Anal. Technol. Biomed. Life Sci.2008,873, 133.
12. Asenjo, J. A.; Andrews, B. A.; J. Chromatogr., B: Anal. Technol. Biomed. Life Sci.2011, 1218, 8826.
13. Sarangi, B. K.; Pattanaik, D. P.; Rathinaraj, K.; Sachindra, N. M.; Mad-husudan, M. C.; Mahendrakar, N. S.; J.Food Sci. Technol.2011, 48, 36. 14. Gavazane, M. R.; Gaikar, V. G.; Enzyme Microb. Biotechnol. 2003, 32,
665.
15. Mazzola, P. G.; Lopes, A. M.; Hasmann, F. A.; Jozala, A. F.; Penna, T. C.; Magalhães, P. O.; Rangel-Yagui, C. O.; Pessoa Jr, A.; J. Chem. Technol. Biotechnol.2008, 83, 143.
16. Klomklao, S.; Benjakul, S.; Visessanguan, W.; Simpson, B. K.; Kishimu-ra, H.; Process Biochem.2005,40, 3061.
17. Porto, T. S.; Medeiros e Silva, G. M.; Porto, C. S.; Cavalcanti, M. T. H.; Barros Neto, B.; Lima-Filho, J. L.; Converti, A.; Porto, A. L. F.; Pessoa Jr, A.; Chem. Eng. Process2008, 47, 716.
18. Rollan, M. G.; Cultivo de Setas y Trufas, 4ª ed., Mundi Prensa: Madrid, 2003.
19. Gbolagade, J. S.; African J. Biotechnol.2006, 5, 1246.
20. Leighton, T. J.; Doi, R. H.; Warren, R. A.; Kelln, R. A.; J. Mol. Biol.
1973, 76, 103.
21. Porto, T. S.; Monteiro, T. I. R.; Moreira, K. A.; Lima-Filho, J. L.; Silva, M. P. C.; Porto, A. L. F.; Carneiro da Cunha, M. G.; W. J. Microbiol. Biotechnol.2005, 21, 655.
22. Barros Neto, B.; Scarminio, I. C.; Bruns, R. E.; Como Fazer Experi-mentos: Pesquisa e Desenvolvimento na Ciência e na Indústria, 2ª ed., Editora da UNICAMP: Campinas, 2007.
23. STATISTICA (data analysis software systems); Statsoft Inc. version 8.0, 2008.
24. Bradford, M. M.; Anal Biochem.1976, 72, 248.
25. Cavalcanti, M. T. H.; Porto, T. S.; Barros Neto, B.; Lima-Filho, J. L.; Porto, A. L. F.; Pessoa Jr, A.; J. Chromatogr., B: Anal. Technol. Biomed. Life Sci. 2006, 833, 135.
26. Nitsawang, S.; Hatti-Kaul, R.; Kanasawu, P.; Enzyme Microbiol. Tech-nol.2006, 39, 1103.
27. Nalinanon, S.; Benjakul, S.; Visessanguan, W.; Kishimura, H.; Process Biochem.2009, 44, 471.
28. Yang, S.; Huang, Z.; Jiang, Z.; Li, L.; Process Biochem. 2008, 43, 56. 29. Hahn, J. H.; Lee, C. L.; Colloids Surf.1997, 9, 131.
30. Ratanapongleka, K.; Int. J. Chem. Eng. Appl.2010, 1, 191.
31. Cavalcanti, M. T. H.; Porto, T. S.; Barros Neto, B.; Lima-Filho, J. L.; Porto, A. L. F. P.; Pessoa Jr, A.; J. Chem Technol. Biotecnol.2008, 83, 158.
32. Mayerhoff, Z. D. V. L.; Roberto, I.; Franco, T. T.; Biochem. Eng. J.2004,
18, 217.
33. Neves, M. L.; Porto, T. S.; Souza-Motta, C. M.; Spier, M. R.; Soccol, C. R.; Moreira K. A.; Porto, A. L. F.; Fluid Phase Equilibr.2012, 318, 34. 34. Antov, M. G.; Pericin, D. M.; Pejin, S.; J. Serb. Chem. Soc.2004, 69,
299.
35. Venâncio, A.; Almeida, C.; Teixeira, J. A.; J. Chromatogr., B: Anal. Technol. Biomed. Life Sci. 1996, 680, 131.
Figure 3. Cubic plot of the activity yield values obtained in the design of