Article
In Situ Scanning Tunneling Microscopy Study of 5,6-Dimethyl Uracil on Au (111)
Frederico G. C. Cunha and Francisco C. Nart*
Instituto de Química de São Carlos, Universidade de São Paulo, CP 780,13560-970, São Carlos - SP, Brazil
Fenômenos de desordem e posterior reorganização de um filme de 5,6dimetil uracil (5,6 -DMU), causados pela evolução de hidrogênio, foram estudados usando STM in situ e voltametria cíclica em solução de ácido sulfúrico sobre Au (111). Um filme estável com adsorsão física foi formado entre os limites da evolução de hidrogênio (a –0.3 V/SCE) e o levantamento da reconstrução (a 0.4 V/SCE) na concentração de solução usada neste estudo. A evolução do hidrogênio causou a formação de estruturas semelhantes a “bolhas” que desestabilizaram o filme desencadeando o processo de desordem que ocorre em toda a área estudada. Polarizando novamente o eletrodo em um potencial na região de estabilidade do filme, foi possível o acompanhamento, em tempo real, da reorganização do filme. Uma evolução anisotrópica do filme foi observada. Os degraus monoatômicos não se mostraram sítios preferenciais de nucleação. A estrutura de empacotamento molecular foi derivada a partir de imagens de STM de alta resolução e a existência de dois estados de adsorsão distintos foi estabelecida.
The hydrogen evolution mediated 5,6-dimethyluracil (5,6-DMU) film disordering and subsequent reordering was studied in situ in sulfuric acid solution on Au (111) using STM and cyclic voltammetry. A stable, condensed physisorbed film was formed between the limits of the hydrogen evolution (at –0.3 V/SCE) and the lifting of the surface reconstruction (at 0.4 V/SCE) in the bulk solution concentration used in this study. The onset of hydrogen evolution led to the formation of “bubble” like structures which disrupted the stability of the film causing a disordering process which takes place within the whole scanned area. Stepping the potential back to the region of stability allowed the real time observation of the film reorganization. An anisotropic evolution of the film was found. The surface step edges were not found to be preferential nucleation sites. The molecular packing structure was inferred from high-resolution STM images and the existence of two distinct adsorbate states was established.
Keywords: Au (111), Uracil, STM, organic films
Printed in Brazil 0103 - 5053 $6.00+0.00
Introduction
One of the most active fields of research in electrochemistry of the last few years has been the study of the adsorption of organic molecules on metals1-2. This interest is not purely academic given the fact that it can modify the chemical and structural properties of surfaces to produce applications in chemical and biological sensors3,
corrosion prevention, metal plating and modification of the catalytic properties of electrodes.
The advent of scanning probe microscopy4 has brought a new impetus to this field due to the possibility to access the dynamic surface in real time and space with unprecedented resolution. The molecular adsorption studies have been focused mainly on the low index faces of gold due to the relative ease of surface preparation and
the intermediate interaction strength with adsorbed molecules when compared to the d metals group and low melting point sp metals.
Many studies on n-alkylthiols5-7 have been performed and the Self-Assembled Monolayer (SAM) concept has emerged even in non-electrochemical conditions. The strong S-Au interaction, in conjunction with the hydrophobicity of the hydrocarbon tail, are the responsible driving forces for the film formation. This kind of film has shown a high stability, being insensitive to variations of many variables such as bulk concentration, temperature and even surface charge.
Nitrogen containing molecules, on the other hand, have displayed a more elaborated behavior. Early electro-chemical studies at the mercury electrolyte interface found that many organic molecules adsorb and go through a phase transition with the formation of two-dimensional ordered films8.
First measurements with camphor adsorbed on Zn (0001) indicated that the film condensation was not restricted to the defect free mercury surface. Since then, many studies on the condensation and film formation of aromatic organic molecules have been performed using many surface techniques such as cyclic voltammetry9-10, chronocoulo-metry11, SNIFTIRS12, SXS13, XPS14 and STM15-19.
In this class of molecules, uracil and its methyl derivatives have become a model system for systematic studies. A picture has emerged where the system behavior, regarding the surface potential, may be divided in four distinct adsorption states. These states are determined by both: concentration and surface charge. For a given concentration, a steady state cyclic voltammogram will delimit four regions characterized as follows20.
Starting in the threshold of hydrogen evolution, a diluted, gas like phase (state I) is characterized by a continuous adsorption/desorption process. The molecules do not stay adsorbed long enough to organize into a film. In this phase, there’s a weak lateral, molecule-molecule, as well as a vertical, molecule-adsorbate interaction. The molecules assume a flat position and present a surface excess considerably smaller than one monolayer. The driving force in this phase is mainly the hydrophobicity and electrostatic interaction with the surface.
Scanning towards more positive potentials causes an increase in surface population, and length of residence, up to a limit where a phase transition takes place. This phase transition corresponds to the formation of a highly organized film, increasing sharply the amount of space available for molecular adsorption. In a CV, a sharp pair of spikes delimits this phase transition. In a capacitance curve a sudden lowering of the overall capacity delimits the so-called “pit region” where a 2D film is stable. In the surface, as seen by scanning probe techniques, a two-dimensional condensation takes place with the formation of a liquid like, delicate physisorbed film (state II). The stability of this film is severely dependent on the temperature, pointing towards a physisorbed adlayer. STM and SNIFTIRS data12, for the case of thymine, have shown that the molecules adsorb in a flat position. Models of the molecules associated with experimental evidence suggest a hydrogen bond stabilized network.
At higher potentials, a complex reorientation and charge transfer reaction takes place, in the same range of potential where the surface reconstruction is lifted, delimiting what is called state III.
Finally, a chemisorbed phase is reached (state IV). In this region the molecules assume a standing position with a chemical bond that resembles the one found for the
alkanothiols in strength. This film is stable at considerably high temperatures.
Even though the nitrogen containing aromatic compounds present a general trend for the phase transition, the local ordering of the chemisorbed phase can be strongly affected by substituents in the ring. In this study we report the ordering process of a monolayer of 5,6-DMU on Au (111) in H2SO4 solution after a disordering caused by the, potential induced, hydrogen evolution as a function of time. The molecular packing structure of the monolayer films are studied by high resolution STM.
Experimental
The gold electrode used for STM and electrochemical measurements was a single crystal disc, 10 mm in diameter and 4 mm thick, purchased from Metal Crystal and Oxides (Cambridge, UK). It was cut and mechanically polished down to 0.03 µm. Before each experiment the electrode was flame annealed in a Hydrogen/Oxygen flame to red heat for approximately 5 minutes and cooled down in a high purity Argon stream.
The solutions were prepared from “Milli-Q” water, H2SO4 (Merck Suprapure) and 5,6-DMU (Fluka puriss.). In all experiments the used electrolyte was H2SO4 0.050 mol L-1. The solutions for STM were not purged with any
inert gases at any time.
In-situ STM studies were performed with a Topometrix Discoverer 2010. The STM tips used were electrochemically etched tungsten wires in NaOH 2 mol L-1 coated first with polyethylene and then dipped for a few seconds in nail polish. All STM images were recorded in constant-height mode and are presented as unfiltered “top-views” unless stated otherwise.
For the STM measurements, a home made Teflon cell was used attached to a Teflon covered rubber O-ring used as a gasket. For cleaning purposes, the cell was soaked in a saturated potassium permanganate solution overnight. Prior to any experiment the cell was thoroughly rinsed in milli-Q water and soaked in 30% H2O2 for one hour. After that, the cell was boiled in milli-Q water for two hours, changing the solution several times.
Results and Discussion
Potential induced disordering
STM as well as cyclic voltammogram measurements were performed with a fixed 5,6-DMU concentration of 12 x 10-3 mol L-1. This choice was made to guarantee a
comfortable range of potential where the physisorbed phase is stable. Smaller concentrations would give rise to film condensation at higher potentials, whereas higher concentrations were limited by the salt solubility.
Cyclic voltammetry
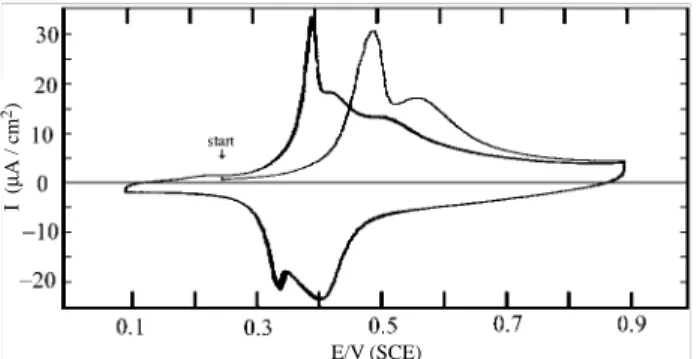
The voltammogram shown in Figure 1 was recorded directly in the STM cell at room temperature and in the presence of oxygen. For this experiment, contact with the electrolyte was made under strict potential control. Two distinct curves are shown. The first curve starts at 0.2 V, where the surface is thermally reconstructed. A sharp peak around 0.5 V indicates the lifting of the reconstruction, with the consequent appearance of gold islands21. The
second curve is an overlapping of several scans and corresponds to the steady state, which is attained after the first cycle. This set of curves show marked differences from the first one, being the most noticeable one the sharp peak that appears at ~ 0.4 V. This peak has been identified with the phase transition from phase II to phase III of the adsorbed film and compares favorably with published results for this pH range20.
in situ STM
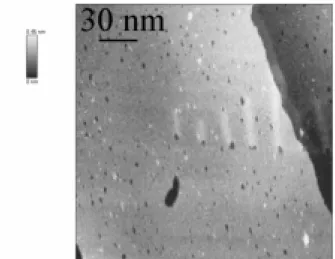
As a first step in the surface characterization we have recorded several images of the gold surface, thermally reconstructed without any specific adsorption. For this purpose, in situ STM experiments have been carried out using only the support electrolyte: H2SO4. Figure 2 is a representative image of such surface where many surface typical characteristics are displayed. Arrow A points towards a step bunching, which is formed in the polishing procedure and is not removed by the thermal treatment. The same phenomena can be seen almost everywhere in the surface, but usually flat terraces big enough can be singled out for the STM measurements. Arrow B indicates the presence of another kind of defect, a screw dislocation. In this defect one part of the crystal suffers a dislocation whereas another one does not. The mismatch created is the screw dislocation. Arrow C points to a series of parallel lines which have been drawn to highlight a very light modulation found throughout the entire surface: the surface thermally induced reconstruction. This kind of modulation is formed by the mismatch in the number of atoms in the surface and in the bulk. In the inset of Figure 2 we show a higher resolution image of this reconstructed area where the atoms can be resolved.
Figure 1. Cyclic voltammogram of 5,6 - DMU 12 mM on Au (111) from aqueous H2SO4 50 m mol L-1. Scan rate = 0.1V s-1. First cycle corresponds
to a freshly prepared thermally reconstructed Au (111) – (p ×√3) surface. Steady state is achieved readily in the second cycle
The phase transition I→ II however, cannot be seen in this figure. This phase transition is recognized by a pair of sharp spikes which depend on concentration and crystal quality20, but not on pH. For this concentration range, the phase transition should take place at about –0.5 V20 well within
the hydrogen evolution which takes place around – 0.3 V in our setup.
Figure 2. STM image of Au (111) in H2SO4 50 m mol L-1 at -100 mV
(vs SCE). Image in constant current mode, It = 1 nA Inset: same conditions. Image in constant current mode, It = 7 nA
Figure 3 shows a representative, thermally reconstructed, surface covered by 56DMU. It was recorded at +100 mV (vs SCE) without prior excursions in any direction (reconstruction lifting or hydrogen evolution). The image
E/V (SCE)
I (
µ
A / cm
shows an atomically flat terrace with one single step at the right side. The surface appears smooth with two kinds of features: pinholes randomly distributed and vertical, several angstrom wide lines appear in the middle of the caption. These pinholes are expected for this kind of film due to the mismatch between neighboring patches. These features will be discussed later.
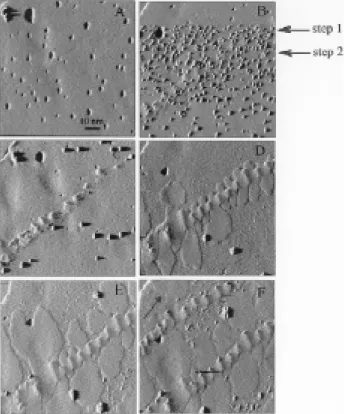
same time, and this last mode distinctly shows that these “bubbles” correspond to areas of lower resistivity, or increased tunneling current. One possible explanation is that these “bubbles” correspond to a group of molecules that have been moved from their original positions to a neighboring one on top of the original film. Another possibility is that a hydrogen “bubble” was formed and remained attached to the surface long enough to be imaged in the first scan. This later possibility would correspond to a lowering of the effective barrier height in the gaseous phase as compared to the liquid phase. However, as shown by Eberhardt et al22, the effective barrier height is lowered by 1 eV going from liquid phase to vacuum. If similar changes apply to the gas phase, we can rule out this possibility. Another reason to rule out the presence of gaseous hydrogen bubbles is the fact that a few “bubbles” remain in place after several scans where the disturbance caused by the tip should be enough to dislodge the “bubble”. In step 2 the potential is stepped back to –0.23 V while the area scan continues. The surface remains covered by “bubbles”, but there’s a marked decrease in the “bubble” coverage. Another feature change noticeable in this second figure is the disappearance of the majority of the pinholes. One particular big hole located in the top left corner, nearby a step edge, remains practically unchanged throughout the experiment. This stability suggests that it is a surface defect, not a film pinhole, and therefore was used to track the surface movement due to thermal drift. Following to Figure 4c, at the same potential of –0.23 V, but three minutes later, we notice the almost complete disappearance of the “bubbles”. A few pinholes are still visible but a diagonal structure starts to be noticed. This structure resembles the one found in Figure 3 but with shorter and more numerous stripes. In this figure there is still no noise differences which can be used to distinguish between ordered and disordered regions. Figure 4d displays another radical change from the previous one, even though the potential remained the same and only three minutes elapsed. The pinholes are totally gone, meaning that the original ordered film was in fact completely dissolved. The diagonal structure, resembling a spinal chord, starts to spread patches of film to its sides. The patches grow always from areas in between “spinal” structures and, even though they all belong to the same starting film, they do not coalesce. This somewhat surprising behavior at the molecular scale resembles a well studied phenomena known as “shish-kebab” morphology. Such phenomen is particularly well studied23-24 for the crystalline growth of polymers under
strain. These studies have suggested that the energy increase necessary to the formation of a critical nucleation site is smaller when the polymeric chains are oriented. Therefore the crystal growth through lamellae should be faster than Figure 3. STM image of 5,6 - DMU adsorbed on Au(111) in 50 m mol L-1
H2SO4 at +100 mV (vs SCE). Image in constant current mode, It = 3 nA, Vtip = -50mV (SCE)
the spherulitic growth. Even though no external strain is applied to our system, the film itself induces strain, as will be discussed later. We also notice in Figure 4d that there’s a competition between neighboring patches for space while they grow. Figure 4e, acquired three minutes later, already shows a surface almost completely covered by an ordered phase that started by the diagonal structure. Note that some of the “bubbles” are still on the surface, but these are most probably due to surface contamination. This contamination is not desorbed, but pushed away by the growing film to the small remaining areas in between patches.
Finally, Figure 4f was acquired three minutes later, showing a surface almost completely covered and a new diagonal “spinal” structure has appeared in a position parallel to the first one. Hölzle et al20 have determined that 5,6-DMU presents two different adsorption states on Au (111) depending on the bulk concentration. It means that the positioning of the molecules in relation to the surface may assume two different states, depending on the surface excess determined by both, bulk concentration and surface charge in this physisorbed film.
Molecular packing structure
The image shown in Figure 4f suggests the coexistence of the two adsorption states within the same bulk
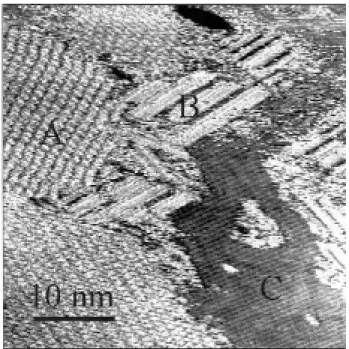
concentration and surface charge. It also suggests that one of the states has a structure that induces the bending of the film, which originates the lines shown in Figures 3 and 4. To further explore this system, high-resolution images of the surface were acquired when the surface potential was raised to the limit of stability of this phase II. Figure 5 was obtained in the threshold of reconstruction lifting at +200 mV. It clearly shows three distinct regions, labeled A through C. Region A is characterized by a very ordered film divided in three distinct patches which have different ordering directions but the same intermolecular structure. The interface between neighboring patches is slightly noisy, due to the mismatch between their orientations and consequent higher molecular freedom. This ordering resembles the one found for other uracil derivatives14,15,19,25 where it has been shown that a two dimensional hydrogen bonded network is formed.
Region B displays a sharply contrasting structure. It is formed by lines in high contrast with the surroundings, but barely resolved internally. They appear to be formed by double lines 1.0 to 1.4 nm apart. There’s a strong appeal to identify such line pairs with the underlying surface reconstruction, but that’s clearly not the case provided that the distances for reconstruction lines amount to 6.3 nm. Although the resolution inside the lines is poor, it is possible to see that the structure at B is different from A.
Region C is an area where no molecules are imaged. Neither ordered or disordered. The reconstruction lines can be visualized, and some corrugation can be resolved, but a distance measurement clearly shows that this is not atomic resolution, and therefore must be assigned to background noise. The presence of a disordered phase is also visible in the middle of region C.
As shown in the above captions, the molecular packing structure of this molecule does not follow a uniform pattern everywhere under the circumstances of these measurements. At this potential at least two different adlayer films can be distinguished in part A and B of the figure, in agreement with previous observations for the 5,6 - DMU20.
For the determination of a unitary cell from which derive surface excesses, the models used for other uracil12,15,16,19,25 derivatives will be used. Previous chronocoulometric results11 point toward a critical surface
coverage of Γ ~ 1 x 10⁻¹⁰ mol cm-2 where the transition
from a diluted phase to a condensed phase takes place. From the same study, a limiting maximum surface excess
of Γ = 3.4 x 10⁻¹⁰ mol cm-2 for the condensed phase is
determined. These two values yield 166 Å2 and Å2 for the area per molecule, respectively. From capacitance measurements for the adsorption of 56DMU, Holze et al.20 suggested the presence of two different 2-D films at the Figure 4. STM images of the time evolution of the 5,6-DMU physisorbed
potential range of the condensed phase (phase II). The two stable structure have surface excesses of Γ1 = 2.3 x 10⁻¹⁰
mol cm-2 and Γ
2 = 2.9 x 10⁻¹⁰ mol cm-2 leading to an area
occupied per molecule of 72 Å2 and 57 Å2. Considering the dimensions of the 5,6-DMU, it is possible to deduce that the two structures are composed by flat lying and upstanding molecules. Such structures have been observed, under certain circumstances, by STM for 2-2 bipyridine17, 1-10 phenantroline18, uracil19, 5 metil uracil12 and 3 metil
uracil12 in the chemisorbed phase.
From region A of Figure 5, where the resolution is better, we have derived unitary vectors whose dimensions
are 13.5 Angstrom by 22 Angstrom with a 82o angle
between them (see Figure 6).
assuming an upstanding position and areas without any molecules. The phase transition that leads to the change of molecular orientation can be induced by both: surface potential and bulk concentration. In this experiment both variables are kept constant which points toward a metastable equilibrium. Poirier and Pylant5 have shown for an alkanethiol adsorbed on
Au (111) system where that the coexistence of upstanding and flat lying molecules is attained when the bulk concentration reaches an intermediate value. Dretschokow et al19 have shown that the surface potential can also induce the phase transition for uracil molecules, showing mixed structures at potentials where there is an equilibrium between the two phases. The formation of two different orientation of adlayer for this particular molecule had already been proposed by Holzle et al.20 but no data regarding its structure and distribution was presented. The existence of enough space available for additional adsorption rules out the possibility that steric effects would lead to the phase transition, as in Poirier’s system.
It should also be noted that STM is a very powerful tool for the surface probing in extremely small areas of an electrode surface. The scanning tip itself produces extremely large electric fields in its neighborhood disturbing locally the surface. Therefore, the effective surface potential applied in the area scanned must be viewed with skepticism. Classical electrochemical experiments must be performed in order to get global patterns of behavior and its correlation with the local behavior probed by STM must be done with care. Figure 5. STM image of 5,6-DMU adsorbed on Au(111) in 50 m mol L-1
H2SO4 at +200 mV (vs SCE). Image in constant current mode, It = 3 nA, Vtip = -50mV (SCE)
The picture shown in Figure 6 shows this area after zooming in and applying a Fourier transform algorithm (from TopoMetrix) to filter out spurious signal. These vectors comprise a unitary cell composed of four 5,6-DMU molecules with an individual area of 74.3 Å2, corresponding to a surface excess of 2.2 x 10⁻¹⁰ mol cm-2. This result is in
excellent agreement with the one obtained from capacitance methods. The internal structure of the denser phase could not be resolved yet, rendering it impossible to compare with the literature results.
One important question that emerges from the data presented is the coexistence of many different structures within the same experimental conditions. In Figure 5 we find molecules assuming a flat position, and speculate that the others are
Conclusions
We have studied the potential induced disordering -reordering of a 5,6-DMU monolayer on Au (111) using ECSTM and Cyclic Voltametry. We found that a two dimensional molecular array may be disrupted by the hydrogen evolution. The “bubble-like” formation due to the presence of hydrogen in solution destroys the film stability corresponding to a “sublimation” of the adlayer. The reorganization of the film was followed in real time by ECSTM, which showed the existence of preferential sites for the adlayer evolution resembling the “shish-kebab” morphology.
The molecular packing structure of the adlayer was studied and two distinct adsorbate structures were determined. An hexagonal close packed structure resembling the hydrogen bonded network found for other uracil derivatives was encountered. The unit cell dimensions were derived and compared favorably with independent electrochemical results. A second structure, in which the molecules appear to be stacked, like rolls of coins, via delocalized π electrons was also found.
Acknowledgement
The authors are grateful to Dr. Nongjian Tao for providing the tungsten wire used to prepare the STM tips. They are also grateful to Dr. Thomas Wandlowski for the introduction to the subject and the countless hours spent on tutoring. F.C is particularly grateful to Dr. Thomas Dretschkow for his invaluable hands on help.
The authors acknowledge the financial support from FAPESP ( 96/10026-0), CNPq and CAPES.
References
1. Buess-Herman, C. Adsorption of Molecules at Metal Electrodes; Verlag Chemie Weinheim; New York, 1992. 2. Lipkowski, J.; Stolberg, L. Adsorption of Molecules at Metal Electrodes; Verlag Chemie Weinheim; New York, 1992.
3. Ulman, A. Introduction to Ultrathin Organic Films;
Academic Press; Boston, 1991.
4. Binning, G.; Rohrer, H.; Gerber, C.; Weibel E. Phys. Rev. Lett. 1982, 49, 57.
5. Poirier, G. E.; Pylant, E. D. Science 1996, 272, 1145 6. Poirier, G. E. Langmuir 1999, 15, 1167.
7. Dubois, L.; Nuzzo, R. G. Annu.Rev.Phys.Chem., 1992, 43, 437.
8. Levie, R. Chem. Rev. 1988, 88, 599
9. Holzle, M. H.; Kolb, D. M. Ber. Bunsenges. Phys. Chem. 1994, 98, 330.
10. Roefls, B.; Baumgartel, H. Ber. Bunsenges. Phys. Chem. 1995, 99, 677
11. Wandlowski, T.; Holzle, M. H. Langmuir 1996, 12, 6604.
12. Li, W.; Haiss, W.; Floate, S.; Nichols, R. J. Langmuir 1999, 15, 4875.
13. Wandlowski, T.; Ocko, B. M.; Magnussen, O. M.; Wu, S.; Lipkowski. J. J. Electroanal. Chem. 1996, 409, 155. 14. Roelfs, B.; Bunge, E.; Schroter, C.; Solomun, T.; Meyer, H.; Nichols, R. J.; Baumgartel. H. J. Phys. Chem. 1997, 101, 754.
15. Dretschkow, T.; Wandlowski, T. Electrochim. Acta 1998, 43, 2991.
16. Tao, N. J.; DeRose, J. A.; Lindsey, S. M. J. Phys. Chem. 1993, 97, 910.
17. Cunha, F.; Tao, N. J. Phys. Rev. Lett. 1995, 75, 2376 18. Cunha, F.; Jin, Q.; Tao, N. J.; Li, C. Z. Surf. Sci. 1997,
389, 19.
19. Dretschkow, T.; Dakkouri, A. S.; Wandlowski, T. Langmuir 1997, 13, 2843.
20. Holzle, M. H.; Kolb, D. M.; Krznaric, D.; Cosovic, B. Ber. Bunsenges. Phys. Chem. 1996, 100, 1779 21. Wandlowski, T.; Dretschkow, T. J. Electroanal. Chem.
1997, 427, 105.
22. Eberhardt, D.; Santos, E.; Schmickler, W. J. Electroanal. Chem. 1996, 419, 23.
23. Monks, A. W.; White, H. M.; Basset, D. C. Polymer 1996, 37, 5933.
24. Schultz, J. M.; Hsiao, B. S.; Samon, J. M. Polymer, 2000, 41, 8887.
25. Cavallini, M.; Aloisi, G.; Bracali, M.; Guidelli, R. J. Electroanal. Chem 1998, 444, 75.