Diagnostic accuracy comparison between
clinical signs and hemoglobin color scale as
screening methods in the diagnosis of
anemia in children
Comparação da acurácia do diagnóstico dos
sinais clínicos e da escala de cores de
hemoglobina como métodos de triagem no
diagnóstico da anemia em crianças
Luciana Pedrosa Leal 1
Mônica M. Osório 2
1,2 Programa de Pós-graduação em Nutrição. Universidade Federal de Pernambuco. Av. Prof. Moraes Rego s. n. Cidade Universitária. Recife, PE, Brazil. CEP: 50.670-901 E-mail: [email protected]
Abstract
Objectives: to compare the validity and repro-ducibility of clinical signs with the World Health Organization hemoglobin color scale.
Methods: Two hundred six children in the age range of 6-23 months, at the Instituto Materno Infantil Prof. Fernando Figueira, IMIP, were assessed. Two examiners evaluated the clinical signs and the hemoglobin color scale of each child at the different times. The hemoglobin value was used as a standard for validation.
Results: in more than 90% of cases the agreement between the values of the color scale and the labora-torial hemoglobin was <2 g/dL. Between the clinical signs the highest sensitivity level for diagnosing Hb<11 g/dL was presented by the hemoglobin color scale (75.7%). For moderate/severe anemia Hb<9g/dL the highest sensitivity was shown by combined palmar or conjunctival pallor (74.3%) and by the color scale (52.5%), according to the first and second observer, respectively. The highest specificity level for Hb<11 g/dL was presented by palmar pallor in comparison with the mother's palm and conjunc-tival pallor (100%). For Hb<9 g/dL the highest speci-ficity was presented by the hemoglobin color scale (91.9%).
Conclusions: this study suggests that mode-rate/severe anemia can be diagnosed either by cli-nical signs or by the color scale, while, in cases of mild anemia, the better diagnosis tool appears to be the color scale.
Key words Anemia, Hemoglobins, Diagnosis,
Resumo
Objetivos: comparar a validade e reprodutibilidade dos sinais clínicos (palidez palmar e conjuntival) com a escala de cores da hemoglobina da Organização Mundial de Saúde.
Métodos: pesquisa realizada em 206 crianças de 6-23 meses, atendidas nos ambulatórios de puericultura e pediatria do Instituto Materno Infantil Prof. Fernando Figueira, IMIP. Os sinais clínicos e a escala de cores da hemoglobina foram avaliados por dois observadores em diferentes momentos. A validação foi realizada utilizando-se a hemoglobina como padrão.
Resultados: em mais de 90% dos casos, a concordância entre os valores da escala de cores e da hemoglobina laboratorial encontravam-se em <2 g/dL. Entre os sinais clínicos e a escala de cores, a maior sensibilidade para diagnosticar anemia (Hb<11 g/dL) foi apresentada pela escala de cores da hemoglobina (75,7%) e na anemia moderada/grave (Hb<9 g/dL), pela palidez palmar ou de conjuntiva ocular combinadas (74,3%) e pela escala de cores (52,5%), para o primeiro e segundo examinadores, respectivamente. A maior especificidade foi apresentada na palidez palmar comparada à palma da mãe e palidez de conjuntiva (100%) para Hb<11 g/dL e a escala de cores da hemo-globina (91,9%) para a Hb<9 g/dL.
nated in Brazil Northeast, this study pursues under-standing the new WHO method comparing clinical signs validity and reproducibility (palmar and conjunctival pallor) with the WHO hemoglobin color scale9 when diagnosing anemia in children between 6 and 23 months of age.
Methods
This study was developed at the Instituto Materno Infantil Prof. Fernando Figueira (IMIP), a public hospital in Recife, in the state of Pernambuco, in the Northeast of Brazil. IMIP has been accredited as a teaching unit by the Ministry of Education and as a National Reference Center by the Ministry of Health. Data were collected at the child and pediatric units.
A sample of 206 children was selected to compare anemia diagnosis through clinical signs such as palmar and conjunctival pallor to the WHO hemoglobin color scale, method9 during August-October 2001. Sample size was based on the formula for estimating the sensitivity and specificity of diag-nostic tests.12
N=ZxZ(P(1-P))/(D/D)
D was determined (width of the confidence interval) to be 5%, and, hence, z= 1.96. To compen-sate for losses, N (sample size) was increased by 5% to 204 children.
The pvalue was chosen based on the highest sensitivity criterion (85.2%) from the study of Montresor et al.13for anemia diagnosis, using the WHO hemoglobin color scale.9
The study involved those children between 6 and 23 months of age who were accompanied by their biological mother during their medical visits to the pediatric unit. Children suffering from chronic disea-ses (cardiopathies, rheumatic diseadisea-ses, nephropa-thies, gastrointestinal disorders, respiratory diseases, etc.), whose diagnosis had been confirmed at the time of the medical visit, were excluded.
Clinical signs were evaluated by two examiners, one nurse and one pediatrician, previously trained on IMCI guidelines in the clinical evaluation of chil-dren's palmar and conjunctival pallor under artificial light (a fluorescent lamp). Each of the examiners observed the children's conjunctiva and hand palm at different times, evaluating pallor on the basis of per-sonal judgment. Following, the biological mother's hand palm was evaluated as a standard to identify palmar pallor.
Introduction
Iron deficiency anemia is the most prevailing nutritional deficiency on a global scale, especially in developing countries.1,2The World Health Organi-zation (WHO) estimates that more than two billion people are anemic, which is about one-third of the world population.3It is also estimated that, for each anemic person, at least one other suffers from iron deficiency.4
The prevalence of anemia among under-four-year old children is as high as 39% in non-industria-lized countries, but industrianon-industria-lized countries also present a significant prevalence rate, as high as 20.1%.1
Children, especially young ones, and women of reproductive age, particularly during pregnancy, are more vulnerable to anemia due to their unique phy-siological characteristics.1,2Typical consequences of iron deficiency anemia include decreased develop-ment and motor coordination, decreased language and cognitive capacity development, psychological and behavioral disturbances, and decreased physical activity.1,5,6Hemoglobin analysis is one simple and most economical laboratory parameter and is thus used quite frequently in population studies.1
Another method for diagnosing anemia, studied and used in countries with regions where no labora-tories or few available health resources are present, is the physical exam, which aims to identify skin or mucous membrane pallor as clinical signs of anemia. Anatomical segments such as the conjunctiva, palm, nail bed, lips and tongue have been used to identify anemia.1,2
Due to the need for intervention in high infant morbidity and mortality rates, especially in devel-oping countries, the Pan-American Health Organiza-tion (PAHO) World Health OrganizaOrganiza-tion and the United Nations International Children's Emergency Fund (UNICEF) formulated Guidelines for Integra-ted Management of Childhood Illness (IMCI), which guide the evaluation and classification of anemia in children based on the clinical signs of light or severe palmar pallor.7
Moving beyond clinical signs in diagnosing anemia, Stott and Lewis8developed a new and alter-native method, namely the WHO hemoglobin color scale. Initially, the technique involved the compa-rison of a blood drop collected on a piece of special filter paper with a color scale including ten shades of red.8Later on, scales were developed with six shades of red and various studies have been carried out to verify their performance.9-11
dissemi-the agreement between dissemi-the color scale evaluation and laboratorial hemoglobin levels.
Results
The prevalence of anemia in the children of this sample was 92.7%, with a hemoglobin average of 9.6 ± 1 g/dL. Prevalence of moderate/severe anemia was 20.9%.
The two examiners found prevalences of 69.1% and 73.7% by the WHO hemoglobin color scale. The To evaluate palmar pallor, the examiner opened
one of the children's hands, partially extending the fingers, and observed the palm color
Clinical evaluation of conjunctival pallor was carried out by means of the mucous membrane discoloration concept, that is, the decrease or loss of the reddish pink color. To evaluate conjunctival pallor, the examiner turned the lower eyelid and directly observed the color.
The same examiners also evaluated the WHO hemoglobin color scale.9They received two days of training prior to use. Training was performed through blood samples, selected at IMIP laboratory, containing ethylene diamine tetra-acetic acid (EDTA), including a demonstration of the method, after which the examiners compared the hemoglobin lab results with the values obtained on the color scale. Twenty blood samples were used for each examiner. The technique for using this scale deter-mines the use of a fresh blood drop on a special filter paper of the exact size to cover the opening on the scale (diameter of approximately 1 cm). Evaluation of the hemoglobin color scale was carried out 30 seconds following blood collection, based on the separate judgment of each examiner, comparing the blood drop to scale colors. Hemoglobin concentra-tion was determined in accordance with the values on the scale, ranging from 4 to 14 g/dL, including grades of 4, 6, 8, 10, 12 and 14 g/dL.
Laboratory analysis of hemoglobin levels was only performed in the same day after the examiner's evaluation of the clinical signs and of the color scale. The mothers were not informed of the diagnosis.
The project was approved by the Committee for Ethics and Research on Human Beings of the Natio-nal Ethics Committee. All children who were diag-nosed as anemic received oral iron sulphate treat-ment.
Collected data were processed by the Epi-info, version 6.04 (Centers for Disease Control and Prevention, Atlanta, GA, USA) and Statistica (Stata Soft Inc, Tulsa, OK, USA). computer programs. Anemia diagnosis was based on standards set by the World Health Organization, which accepts hemo-globin concentration values of <11 g/dL1as a para-meter to confirm the diagnosis of anemia in children between 6 and 59 months of age, and <9 g/dL2for moderate/severe anemia.
The validation (sensitivity, specificity, positive predictive value and negative predictive value) was carried out by using hemoglobin value as a reference standard,12determined by a Coulter T-890 automatic
Figure 1
Bland-Altman plots for hemoglobin color scale compared with hemoglobin reference.
Examiner I
Examiner II 4-
3-
2-
1-
0-
-1-
-2-
-3-
-4-6 7 8 9 10 11 12 13
Re
fe
re
nce
-
He
m
ogl
obi
n
Col
our
Sca
le
(g/
dL)
Average hemoglobin (g/dL)
4-
3-
2-
1-
0-
-1-
-2-
-3-re
nce
-
He
m
ogl
obi
n
Col
our
Sca
le
(g/
18 and 23 months. Gender distribution was 51.2% males and 48.8% females.
Correlation between color scale and laboratorial hemoglobin levels was studied by Bland-Altman14 plots (Figure 1). For the first examiner, in 67.3% of cases the difference between hemoglobin values of the color scale and the laboratory was within the interval of ± 1 g/dL, and in 92.1% was ± 2 g/dL. For the second examiner, the difference in 66% of cases was within the interval of ± 1 g/dL, and in 92.6% was ± 2 g/dL.
Data analysis revealed greater sensitivity when combining palmar with conjunctival pallor, followed by palmar pallor alone for diagnosing anemia in observed average hemoglobin values corresponded
to 9.7±1.3 g/dL and 9.6±1.4 g/dL. According to the color scale, the prevalences of moderate/severe anemia were 16.2% and 20%. Very low prevalence were found according to the diagnoses of palmar pallor (39.3% and 26.5%), of palmar pallor in comparison with the mother's palm (29.9% and 13.8%), of conjunctival pallor (19.7% and 22.9%), and the combination of palmar pallor and conjunc-tival pallor, individually or together (47% and 30.9%).
Children's median age was eight months old, with 67.3% of them between 6 and 11 months, 25.6% between 12 and 17 months and 7.1% between Table 1
Sensibility, specificity, positive and negative predictive values of clinical signs and the World Health Organization color scale to diagnose anemia in children, using hemoglobin as the gold standard, according to examiner I and II.
Clinical Sings Sensitivity % Specificity% Positive Predictive Negative Predictive (95%CI) (95%CI) Value % (95%CI) Value % (95%CI)
Examiner I
Palmar pallor 40.3 66.7 93.9 8.1
(33.4 - 47.7) (38.7 - 87.0) (85.7 - 97.7) (4.2 - 14.7)
Palmar pallor in comparison 31.4 86.7 96.8 9.0
with the mother's palm (25.0 - 38.6) (58.4 - 97.7) (87.8 - 99.4) (5.1 - 15.2)
Conjunctival pallor 20.6 92.3 97.4 7.7
(15.1 - 27.3) (62.1 - 99.6) (84.6 - 99.9) (4.2 - 13.4)
Palmar or conjunctival pallor 49.4 76.9 96.7 9.9
(42.0 - 57.0) (46.0 - 93.8) (90.1 - 99.2) (5.1 - 17.9)
Colour scale 72.2 73.3 97.1 17.5
(65.1 - 78.4) (44.8 - 91.1) (92.3 - 99.1) (9.4 - 29.5)
Examiner II
Palmar pallor 28.3 93.3 98.1 9.6
(22.0 - 35.4) (66.0 - 99.7) (88.6 - 99.9) (5.5 - 15.9)
Palmar pallor in comparison 15.3 100.0 100.0 8.8
with the mother's palm (10.6 - 21.5) (74.7 - 100.0) (85.0 - 100.0) (5.2 - 14.4)
Conjunctival pallor 24.8 100.0 100.0 9.9
(18.5 - 32.5) (71.7 - 100.0) (88.8 - 100.0) (5.6 - 16.7)
Palmar or conjunctival pallor 33.1 92.3 98.1 10.3
(25.9 - 41.1) (62.1 - 99.6) (88.6 - 99.9) (5.6 - 17.6)
Colour scale 75.7 53.3 94.9 16.0
Specificity displayed higher rates for conjunc-tival pallor and for palmar pallor compared to the mother's hand palm.
NPV were high, exceeding 80% for all signs and for the WHO hemoglobin color scale, while PPV were higher for the hemoglobin color scale.
Discussion
The high anemia prevalence (92.7%) found in our study in the age range between 6 and 23 months is children. Conjunctival pallor obtained the highest
specificity (Table 1).
When evaluating the capacity of the WHO hemoglobin color scale to identify anemic and non-anemic individuals, a sensitivity above 72% and specificity rates above 53% was determined.
Table 1 displays positive predictive values (PPV) above 90.0% for all signs and for the hemoglobin color scale. The highest negative predictive value (NPV) went to the hemoglobin color scale.
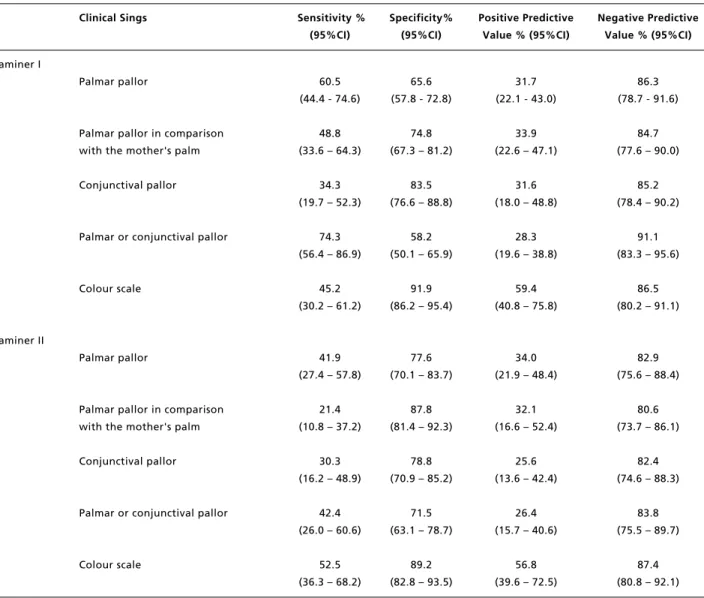
The combination of palmar or conjunctival pallor and isolated palmar pallor (Table 2) reached Table 2
Sensibility, specificity, positive and negative predictive values of clinical signs and the World Health Organization color scale to diagnose anemia moderate/severe in children, using hemoglobin as the gold standard, according to examiner I and II.
Clinical Sings Sensitivity % Specificity% Positive Predictive Negative Predictive (95%CI) (95%CI) Value % (95%CI) Value % (95%CI)
Examiner I
Palmar pallor 60.5 65.6 31.7 86.3
(44.4 - 74.6) (57.8 - 72.8) (22.1 - 43.0) (78.7 - 91.6)
Palmar pallor in comparison 48.8 74.8 33.9 84.7
with the mother's palm (33.6 – 64.3) (67.3 – 81.2) (22.6 – 47.1) (77.6 – 90.0)
Conjunctival pallor 34.3 83.5 31.6 85.2
(19.7 – 52.3) (76.6 – 88.8) (18.0 – 48.8) (78.4 – 90.2)
Palmar or conjunctival pallor 74.3 58.2 28.3 91.1
(56.4 – 86.9) (50.1 – 65.9) (19.6 – 38.8) (83.3 – 95.6)
Colour scale 45.2 91.9 59.4 86.5
(30.2 – 61.2) (86.2 – 95.4) (40.8 – 75.8) (80.2 – 91.1)
Examiner II
Palmar pallor 41.9 77.6 34.0 82.9
(27.4 – 57.8) (70.1 – 83.7) (21.9 – 48.4) (75.6 – 88.4)
Palmar pallor in comparison 21.4 87.8 32.1 80.6
with the mother's palm (10.8 – 37.2) (81.4 – 92.3) (16.6 – 52.4) (73.7 – 86.1)
Conjunctival pallor 30.3 78.8 25.6 82.4
(16.2 – 48.9) (70.9 – 85.2) (13.6 – 42.4) (74.6 – 88.3)
Palmar or conjunctival pallor 42.4 71.5 26.4 83.8
(26.0 – 60.6) (63.1 – 78.7) (15.7 – 40.6) (75.5 – 89.7)
Colour scale 52.5 89.2 56.8 87.4
Montresor et al.,11when considering cut-off points of 8-9 g/dL and <7 g/dL, respectively.
However, for most of the clinical signs, except for conjunctival pallor, the first examiner displayed a greater capacity to identify true positive results in cases of moderate/severe anemia, increasing the test sensitivity. In spite of using different cut-off points for severe anemia, Ingram and Lewis10 and Montresor et al.11showed that there are no errors in diagnosing severe anemia by means of clinical signs, considering cut-off points <6 g/dL and <5 g/dL, respectively. However, higher hemoglobin values are hard to detect and interpret through clinical signs.
For anemia diagnoses, the ideal situation would be to use indices resulting in a higher incidence of false positive than false negative results, since the treatment of non or mildly anemic children who are diagnosed as moderately or severely anemic would not be a problem for most of them. However, an increase in false negative results would imply that anemic children were not included in anemia combat programs, which would be very harmful in places with high anemia prevalence rates.
Various authors have also reported on the perfor-mance of the scale, verifying sensitivities above
80%.11,13,17
One of the advantages in using the hemoglobin color scale is that the examiners can be trained in an easy, fast and economically efficient way, with a minimal need of material, to distinguish between the different color variations of the scale, without obser-vational bias.8,9 However, in this training, it is important to follow the instructions on how to hold the instrument and use the correct thickness of the blood drop, adequate environmental luminosity and the established reading time.8,10,18
Other advantages of the color scale are its low cost in comparison with other methods to determine hemoglobin concentration, and durability, since instrument colors remain's stable during various months, even when in constant use.19
It's important to note that in laboratory diag-noses, hemoglobin reference values are expressed in 0.1g/dL, while the scale is read at 2 g/dL, or 1 g/dL intervals when the examiner considers the value may lie between two shades. According to the guidelines described in the instructions for color scale usage, in case of doubt, the examiner should consider the lowest value, thus increasing the number of false positive results, which would be of interest to communities with high anemia prevalence.11Even when guidelines are followed, confidence intervals specificity for both examiners in this study revealed a wide variation suggesting that color scale use holds year. This is due to both a low dietary iron
consump-tion and rapid growth in the first year. It's possible that in Brazilian Northeast, local dietary practices associated to poor socio-economic conditions contribute to this scenario.
In validation studies, disease prevalence may modify the instrument performance indicators, showing high PPV for high prevalence or high NPV for low prevalence. Therefore, the test ability to confirm anaemia (PPV >90% for all signals and for the hemoglobin colour scale) for self-diagnosed subjects, as well as the test ability to identify high NPV (>80% for all signals and for the hemoglobin colour scale), should be regarded as strictly valid only for the population under study in this work.
The use of the WHO hemoglobin color scale has been studied with lab blood samples and has displayed a high correlation level with the concen-tration of blood hemoglobin in adults when using the linear correlation method.8,9,15Montresor et al.13 have shown a 0,80 correlation rate between the color scale and the hemoglobin values measured by the HemoCue in pre-school children.
In this study, the use of the Bland-Altman plot to analyze the correlation between two methods of clinical measuring,14,16emphasized that over 90% of the agreements between hemoglobin values of the color scale and laboratory values were comprised in the interval of ± 2 g/dL, which was accepted considering the scale's color intervals.
The WHO hemoglobin color scale, with sensi-tivity above 70%, revealed to be a better method than clinical signs to diagnose anemia in children. Using an instrument with pre-established color stan-dards reduces error subjectivity caused by individual interpretation, like in the case of cutaneous-mucous pallor. However, specificity was lower than for most of the clinical signs. The clinical signs displayed a higher amount of false negative results as compared to the hemoglobin color scale. Therefore, it is diffi-cult to identify skin and mucous pallor in cases of mild anemia, increasing the risk of not diagnosing the children who are actually ill, meaning that many children diagnosed as non-anemic were actually anemic.
The results described above corroborate the studies by Ingram and Ingram and Lewis10 and Montresor et al.,11 in which sensitivity for diag-nosing mild anemia was higher for the color scale than for clinical signs.
use of the WHO hemoglobin color scale for anemia diagnosis in the routine practice of health profes-sionals, not as a substitute for the laboratory test, but as a useful method for early diagnosis of a possible decrease in hemoglobin levels, with the goal of fast intervention and, therefore, prevention of a possible problem.
Acknowledgements
The authors thank the mothers and children who participated of the research and IMIP for the support in the field work. This study was funded by the Pan-American Health Organization and Brazil's Ministry of Health.
pragmatic difficulties in identifying of intermediary hemoglobin colors at close to normal levels. The classification of an intermediary shade between 10 and 12 g/dL levels as anemic or not, and between 8 and 10 as moderately/severely anemic or not, depends on the examiner's personal impression.
Hence, it is important to establish a specific color standard for diagnosing anemia in children, which delimits the cut-off points to be used as a reference, aiming at greater accuracy and precision when using the color scale at this age range. Accuracy may also be improved as examiners acquire more experience, enabling them to distin-guish between scale's different colorshades therefore reducing classification errors.
This study offers a favorable contribution to the
11. Montresor A, Ramsan M, Khalfan N, Albonico M, Stoltzfus RJ, Tielsch JM, Savioli L. Performance of the haemoglobin colour scale in diagnosing severe and very severe anaemia. Trop Med Int Health. 2003; 8: 619-24.
12. Andrade ALS, Zicker F. Avaliação de testes diagnósticos. In: Andrade ALS, Zicker, organizadores. Métodos de inves-tigação epidemiológica em doenças transmissíveis. Brasília (DF): Organização Pan-Americana da Saúde, Fundação Nacional de Saúde; 1997. v. 1, p. 9-29.
13. Montresor A, Albonico M, Khalpan N, Stoltzfus RJ, Tielsch JM, Chwaya HM, Savioli L. Field trial of a haemoglobin colour scale: an effective tool to detect anaemia in preschool children. Trop Med Int Health. 2000; 5: 129-33.
14. Bland JM, Altman DG. Statistical methods for assessing agreement between two methods of clinical measurement. Lancet. 1986; 1: 307-10.
15. Münster M, Lewis SM, Erasmus LK, Mendelow BV. Field evaluation of a novel haemoglobin measuring device designed for use in a rural setting. S Afr Med J. 1997; 87: 1522-26.
16. Paddle JJ. Evaluation of the haemoglobin colour scale and comparison with the hemocue haemoglobin assay. Bull World Health Organ. 2002; 80: 813-6.
17. Barduagni P, Ahmed AS, Curtale F, Raafat M, Soliman L. Performance of Sahli and colour scale methods in diag-nosing anaemia among school children in low prevalence areas. Trop Med Int Health. 2003; 8: 615-8.
18. Gosling R, Walraven G, Manneh F, Bailey R, Lewis SM. Training health workers to assess anaemia with the WHO haemoglobin colour scale. Trop Med Int Health. 2000; 5: 214-21.
19. Lewis SM, Emmanuel J. Validity of the haemoglobin colour scale in blood donor screening. Vox Sang. 2001; 80: 28-33.
References
1. UNICEF (United Nations International Children's Emergency Fund), UNU (United Nations University), WHO (World Health Organization). Iron deficiency anaemia. Assessment, prevention and control: a guide for programme managers, Geneva; 2001. (WHO/NHD/01.3.)
2. Demayer EM. Preventing and controlling iron deficiency anaemia through primary health care. A guide for health administrators and programme managers. Geneva: WHO; 1989.
3. INACG Symposium; 1999 March 12; Durban, South Africa. Washington (DC); 2000.
4. Yip R. Iron deficiency: contemporary scientific issues and international programmatic approach. J Nutr.1994; 124 (Suppl 8): S1479-S90.
5. Lozoff B, Jimenez E, Wolf A. Long term developmental outcome of infants with iron deficiency. N Engl J Med. 1991; 325: 687-94.
6. Pollit E. Iron deficiency anemia and later mental retarda-tion. Am J Clin Nutr. 1999; 69: 4-5.
7. WHO (World Health Organization). Integrated management of the sick child. Bull World Health Organ. 1995; 73: 735-40.
8. Sttot GJ, Lewis SM. A simple and reliable method for esti-mating haemoglobin. Bull World Health Organ. 1995; 73: 369-73.
9. Lewis SM, Stott GJ, Wynn KJ. An inexpensive and reliable new haemoglobin colour scale for assessing anaemia. J Clin Pathol. 1998; 51: 21-4.