183 Radiol Bras. 2008 Mai/Jun;41(3):183–187
Comparison of morphometric indices obtained from
dental panoramic radiography for identifying individuals
with osteoporosis/osteopenia*
Comparação de índices morfométricos obtidos na radiografia odontológica panorâmica na identificação de indivíduos com osteoporose/osteopenia
Celia Regina Winck Mahl1, Renata Licks2, Vania Regina Camargo Fontanella3
OBJECTIVE: The present study was aimed at comparing indices obtained from dental panoramic radiographs with bone densitometry results in the identification of individuals affected by osteoporosis/osteopenia. MATERIALS AND METHODS: Panoramic mandibular, mental, antegonial, gonial and mandibular cortical indices calculated with basis on dental panoramic radiographs of postmenopausal women were compared with bone densitometry results, twice by one observer and once by a second observer. RESULTS: Significant differences were not found between the two measurements performed by the same observer, except for the antegonial index on the left side. Interobserver agreement for both sides was good. The variance analysis demonstrated statistically significant differences among groups (normal, osteopenia and osteoporosis) for all the indices evaluated. Differences were significant among all mean panoramic mandibular and mental indices. On the other hand, for the antegonial and gonial indices, only the normal group presented higher means as compared with the other groups (osteopenia and osteoporosis) which did not differ between themselves. CONCLUSION: The indices evaluated were reproducible; panoramic mandibular and mental indices presented the highest sensitivity in the detection of osteopenia/osteoporosis, however the panoramic mandibular index specificity was low. Although all the indices evaluated could identify low bone density, only the panoramic mandibular and mental indices could differentiate patients affected by osteopenia/osteoporosis.
Keywords: Osteoporosis; Panoramic radiography; Risk factors.
OBJETIVO: Comparar índices obtidos de radiografias panorâmicas odontológicas com a densitometria óssea na identificação de indivíduos com osteopenia/osteoporose. MATERIAIS E MÉTODOS: Os índices panorâmico mandibular, mentoniano, antegoníaco, goníaco e cortical mandibular foram obtidos de radiografias panorâ-micas de mulheres na pós-menopausa e comparados aos resultados da densitometria óssea, por um obser-vador duas vezes, e por outro obserobser-vador uma vez. RESULTADOS: Não foram observadas diferenças signi-ficativas entre as duas medições realizadas pelo mesmo observador, exceto para o índice antegoníaco no lado esquerdo. Houve boa concordância entre os diagnósticos utilizando o lado esquerdo e o lado direito e entre os diagnósticos dos dois observadores. A análise de variância demonstrou diferenças significativas entre os grupos (normal, osteopenia e osteoporose) para todos os índices. Para os índices panorâmico man-dibular e mentoniano todas as médias diferiram entre si. Já para os índices antegoníaco e goníaco, somente o grupo normal apresentou média superior aos demais (osteopenia e osteoporose), as quais não diferiram entre si. CONCLUSÃO: Os índices avaliados foram reprodutíveis; os índices panorâmico mandibular e men-toniano foram os que apresentaram maiores valores de sensibilidade para detectar osteopenia/osteoporose, porém a especificidade do índice panorâmico mandibular foi baixa; todos os índices avaliados foram capazes de identificar baixa massa óssea, contudo, apenas os índices panorâmico mandibular e mentoniano permiti-ram diferenciar pacientes com osteopenia/osteoporose.
Unitermos: Osteoporose; Radiografia panorâmica; Fatores de risco. Abstract
Resumo
* Study developed at Universidade Luterana do Brasil (Ulbra), Canoas, RS, Brazil.
1. PhD, Associate Professor at Universidade Luterana do Bra-sil (Ulbra), Canoas, RS, Brazil.
2. Master, Surgeon Dentist, Porto Alegre, RS, Brazil.
3. Post-doctorate, Associate Professor at Universidade Lute-rana do Brasil (Ulbra), Canoas, RS, and Universidade Federal do Rio Grande do Sul (UFRGS), Porto Alegre, RS, Brazil.
Mailing address: Dra. Vania Fontanella. Rua Coronel Paulino Teixeira, 169/403, Rio Branco. Porto Alegre, RS, Brazil, 90420-160. E-mail: [email protected]
microarchitecture, causing bones fragility and consequently increasing the risk for fractures(1). According to the World Health
Organization (WHO)(2), 33% of women
above the age of 65 years are affected by osteoporosis. In Brazil(3), it is estimated that
about one million women may become dis-abled and at least 200 thousand will die Mahl CRW, Licks R, Fontanella VRC. Comparison of morphometric indices obtained from dental panoramic radiography for identifying individuals with osteoporosis/osteopenia. Radiol Bras. 2008;41(3):183–187.
INTRODUCTION
Osteoporosis is a progressive, systemic disease characterized by decreased bone mass resulting in deterioration of the bone
0100-3984 © Colégio Brasileiro de Radiologia e Diagnóstico por Imagem
from subsequent fracture-related complica-tions in the next years, if this disease is not managed. So, osteoporosis starts being considered as a public health problem re-sponsible for a considerable yearly expen-diture(4,5).
Considering that biopsy would be the most accurate method for detecting os-teoporosis, bone densitometry has been consensually accepted as the golden stan-dard in the diagnosis of osteoporosis(2);
however, a systematic assessment of the population by this method has not been recommended. Patients are referred for examination on the basis of a clinical his-tory positive for risk, postmenopausal frac-ture, familial history or use of pharmaceu-ticals(6). Several questionnaires have been
developed and tested as tools for identify-ing patients with low bone density, with approximately 80% sensitivity and 50% specificity(7).
Considering that odontological patients are frequently referred for being submitted to panoramic radiography — a widely available, low-cost method capable of demonstrating aging-related morphologi-cal alterations of the mandible —, several indices, techniques for analysis and images processing have been researched in order to evaluate the applicability of this type of radiography for detecting bone mass loss(8).
However, the results of these studies have been contradictory.
The present study was aimed at compar-ing mandibular cortical measurements based on panoramic radiographs with bone densitometry data of postmenopausal women to evaluate the effectiveness of these measurements in the identification of cases of osteopenia/osteoporosis.
MATERIALS AND METHODS
This observational and transversal study was approved by the Committee for Ethics in Research of the Institution (register No. 2005-236H). The sample included women > 40 years of age referred for evaluation by panoramic radiography for dental treatment purposes in 2006, who agreed in participat-ing in the present study and met the follow-ing inclusion criteria: postmenopausal women with bone densitometry study per-formed for at last three months before, not
undergoing hormone replacement or cal-cium therapy, who had not been submitted to hysterectomy or oophorectomy and free form osteoporosis-related metabolic dis-eases. Presence of bone lesion, fracture, deformity or previous mandibular surgery has also constituted exclusion criteria.
The radiographic images were acquired in an Orthophos equipment (Siemens; Frankfurt, Germany) with kilovolt in the range between 65 kV and 80 kV and 16 mA, utilizing Kodak T-Mat (Kodak; São Paulo, Brazil) films processed in a DENT X 9000 (Dent X Co.; Elmsford, USA). Films with poor image quality were ex-cluded from the sample with basis on pre-viously defined criteria as follows: patient positioning errors, faults in density, con-trast and detail(9).
Each radiographic image was given an identification number in order to allow a blind review by two observers specialized in odontological radiology, with respec-tively 17- and two-year experience. The structures of interest were traced on trans-parencies placed on the radiographs and mounted in cardboard frames, over a
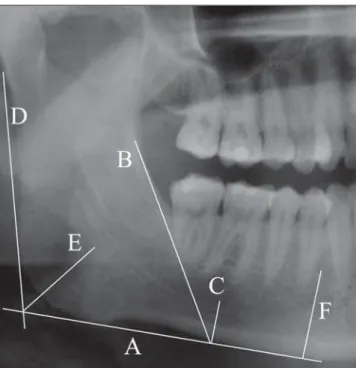
ne-gatoscope, with 0.25 mm Pigma Micron 1 (Sakura Corporation; Osaka, Japan). Mea-surements were bilaterally performed with an electronic, digital, 0.01 mm resolution pachimeter (Starrett; Jedburg, Scotland), on the transparency by the same observer (odontological radiologist). This procedure was repeated for all of the cases in the sample, with a two-week interval between readings. A second observer performed the same measurements in only one side of the images and in a single moment. Measure-ments (Figure 1) were aimed at obtaining the following radiomorphometric indices: • Panoramic mandibular index (PMI)(10)
– the ratio of the mandibular cortical thick-ness measured on the line perpendicular to the bottom of the mandible, at the middle of the mental foramen, by the distance be-tween the inferior mandibular cortex and the bottom of the mandible (normal value: ≥ 0.3);
• mental index (MI)(11) – mandibular
cortical thickness measured on the line per-pendicular to the bottom of the mandible at the middle of the mental foramen (nor-mal value: ≥ 3.1 mm);
Figure 1. Morphometric mandibular indices based on related original articles(10–13). A, tangent line to
185 Radiol Bras. 2008 Mai/Jun;41(3):183–187
• antegonial index (AI)(12) – mandibular
cortical thickness measured on the line perpendicular to the mandibular cortical at the intersection with the tangent line to the anterior border of the branch (normal value: ≥ 3.2 mm);
• gonial index (GI)(13) – mandibular
cor-tical thickness measured on the bisectrix of the angle between the tangent lines to the posterior border of the branch and the bot-tom of the mandible (normal value: ≥ 1.2 mm).
The radiographs were classified ac-cording to the mandibular cortical index (MCI)(14), qualitatively considering the
en-dosteal margin of the mandibular cortex, as follows: C1 – normal (even and sharp en-dosteal margin); C2 – osteopenia (with semilunar defects); and C3 – osteoporosis (presence of porosity and reduced cortical thickness). The data were organized on a worksheet and the patients were classified according to the indices(10–13) for later
com-parison with the bone densitometry results, based on the WHO criteria(2), the
t-score for osteopenia corresponding to a range be-tween –1 and –2.5 standard deviation, and for osteoporosis, –2.5 standard deviation below the bone mass peak. In the cases where discrepancies were found in the bone densitometry study (spine and femur), the worst result was adopted.
The intra- and interobserver reproduc-ibility were evaluated by the Wilcoxon and
t-Student (α = 1%) tests, the first one for the scores resulting from the MCI, and the second for the other indices. The same tests were utilized for evaluating the agreement between results for the right and left sides. Calculation of sensitivity, specificity, positive predictive and negative predictive values of the indices utilized for detection of bone mass loss, was based on the clas-sification of the patients into normal or with bone mass loss, according to the bone densitometry results. Finally, the compari-son among indices at the golden standard level, considering the three patients groups (normal, osteopenia and osteoporosis), the variance analysis (α = 1%) supplemented by the Tukey’s test was utilized.
RESULTS
Based on the bone densitometry results, the 49 patients included in the sample of
the present study were classified as fol-lows: 19 normal and 30 with bone mass loss (24 with osteopenia and six with os-teoporosis) in the age range between 41 and 59 years (mean, 49.9 years), weighting be-tween 59 kg and 75 kg (mean, 65.7 kg), and height in the range between 1.57 m and 1.74 m (mean, 1.63 m).
The indices resulting from the two mea-surements by a same observer at different moments were compared by means of the
t-Student test for paired samples, with no significant difference found between the two measurements, except for AI on the left side (p = 0.01). This difference may be considered as clinically irrelevant (0.09 mm). The non-parametric Wilcoxon test demonstrated no significant difference be-tween the two classifications based on the MCI.
The same statistical tests did not evi-dence any significant difference between measurements and scores attributed by both observers.
The highest agreement between diag-noses utilizing the panoramic radiograph right and left sides was found for the GI, and the lowest for the MI (Table 1). The t -Student test for paired samples demon-strates that there is no significant difference
(α = 1%) between measurements for both sides. The non-parametric Wilcoxon test did not demonstrate any significant differ-ence between classifications based on the MCI for both sides.
Based on the mean between the two evaluations performed by the first observer adopting the worst diagnosis (left or right side) of each index, the patients were clas-sified into normal or with bone mass loss (osteopenia and osteoporosis). Then, these diagnoses were compared with the bone densitometry results, and the sensitivity, specificity, positive predictive and negative predictive values of the indices utilized for detection of bone mass loss were calculated (Table 2).
Considering three groups (normal, osteopenia and osteoporosis) the variance analysis (Table 3) supplemented by the Tukey’s test demonstrated that significant differences occurred among the three groups. For the PMI and MI, all the means were different among each other. On the other hand, for AI and GI, the normal group presented a higher mean than the other groups (osteopenia and osteoporosis) with no difference each other.
DISCUSSION
There are evidences that the shape and mandibular cortical index at panoramic radiographs can be utilized as tools in the detection of low mineral bone density not for diagnosis purposes, but to identify the risk for bone mass loss and appropriately refer the patient for assessment by bone densitometry(15), allowing to prevent the
development of the disease(16).
Addition-ally, the role of clinical dentists in the iden-tification of mandibular cortical erosion detected at panoramic radiographs of post-menopausal women results in 73% of
cor-Table 2 Sensitivity, specificity, positive predictive, and negative predictive values for the indices utilized.
Index PMI MI AI GI CMI Sensitivity 100% 87% 80% 80% 77% Specificity 47% 95% 89% 74% 53%
Positive predictive value
75%
96%
92%
83%
72%
Negative predictive value
100%
82%
74%
70%
59%
PMI, panoramic mandibular index; MI, mental index; AI, antegonial index; GI, gonial index; MCI, mandibular cortical index.
Table 1 Agreement between diagnoses utilizing right and left sides of panoramic radiographs for each index. Index GI PMI MCI AI MI n 48 46 45 44 43 % 98.0% 93.9% 91.8% 89.8% 87.8% Agreement Disagreement n 1 3 4 5 6 % 2.0% 6.1% 8.2% 10.2% 12.2%
186 Radiol Bras. 2008 Mai/Jun;41(3):183–187 rectness in the identification of low mineral
bone density(17).
In this sense, the results of the present study are promising. The analysis of peated measurements reproducibility re-sulted in statistical difference only for the left side AI, but this difference is lower than 0.1 mm and may be associated with the manual method of measurement. Also the scores applied to the MCI were reproduc-ible, notwithstanding being based on visual inspection and therefore theoretically sub-ject to error. Both measurements and scores were also reproducible in relation to the sides and the observer.
It is possible that also the surgeon den-tist can identify patients at risk for bone mass loss when they seek odontological treat-ment(18). Besides the reproducibility, the
validity of these indices, however, depends on their sensitivity and specificity as com-pared with the bone densitometry results(19).
In the present study, the PMI presented the highest sensitivity, but its specificity was the lowest in the whole range of indi-ces evaluated, almost 50% of the most spe-cific index (MI). The MCI presented the worst results, in agreement with the find-ings of Knezoviƒ-Zlatariƒ et al.(20) and
Devlin et al.(21). Upon analysis of Table 3,
it is recommended that these indices are utilized as a whole, considering their simple application.
As regards limitations of the present study, it is important to note that the bone densitometry studies were not performed in the same equipment, and that the dental condition of the patients was not taken into consideration as a variable. Also, it is im-portant to note that even the patients under the age of 50 were classified by the t-score; the z-score was not utilized because the whole sample included postmenopausal women. The utilization of the new classi-fication based on the z-score, according to Sampaio Netto et al.(22), leads to the lack of
preoccupation with those patients consid-ered as presenting with low mineral bone density according to the WHO criteria.
Studies comparing all these indices in a single sample have not been frequently found in the literature. Comparing PMI, MI, AI, GI and MCI, bilaterally measured on panoramic radiographs of 94 women divided into three groups (normal, osteo-penia and osteoporosis), Kim et al.(23) have
concluded that the thickness and shape of the cortical mandible reliably reflect the systemic condition associated with bone mass loss. These results are similar to the ones of the present study. All of these in-dices could be utilized for differentiating between patients with normal and low bone mass density. Only two of these indices (PMI and MI) could differentiate between osteopenia and osteoporosis, likewise the
conclusions reported by Devlin & Horner(24).
Recently, Devlin et al.(21) recommended
the utilization of MI values < 3 mm as a cri-terion for referral of patients for a bone densitometry study. In the present study, however, patients with osteoporosis have met this criterion. However, patients with osteopenia presented with higher MI val-ues (mean, 3.53 mm). The indication of a specialized study for patients in this cat-egory would allow an early approach of this systemic condition that can b precociously prevented and treated.
Therefore, it is important that the sur-geon dentist is focused on the possibility of obtaining these indices and can evaluate their results to interact with other health professionals in the assessment of the risk for osteoporosis.
CONCLUSIONS
The following conclusions can be drawn from the findings of the present study:
– The indices evaluated were reproduc-ible (< 0.1 mm variation) and did not var-ied as a function of the observer or the side where the measurement was performed;
– the PMI and MI presented the high-est sensitivity for detecting bone mass loss, but the MPI specificity was low;
– all the indices evaluated in the present study could identify a low bone mass den-sity, but only the PMI and MI could differ-entiate between patients with osteopenia and osteoporosis.
REFERENCES
1. Consensus Development Conference: diagnosis, prophylaxis and treatment of osteoporosis. Am J Med. 1993;94:646–50.
2. World Health Organization. Assessment of frac-ture risk and its applications to screening for post-menopausal osteoporosis. WHO Technical Series 843,1994.
3. IBGE, 2006. Pesquisa nacional por amostra de domicílios. [Acessado em: 17/11/2006]. Dispo-nível em http://www.ibge.gov.br/home/estatis-tica/populacao/trabalhoerendimento/pnad98/ saude/metodologia.shtm
4. Mohajery M, Brooks SL. Oral radiographs in the detection of early signs of osteoporosis. Oral Surg Oral Med Oral Pathol. 1992;73:112–7.
5. Tolazzi AL. Osteoporose relacionada com a odon-tologia [dissertação de mestrado]. São Paulo: Uni-versidade de São Paulo; 2001.
6. Dargent-Molina P, Piaults S, Bréart G. A triage
Table 3 Comparison of mean indices among golden standard groups.
Index PMI Normal Osteopenia Osteoporosis MI Normal Osteopenia Osteoporosis AI Normal Osteopenia Osteoporosis GI Normal Osteopenia Osteoporosis n 19 24 6 19 24 6 19 24 6 19 24 6 Mean* 0.32a 0.25b 0.21c 4.84a 3.53b 3.01c 3.88a 3.18b 3.04b 1.55a 1.22b 1.10b Standard deviation 0.03 0.03 0.03 0.46 0.47 0.39 0.51 0.37 0.15 0.41 0.25 0.03 CI 95%
[0.30 to 0.34] [0.24 to 0.26] [0.17 to 0.24]
[4.61 to 5.06] [3.33 to 3.73] [2.61 to 3.42]
[3.63 to 4.12] [3.02 to 3.33] [2.88 to 3.20]
[1.35 to 1.74] [1.11 to 1.32] [1.07 to 1.13]
p
≤ 0.01
≤ 0.01
≤ 0.01
≤ 0.01
187 Radiol Bras. 2008 Mai/Jun;41(3):183–187
strategy based on clinical risk factors for select-ing elderly women for treatment or bone densi-tometry: the EPIDOS prospective study. Osteoporos Int. 2005;16:898–906.
7. Schwartz EN, Steinberg DM. Prescreening tools to determine who needs DXA. Curr Osteoporos Rep. 2006;4:148–52.
8. White S, Taguchi A, Kao D, et al. Clinical and panoramic predictors of femur bone mineral den-sity. Osteoporos Int. 2005;16:339–46.
9. Brezden NA, Brooks SL. Evaluation of panoramic dental radiographs taken in private practice. Oral Surg Oral Med Oral Pathol. 1987;63:349–56. 10. Benson BW, Prihoda TJ, Glass BJ. Variations in
adult cortical bone mass as measured by a pan-oramic mandibular index. Oral Surg Oral Med Oral Pathol. 1991;71:617–21.
11. Ledgerton D, Horner K, Devlin H, et al. Pan-oramic mandibular index as a radiomorphometric tool an assessment of precision. Dentomaxillofac Radiol. 1997;26:95–100.
12. Ledgerton D, Horner K, Devlin H, et al. Radio-morphometric indices of the mandible in a Brit-ish female population. Dentomaxillofac Radiol. 1999;28:173–81.
13. Bras J, Van Ooij CP, Abraham-Inpijn L, et al. Radiographic interpretation of the mandibular angular cortex: a diagnostic tool in metabolic bone loss. Part I. Normal state. Oral Surg Oral Med Oral Pathol. 1982;53:541–5.
14. Klemetti E, Kolmakov S, Kroger H. Pantomog-raphy in assessment of the osteoporosis risk group. Scand J Dent Res. 1994;102:68–72. 15. Dervis E. Oral implications of osteoporosis. Oral
Surg Oral Med Oral Pathol Oral Radiol Endod. 2005;100:349–56.
16. Ardakani FE, Niafar N. Evaluation of changes in the mandibular angular cortex using panoramic images. J Contemp Dent Pract. 2004;5:1–5. 17. Sutthiprapaporn P, Taguchi A, Nakamoto T, et al.
Diagnostic performance of general dental practi-tioners after lecture in identifying post-meno-pausal women with low bone mineral density by panoramic radiographs. Dentomaxillofac Radiol. 2006;35:249–52.
18. Musa I, Knezoviƒ-Zlatariƒ D, „elebiƒ A, et al. The influence of gender and age on the values of lin-ear radiomorphometric indices measured on the lower border of the mandible. Acta Stomatol Croat. 2002;36:199–202.
19. Kribbs PJ, Chesnut CH, Ott SM, et al. Relation-ships between mandibular and skeletal bone in a population of normal women. J Prosth Dent. 1990;63:86–9.
20. Knezoviƒ-Zlatariƒ D, „elebiƒ A, Laziƒ B, et al. In-fluence of age and gender on radiomorphometric indices of the mandible in removable denture wearers. Coll Antropol. 2002;26:259–66. 21. Devlin H, Karayianni K, Mitsea A, et al.
Diagnos-ing osteoporosis by usDiagnos-ing dental panoramic radio-graphs: the OSTEODENT project. Oral Surg Oral Med Oral Pathol Oral Radiol Endod. 2007. doi:10.1016/j.tripleo.2006.12.027
22. Sampaio Netto O, Coutinho LOL, Souza DC. Análise da nova classificação de laudos de den-sitometria óssea. Radiol Bras. 2007;40:23–5. 23. Kim JY, Nah KS, Jung YH. Comparison of
pan-orama radiomorphometric indices of the man-dible in normal and osteoporotic women. Korean J Maxillofac Radiol. 2004;34:69–74.