Vargas DM etal.
304
Rev Assoc Med Bras 2010; 56(3): 304-8*Correspondence: Rua Antônio da Veiga, 140 - Sala L-002
Victor Konder Blumenau-SC, Brazil CEP: 89012-900 Phone: (+ 55 47) 3321-0277
AbstrACt
Objective. The objective of this study was to analyze the secular trend of growth in height of military recruits enlisted in Blumenau and correlate it with the HDI index.
MethOds. This was a cross-sectional study of recruits aged 18 to 20 enlisted to the 23rd Infantry Battalion in Blumenau between 1963 to 2007. The sample comprised 600 out of a total of 3000
recruits enlisted over the period. Data were collected from individual enlistment iles on recruits which had been archived by year. Three years were analyzed from each decade (x3, x5, and x7) and the irst forty iles were selected systematically from each recruitment year for analysis. Statistical analysis was
with descriptive statistics, Student’s t test and simple linear regression.
Results. There was an increase of the order of 7 cm in the height of recruits in Blumenau over the last 47 years (from 1.7 meters in the 1960s to 1.77 meters in the 2000s) and the increase was most evident between the 1970s and 1980s. The mean heights in years in different decades exhibited a strong and positive correlation with the HDI in Blumenau and Brazil, which both increased progres-sively during the study period.
cOnclusiOn. The secular tendency in growth in height was positive in Blumenau and had a positive correlation with HDI.
KeyworDs: Growth. Height (stature). Military personnel. Human development.
the
seculaR
tRend
Of
gROwth
in
height
in
bluMenau
,
bRazil
,
and
its
RelatiOnship
with
the
huMan
develOpMent
index
(
hdi
)
deisi MaRia vaRgas,1* l
uiz feRnandO gaRcia lOpes aRena,2 a
na silveiRa sOncini3
Study conducted at the Department of Medicine, Universidade Regional de Blumenau, Blumenau, SC, Brazil
1. Doutora em Pediatria - Professora titular da Universidade Regional de Blumenau, Blumenau, SC 2. Graduando - Acadêmico do curso de Medicina da Universidade Regional de Blumenau, Blumenau, SC 3. Graduanda - Acadêmica do curso de Medicina da Universidade Regional de Blumenau, Blumenau, SC
Original Article
i
ntROductiOnThe term Secular Growth Trend (SGT) describes any change in body size or composition in a given population group over long time periods. Growth velocity and the height attained at different ages are phenotypes that are conditioned by genetic inheritance, to the extent that every person is born with a set potential for growth which is determined by the genotype inherited from their biological parents. However, this potential will only be fully realized if nutritional status is excellent, health status is good
and socioeconomic conditions are favorable.1
Studies of secular trends in growth are an important tool for analyzing the evolution of the physical health of populations and for highlighting social inequalities between different groups of
humans.2 The most important work on this subject has shown
that positive secular growth trends can be attributed, more than
anything, to the environmental inluences resulting from impro -vements in sanitary, economic and social conditions. Secular growth trends may reveal a range of different tendencies and
growth may be negative, positive or absent.3 A positive SGT is
associated with good living conditions, most notably health and
nutrition conditions.4.
In Brazil, studies have shown that there was a positive SGT
in the inal height attained by Navy recruits born between 1940 and 1965 in all ive of Brazil’s administrative regions and that the
increase differs between regions.5 The increase the inal height of
the people studied was 0.70 cm per decade for Brazil as a whole,
with 0.20 cm per decade in the Northeast region and 1.40 cm
per decade in the Mid-West. A study of young people born in São Paulo between 1950 and 1976 found a positive variation of
1.26 cm per decade.2 Variations in SGT within a single country
have also been observed in other developing countries. Studies show that in the most privileged population groups SGT remains
positive, in contrast with other groups.4
The living conditions of the Brazilian population have been
improving signiicantly over recent decades and this is illustrated
by the progressive increase in Brazil’s mean HDI over consecutive surveys. In 1960, Brazil’s mean HDI was 0.394 and reached
0.757 in 2000 and 0.813 in 2007.6,7 In the city of Blumenau,
the index was 0.674 in 1970 and 0.855 in 2000.7 This study
will describe the secular growth trend in height in the city of
Blumenau, with the objective of providing speciic regional data
theseculartrenDofgrowthinheightinbluMenau, brazil, anDitsrelationshipwiththehuManDeVelopMentinDex (hDi)
305
Rev Assoc Med Bras 2010; 56(3): 304-8
M
ethOdsThis was a cross-sectional study of recruits to the 23rd Infantry Battalion in Blumenau, SC, Brazil, from 1963 to 2007. Since military service is compulsory in Brazil, all young men must report to a Military Service Board during the year of their 18th birthday. The legal implications of failure to report for service mean that enlistment is almost universal among men in this age group. When recruits report to the military board, a
military enlistment ile is opened and certain phenotypical and sociodemographic characteristics are recorded. The iles are
archived at the recruiting unit.
At the 23rd Infantry Battalion in Blumenau, SC, the
indi-vidual iles are iled by year of enlistment. The iles contain
the following information: district of origin, date enlisted at the unit, date and location of birth, height in meters (with decimal
precision) and, in some iles, educational level. Anthropometry of the recruits was performed using a metal stadiometer ixed
to a mechanical balance on which they were weighed (to an accuracy of 100g). Measurements were taken with recruits unshod and in the presence of a physician. This information on anthropometry methods applies from the 1990s onwards (we did not locate information on the measurement procedure in previous decades). Three median years were analyzed from each decade: those ending in 3, 5 and 7. This technique was chosen to avoid sampling data from years close together in time but in different decades, which could lead to false interpretation of the results for those decades (for example: 1959 and 1961). The sample comprised 600 of the total of 3000 recruits, uniformly distributed across the years analyzed (margin of error < 3.5%).
The irst 40 iles for each year to be analyzed were selected syste
-matically. Enlistment iles were considered eligible if they related
to recruits aged 18 to 20 years who were born and resident in the city of Blumenau.
First the mean height was calculated for each year analyzed (x3, x5 and x7) and then the mean was calculated for each decade (1960s, 1970s, 1980s, 1990s and 2000s). The mean for each decade was then used to calculate a z-score for
height, against the Center for Disease Control (CDC) reference
igures.8 Student’s t test and simple linear regression were used
for statistical analysis, with the signiicance level set at p< 0.05. This research was submitted to the Ethics Committee at the
Universidade Regional de Blumenau under protocol number
018/07 and approved on April 4th, 2007.
R
esultsThe mean height of recruits in the city of Blumenau incre-ased progressively over the study period, by a total of 7 cm in 47 years or 1.4 cm/decade. The increase in height over this period exhibited distinct intensities at different points, with the greatest increment observed for the 1980s, with an increase of 4 cm over the previous decade. During the following decade, between the 1980s and 1990s, no variation was observed in mean height (Table 1).
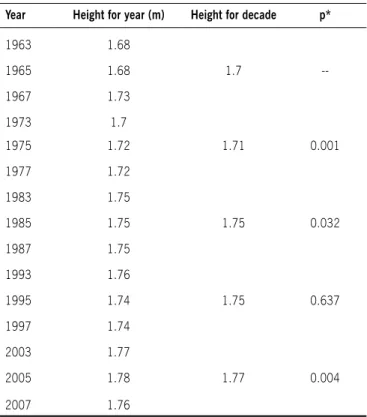
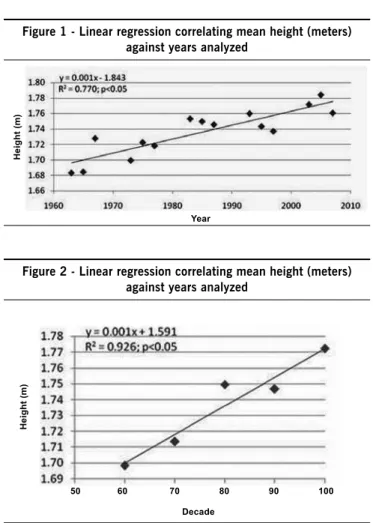
The simple linear regression equation demonstrated a strong positive correlation between mean height and years and decades (p< 0.05), showing a positive linear estimate for the secular growth trend in the study population (Figures 1 and 2).
Mean heights for the years 1973, 1983, 1993 and 2003
were correlated against the HDI igures for the closest available
year (1970, 1980, 1990 and 2000) for Brazil and for the city of Blumenau, and a strong, positive and linear correlation was
observed for both analyses (R2 = 0.992; p< 0.005) (Table 2).
When converted to standard deviations from the mean
provided by the CDC reference igures, there was a gain of 1
standard deviation over the study period. The mean height in the 1960s corresponded to -1.04 standard deviations (SD) from the mean for age and sex, rising to -0.89 SD in the 1970s, - 0.28 SD in the 1980s and 1990s and - 0.03 SD during the 2000s.
d
iscussiOnWe observed a positive secular growth trend among recruits enlisted in Blumenau over the last 47 years. During this time, mean height increased from 1.70 m in the 1960s to 1.77 m in the 2000s, which is an increase of 7 cm (1.40 cm/decade).
This increase in inal height may be related to improved living
conditions for this population, since we observed a strong corre-lation between mean height and mean local and national HDI for the decades studied. The greatest variation in stature took place between the 1970s and the 1980s, with a 4 cm increase, which coincides with the period during which the recruits who were
reaching their inal height had been born during the years of the
“Brazilian Economic Miracle” - between 1969 and 1973. Brazil’s HDI increased considerably from the 1970s to the 1980s, from 0.674 to 0.797.
table 1 - Distribution of mean heights in meters (m) by year and decade
Year Height for year (m) Height for decade p*
1963 1.68
1965 1.68 1.7
--1967 1.73
1973 1.7
1975 1.72 1.71 0.001
1977 1.72
1983 1.75
1985 1.75 1.75 0.032
1987 1.75
1993 1.76
1995 1.74 1.75 0.637
1997 1.74
2003 1.77
2005 1.78 1.77 0.004
2007 1.76
Vargas DM etal.
306
Rev Assoc Med Bras 2010; 56(3): 304-8Several different Brazilian studies conducted in different geographical locations have demonstrated positive SGT in height.
Recruits to the Brazilian Navy born between 1940 and 1965 increased in inal height by 1.40 cm in 25 years, or 0.56 cm/
decade. The increase varied by region, being most intense in the South and Southeast regions (1.20 and 1.80 cm respectively,
over the period) and weakest in the Northeast region (0.60 cm
over the period).5 In São Paulo, an increase in inal height has
been reported of 1.26 cm/decade or 3.42 cm between the 1960s Figure 1 - Linear regression correlating mean height (meters)
against years analyzed
Figure 2 - Linear regression correlating mean height (meters) against years analyzed
table 2 - Distribution of mean stature and mean HDI*by year
Year Height (stature) (m) HDI** blumenau HDI# brazil
1973 1.7 0.674 0.462
1983 1.75 0.797 0.695
1993 1.76 0.813 0.742
2003 1.77 0.855 0.752
*For the years 1970,1980,1990, and 2000. **Source: SEBRAE-SC, 2005. #Source:
UNDP, Human development report, 1998.
and 1980s. This variation is smaller than the increase in 5 cm
detected in inal height in Blumenau between these decades.
However, as in Blumenau, the greatest increase in stature was observed between the 1970s and the 1980s (2.90 cm/decade
in São Paulo and 3.00 cm/decade in Blumenau).2
Male adolescents aged 17 to 19 years enlisted to the Tiro
de Guerra (reserves) in the city of Viçosa in the state of Minas Gerais from 1995 to 2004, exhibited a height increase of 4.00 cm, which is double the 2cm observed in Blumenau between the 1990s and 2000s. A positive association was also observed between educational level and height in addition to a reduction
in the prevalence of short stature, from 28% to 11.6%.9 The
variation in stature of young people enlisted to the Army in the state of Pernambuco from the 1970s to the 1990s was 3.70 cm,
which is similar to the 4.00 cm variation observed in Blumenau.10
Marcondes et al.11 studied the evolution in the height of
people passed it for military service (Army) between 1979 and
1991 in 24 Brazilian states. The results demonstrated increases in stature in the majority of the states studies. The most impres-sive increases were observed in the states of Sergipe (4 cm), Minas Gerais (3.90 cm) and Mato Grosso (3 cm). The authors also observed that mean stature, whether in 1979 or in 1991,
did not pass the 50th percentile of the reference igures from the United States (National Center for Health Statistics) which is 1.78 m. In Blumenau, mean height at the end of the 1980s also did not exceed the United States standard.
While the majority of studies conducted in Brazil have detected positive SGT in height, one study of cohorts of high socioeconomic status people born in the city of Rio de Janeiro in
1930, 1940, 1950 and 1970 found a variation in inal height in 2 cm over 40 years, which did not attain statistical signiicance when means were compared. Notwithstanding, a positive and signiicant SGT in height was observed during the prepubescent
years, indicating an acceleration in the rate of acquisition of
height, which was not relected in inal height.12 It is probable that individual people will have completed their linear growth earlier, which in young females may have been translated into a reduction in age of menarche.
The variations in magnitude and timing of statural SGT incre-ases in Brazil can be attributed to variations in socioeconomic development in the different regions of the country. Although an HDI is given for Brazil as a whole, the indexes are highly
variable depending on geographic location, with igures oscilla -ting between regions, states and municipalities, which have developed differently over the decades.
The phenomenon of positive SGT is not exclusive to Brazil. Over the last 150 years, a progressive trend in increased stature has been observed among people in Western industrialized nations and in developing countries. The mean rates, predo-minantly relating to European populations, vary depending on
age and socioeconomic strata.13 Studies of the height of recruits
in European countries are concentrated between 1960 and 1975 and show considerable increases in mean height over the period, following different patterns in different countries. Dutch recruits exhibited the greatest mean height at the end of this period (1.80 m), followed by Swedish recruits (1.78 m). In these two countries the trend was 1.37 and 0.99 cm/decade.
Norway and France are part of an intermediate block with a trend
H
e
ig
h
t
(m
)
Year
H
e
ig
h
t
(m
)
Decade
theseculartrenDofgrowthinheightinbluMenau, brazil, anDitsrelationshipwiththehuManDeVelopMentinDex (hDi)
307
Rev Assoc Med Bras 2010; 56(3): 304-8
of 0.88 cm/decade. Trends in the other countries studied were as follows: Belgium (0.74 cm/decade), Italy (0.64 cm/decade)
and Denmark (0.53 cm/decade).14 During the same period, the
mean height of recruits in Blumenau varied from 1.70 m in the 1960s to 1.71 m in the 1970s.
During the 1980s, the HDI of the countries listed above were higher than Brazil’s HDI: Holland 0.873; Sweden 0.872;
Norway 0.877; France 0.863; Belgium 0.861; Italy 0.846 and
Denmark 0.876. During the same decade, the HDI for Brazil was 0.685 and Blumenau’s HDI was 0.797. In 2000, the HDI in Blumenau reached levels close to those of these European countries, at 0.855; while the HDI for Brazil was 0.750. It is therefore to be expected that, genetic potential permitting, if the HDI of Brazil continues to increased progressively we will
continue to observe increases in the inal height of Brazilians
over the next few decades.
It is interesting that the increased greatest variation in mean height observed between decades coincided with the greatest variation in HDI, both for the municipality and for the nation. Between 1979 and 2005 an increase of 3.2 cm for the period,
or 1.2 cm per decade, was observed in the inal height of men,15 which is comparable to Blumenau if one considers that the varia-tion between the 1980s and 2000s was 2 cm or 1 cm/decade. The variation in HDI was also similar: 26.6% in Bluemenau and 22.8 % in China. Another Chinese study, conducted in Shandong
province, detected an increase of 4.67 cm in the inal height of
men at 18 years of age from 1985 to 2005.16
A positive SGT in height has also been observed during
chil-dhood and adolescence, both in Brazil and in other countries.17
Monteiro et al. analyzed household surveys from São Paulo covering 22 years (1974 to 1996) and found that 5-year-old children had a mean height that was 2.3 cm greater,
corres-ponding to a 0.650 z-scoreon the international reference.1 In
Paulínia, SP, when male schoolchildren aged 6 to 12, studied in 1979 and 1980, were compared with children in 1993 and 1994, a positive SGT for height was observed of the order of
1.13 to 5 cm per decade.4 In the Seychelles, in the Indian Ocean,
adolescents aged 15.5 years were compared between 1956 and 2006 (1956 and 1957, 1998 and 1999 and 2005 and 2006) demonstrating a positive SGT. Between the 1950s and 1990s there was an increase in height of 1.62 cm/decade and 1.14cm/
decade between the 1990s and 2000s.18 In Turkey, male
scho-olchildren aged 7 to 15 years between 1993 and 2003, had
increased in stature by 1.7 to 5.5cm/decade.19 Although the
literature demonstrates a worldwide trend towards an increase
in the inal height of people, there are still reports of negative or
absent SGT in height during critical periods. Analyses conducted in Croatia show that SGT in height was absent between 1991
and 200320 and negative for children who were aged from 2.5
to 4 years during the war in Croatia.21
c
OnclusiOnsSumming up, the SGT for height in Blumenau was positive between the end of the twentieth century and the start of the
twenty-irst, with a strong positive association with HDI. During
this period, the mean height of the young men from Blumenau increased 7 cm or 4.1% while HDI increased by approximately 26.6% in Blumenau and 62.0% in Brazil as a whole. Despite
the positive SGT, mean height remains below that of developed countries with superior HDI.
No conlicts of interest declared concerning the publication of this article.
R
efeRences1.Monteiro CA, Conde WL. Secular trends in postnatal growth in S. Paulo city, Brazil (1974-1996). Rev Saúde Pública. 2000,34(6):41-51.
2. França Júnior I, Silva GR, Monteiro CA. Secular trends in the adult height of children born in S. Paulo city, Brazil, from 1950 to 1976. Rev Saúde Pública. 2000;34(6):102-7.
3. Malina R M. Research on secular trends in auxology. Anthropolgischer Anzeiger.1990;48:209-27.
4. Marmo DB, Zambon MP, Morcillo AM, Guimarey LM. Tendência Secular de cres-cimento em escolares de Paulínea, São Paulo-Brasil (1979/80 - 1993/94). Rev Assoc Med Bras. 2004;50(4):386-90.
5. Kac G. Secular trends in the stature of Brazilian Navy recruits born from 1940 to 1965. Cad Saúde Pública. 1998;14(3):565-73.
6. PNUD Brasil. Brasil melhora IDH, mais cai no ranking. Nov. 2006. [citado out 2009]. Disponível em: http://www.pnud.org.br/pobreza_desigualdade/ reportagens/index.php?id01=2388&lay=pd.
7. Blumenau em números: uma coletânia dos principais indicadores nos últimos anos. Blumenau: SEBRAE; 2005.
8. U.S. Department of Health and Human Services. Centers for Disease Control and Prevention (CDC). National Center for Health Statistics (NCHS). [cited 2009 oct]. Available from: http://www.cdc.gov/growthcharts.
9. Bianka-Caliman S, Castro-Franceschini SC, Priori SE. Tendência secular do crescimento em adolescentes do sexo masculino: ganho estatural e ponderal, estatdo nutricional e sua relação com a escolaridade. Arch Latinoam Nutr. 2006;56(4):321-8.
10. Figueiró AC. Peril do crescimento dos jovens alistados no exército no Estado de Pernambuco entre 1979 e 1990. [dissertação] Recife: Faculdade de Nutrição, Universidade Federal de Pernambuco; 1994.
11. Marcondes E, Marques RM. Estudo antropométrico de indivíduos aptos para o serviço militar no período de 1979 a 1991. Rev Bras Crescimento Desenvolv Hum. 1993;2(1):9-38.
12. Espin Neto J. Tendência secular do crescimento em escolares de alto nível socioeconômico [tese]. 2001.Campinas: Faculdade de Ciências Médicas, Universidade Estadual de Campinas; 2001.
13. Kac G. Secular height trend: a literature review. Cad Saúde Pública.1999; 15(3):451-61.
14. Floud R. The heights of Europeans since 1750: a new source for European economic history. National Bureau Economic Research. 1984;1318:1-31. 15. Ji CY, Hu PJ, He ZH. Secular growth trends in the Chinese urban youth
and its implication on public health. 2007. Beijing Da Xue Xue Bao. 2007;39(2):126-31. Abstract.
16. Zhang Y, Wang S. Secular trends in growth and body composition amomg children and adolescents from 1985 to 2005 in Shandong, China. Anthropol Sci. 2009;117(2): 69-76.
17. Monteiro CA, Conde WL. Tendência secular do crescimento pós-natal na cidade de São Paulo (1974-1996). Rev Saúde Pública. 2000;34(6 Supl):41-51. 18. Marques-Vidal P, Medeleine G, Romain S, Gabriel A, Bovet P. Secular trends in
height and weight among children and adolescents of the Seychelles, 1956-2006. BMC Public Health. 2008;8:16619. Sinsek F, Ulukol B, Gulnar SB. The secular trends in height and weight of Turkish school children during 1993-2003. Child Care Health Dev. 2005;31(4):441-7.
20. Jakić M, Jakić M. Secular growth trend in urban children enrolling in primary school in the war time. 2006. Acta Med Croatica. 2006;60(3):195-9. Abstract.
21. Jovanović H, Prebeg Z, Stanić I, Vuletić G. Impact of war on growth patterns in school children in Croatia. Coll Antropol. 2003;27(2):573-9.