OCCURRENCE OF PHONOLOGICAL ERRORS
ACCORDING TO SEVERITY IN CHILDREN WITH
SPEECH SOUND DISORDER
Ocorrência de erros fonológicos de acordo com a gravidade em
crianças com transtorno fonológico
Haydée Fiszbein Wertzner(1), Perla Isabel dos Santos(2), Luciana de Oliveira Pagan-Neves(3)
(1) Department of Physiotherapy, Communication Science
& Disorders, Occupational Therapy, Faculty of Medicine, Universityof São Paulo, São Paulo, SP, Brazil.
(2) Department of Physiotherapy, Communication Science
& Disorders, Occupational Therapy, Faculty of Medicine, University of São Paulo, São Paulo, SP, Brazil.
(3) Department of Physiotherapy, Communication Science
& Disorders, Occupational Therapy, Faculty of Medicine, University of São Paulo, São Paulo, SP, Brazil.
Conlict of interest: non-existent
are the sound substitution, omission or distortion and
may occur because an underlying dificulty with the
organization of phonological rules and/or auditory perception and/or speech production3,4.
The use of simpliication of the phonological rules,
called phonological processes (PP), is maintained
after the expected age of acquisition in children with
SSD and sometimes idiosyncratic processes may occur. There are different types of PP that may affect more or less the speech intelligibility5 and involve
sound´s substitution and omission.
Distortion is the third type of speech error
referred to be a phonetic dificulty characterized by
the articulatory imprecision during the production of
speciic sounds. Distortion does not represent a difi
-culty with the application of the phonological rules and does not commit the meaning of the words6.
INTRODUCTION
The Speech Sound Disorders (SSD) is a speech and language disorder that is one of the most
common dificulties in developing children. The
disorder may be characterized by the presence of at least one atypical error (errors that are not observed for the typically developing children1,2. Those errors
ABSTRACT
Purpose: to describe and quantify speech errors in children with speech sound disorder according to severity calculated by the indexes percentage of consonants correct revised and process density index and also to determine whether children with different degrees of severity differ in the predominant
error observed during speech production. Methods: speech samples of 21 children aged between
5;2 and 7;11 years-old with speech sound disorder were analyzed. Absolute indexes of substitution, omission and distortion, percentage of consonants correct revised and process density index were calculated based on two phonology tasks (picture naming and imitation of words). Results: there
were differences in the predominant type of error in speech indicating that substitution was the most occurring type of error. Substitution was the most frequent type of error for the most severe children while for the less severe ones the study did not indicate a prevalent type of error. The analysis of the
total sample the correlation analysis indicated that the higher the occurrence of substitution less the number of distortion. Conclusion: in general terms substitution was the most frequent type of error.
Equivalence of the type of errors was observed for the less sever children while substitution was the most frequent type of error for the more sever group of children. Absolute indexes were effective and eficient to indicate the most frequent type of error according to the severity of the disorder.
results. All children were monolingual Brazilian
Portuguese learners.
Phonology test analysis was based on video
camera (JVC, model Everio) and audio (Panasonic, model RR-US450) recordings coupled to a Sennheiser (e-817) microphone obtained from the
irst initial evaluation of the children.Speech samples were transcribed to verify phonetic and phonological inventory systems. At the words imitation task children were asked to repeat 39 words (107 conso
-nants) and at the picture naming task, 34 pictures (90 consonants) were named. Transcriptions were
manually done by a student from the fourth grade of the Speech, Language and Audiology course of the University and also by a student from the post-graduation course of the same University.
Accordance above 90% between transcriptions was required for the child to be able to participate on the
study.
After transcriptions the types of errors were classiied, the number of phonological processes was counted and PCC-R, PDI, Absolute indexes
of substitution (ASI), distortion (ADI) and omission
(AOI) were calculated.
PCC-R was calculated by the division of the number of correct consonants (distortions were
considered as correct productions) by the total
number of consonants from the words imitation task (107 consonants) and the picture naming task (90
consonants) multiplied by 100.
Absolute indexes were calculated by the number of speciic errors (substitution for ASI; omission
for AOI; distortion for ADI) by the total number of
possible errors in each task separately multiplied by
100.
The calculus of PDI was based on the division of
the number of phonological processes by the total
number of words in each task (39 words for word imitation task and 34 for the picture naming task).
Children were distributed in groups according to the percentual range measured with the PCC-R. Group 1 (G1) participants were ive children with PCC-R above 85%, group 2 (G2) were nine children with PCC-R between 84-65%, group 3 (G3) were ive children with PCC-R between 64-50% and group 4 (G4) with only two remaining children with PCC-R below 49%. G4 children were not included
for the inferencial comparisons intra and intergroups
but these two subjects were included on the analysis
involving the total sample of participants.
Results were submitted to the following analysis (signiicance level adopted 0.05 and 95%coni
-dence interval): Spearman Correlation test was used to verify the correlation of the different indexes between the two phonology tasks; Friedman test was used to compare the performance measured by
Researches points to evidences of different types of SSD5,7. Some of them8,9 consider that such
differ-entiation must be related to the underlying causes,
while others7,10 argue that it should be based on the
cognitive-linguistic dificulties.
Severity calculus is one aspect that may assist
in the identiication of different types of SSD. Some
used measures described by the literature are the percentage of Consonants Correct (PCC)5,11,12, the
absolute indexes of distortion, omission and substi -tution5and the Process Density Index (PDI)13.
PCC-R14 is a revised version of the PCC
and accounts as errors only substitutions and omissions5,11-13. Absolute indexes (AI) proposed by
the same authors are calculated by the division of
the number of speciic errors (omissions, distortions
or substitutions) by the number of sounds of the speech sample5.
PDI14,15 relects the frequency of use of the
phonological processes on a speech sample and is calculated based on the number of phonological
processes divided by the number of words.
Considering the heterogeneity of SSD the
present study aimed to describe and to quantify the number of speech sound errors in children with
SSD according to the children´s performance in
the severity indexes PCC-R and PDI determining whether different degrees of severity interfere on the occurrence of a speciic type of sound error.
METHODS
This retrospective and transversal research was
approved by the Ethics Commission for the Analysis
of Research Projects (CAPPesq) of the Clinical
Board of the Clinical Hospital of the School of
Medicine of the University of São Paulo (#229/11). Written, informed consent was obtained from a
parent of each participant.
Participants were 21 male and female children aged between 5:2 and 7:11 years-old. Data used
at the present study are from the initial evaluation
of the children before they were enrolled in any speech therapy. Tests applied at that moment were: phonology (picture naming and words imitation tasks), vocabulary, luency and pragmatics tests
from the Infantile Language Test (ABFW)16 and the
evaluation of a spontaneous speech sample.
Inclusion criteria for this group was: diagnostic of SSD between the years of 2007 and 2010; age from
5:0 to 7:11 years old; no previous speech-language intervention; PCC-R in the same percentage range
on both phonology tasks (picture naming and words imitation) adequate performance in other aspects of language (vocabulary, luency and pragmatics) on
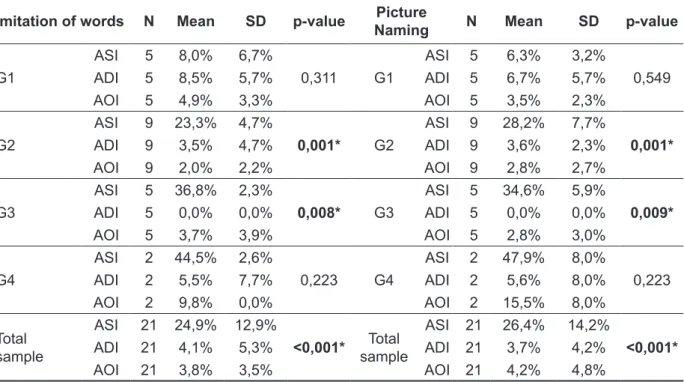
observed in Table 1. Evidences pointed out to differ-ences in G2, G3 and total sample (including G4). ASI
was on average higher than the ADI and AOI in both phonology tasks. G4 mean values of the indexes are described in Table 1 but they were not analyzed due to the small sample (only two subjects).
Comparison two by two was used to identify
the differences at G2, G3 and total sample (Table
2). Differences were observed for the ASI values
compared to those of AOI and ADI in both phonology
tasks. the indexes among the different groups of children
on both phonology tasks; Wilcoxon test determined which indexes differentiated groups and Kruskal-Wallis test was applied to compare indexes among groups. Mann-Whitney was used for the cases of
difference.
RESULTS
Intragroup analysis
The indexes ASI, AOI and ADI were compared
for each group (G1, G2, G3 and total sample) as
Table 1- Intragroup comparison between the absolute indexes values for both picture naming and imitation of words tasks
Imitation of words N Mean SD p-value Picture
Naming N Mean SD p-value
G1
ASI 5 8,0% 6,7%
0,311 G1
ASI 5 6,3% 3,2%
0,549
ADI 5 8,5% 5,7% ADI 5 6,7% 5,7%
AOI 5 4,9% 3,3% AOI 5 3,5% 2,3%
G2
ASI 9 23,3% 4,7%
0,001* G2
ASI 9 28,2% 7,7%
0,001*
ADI 9 3,5% 4,7% ADI 9 3,6% 2,3%
AOI 9 2,0% 2,2% AOI 9 2,8% 2,7%
G3
ASI 5 36,8% 2,3%
0,008* G3
ASI 5 34,6% 5,9%
0,009*
ADI 5 0,0% 0,0% ADI 5 0,0% 0,0%
AOI 5 3,7% 3,9% AOI 5 2,8% 3,0%
G4
ASI 2 44,5% 2,6%
0,223 G4
ASI 2 47,9% 8,0%
0,223
ADI 2 5,5% 7,7% ADI 2 5,6% 8,0%
AOI 2 9,8% 0,0% AOI 2 15,5% 8,0%
Total sample
ASI 21 24,9% 12,9%
<0,001* Total
sample
ASI 21 26,4% 14,2%
<0,001*
ADI 21 4,1% 5,3% ADI 21 3,7% 4,2%
AOI 21 3,8% 3,5% AOI 21 4,2% 4,8%
Legend: *signiicance, SD-standard deviation, N-number of subjects, ASI-absolute substitution index, AOI- absolute omission index, ADI- absolute distortion index.
Statistical Test: Friedman test
Table 2– Two by two comparison across the absolute indexes measurement for both picture naming and imitation of words tasks
Imitation of words task Picture naming task
ASI ADI ASI ADI
G2 ADI 0,008* G2 ADI 0,008*
AOI 0,008* 0,600 AOI 0,008* 0,610
G3 ADI 0,043* G3 ADI 0,043*
AOI 0,042* 0,068 AOI 0,043* 0,109
Total sample ADI <0,001* Total sample ADI <0,001*
AOI <0,001* 0,877 AOI <0,001* 0,897
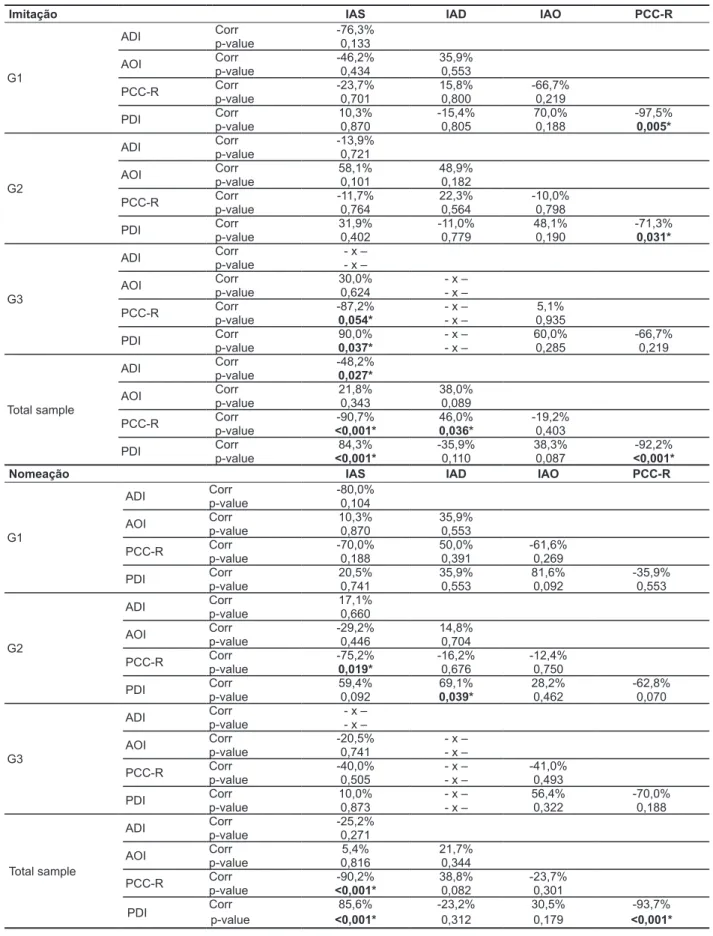
The correlations between the AI, the PCC-R and
the PDI for each group and also for the total sample
in the two phonology tasks are presented in Table 3.
Strong positive correlation17for G1 and moderate
for G2 was observed between PCC-R and PDI in the words imitation task. For the G3 strong positive correlation was veriied between PDI and ASI and strong negative correlation between PCC-R and ASI. Strong positive correlation was observed for the total sample of subjects between PDI and ASI, strong negative correlation between PCC-R and PDI and also Between PCC-R and ASI, weak positive correlation between PCC-R and ADI and, weak negative correlation between ADI and ASI.
For the picture naming task mild positive corre
-lation was noted between PDI and ADI and mild negative correlation between PCC-R and ASI for the G2. At the total sample of subjects analysis positive strong correlation was observed between PDI and ASI and strong negative correlation between PCC-R and ASI between PCC-R and PDI. No other correlation was found for both the G1 and the G3.
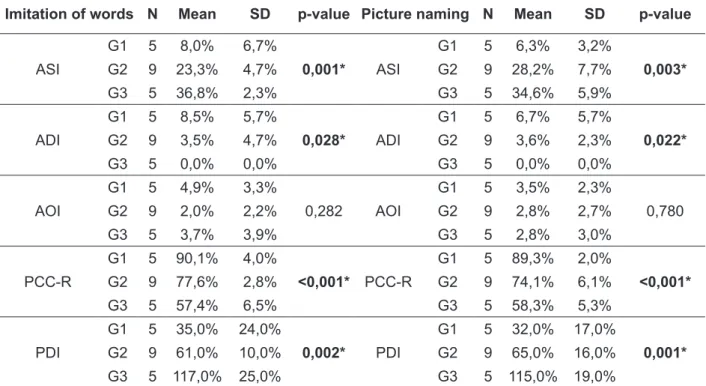
Intergroup analysis
Signiicant differences were observed in both phonology tasks for the indexes ASI and PDI with
a punctuation order of G1<G2<G3. For the PCC-R
and ADI the punctuation order was for the groups was G1>G2>G3 (Table 4).The AOI was not different between groups.
The comparison two by two between groups for the indexes that were different is presented in Table 5. Results indicated differences between groups for all the indexes.
DISCUSSION
This study indicated that children with SSD and
PCC-R in different ranges present differences in relation to the predominant speech error. Results
pointed out that substitution was the most occurring error in the speech of children with SSD.
The most sever groups G2 and G3 presented
substitution as the most occurring type of error while for the G1, the less severe group of children, we
observed a similar occurrence of both substitution and omission. The correlation analysis of the total
sample of subjects indicated that the higher the occurrence of substitutions, the lower is the number
of distortions.
The occurrence of ADI was higher in the less
severe group of children (G1). The fact that this group
of children, who presented PCC-R higher than 85%,
produced more distortions than the others demon-strate that even the less severe children are still
facing a phase of motor speech reinement2,18that
may be present in children up to 16 years of age19. It is important to remember that substitution of consonantal sounds generally result in a great
speech unintelligibility that may inluence the quali
-tative classiication of severity in children with SSD20.
The high occurrence of substitutions in children
with SSD may relect a cognitive-linguistic dificulty
associated to an auditory perceptual or to a motor
speech dificulty or even to an inter-relation between the three of them. When the underlying dificulty is a cognitive-linguistic deicit the child has dificulty in
understanding and using phonological rules2,18,21.
The underlying dificulty based on an auditory perceptual dificulty (usually derived from otitis
media episodes) interferes on the establishment of
stable phonological representation which provide
the basis for the verbal learning22,23.
The dificulties based on motor speech deicits are usually speciic and related to the absence of one or more phonemes or even to the dificulty with the articulation rate which may point to coarticulatory
problems24.
Considering that the effectiveness of speech
relects the proper interaction of the three processings
(the cognitive-linguistic, auditory perceptual and the
motor speech) there is evidence that children with SSD exhibit a dificulty associated to the network link between these processings. It is important to say that the commitment of one speciic processing interferes on the whole system functioning since there is a huge interaction between them25,26.
The strong negative correlation (for the children from G1 and for the total sample of children) and
moderate (for the children from G2) for the indexes PDI and PCC-R showed that the greater the occur -rence of phonological processes, the smaller is the
number of phonemes correctly produced27-29. This
inding indicates a commitment of the substituted sound in relation to its use within the phonological system of the language which result in a damaged
message.
The presence of a strong positive correlation
between the ASI and the PDI and strong negative between ASI and PCC-R in both phonology tasks for the total sample of children with SSD reinforces the
fact that the substitution is the most occurring type of error contributes to the severity of the children
with SSD5.
Data analysis based on the total sample of
children showed weak negative correlation between the indexes ASI and ADI in the imitation indicating
Table 3 – Intragroup correlation for the indexes, PCC-R and PDI for both picture naming and imitation of words tasks
Imitação IAS IAD IAO PCC-R
G1
ADI Corr -76,3%
p-value 0,133
AOI Corr -46,2% 35,9%
p-value 0,434 0,553
PCC-R Corr -23,7% 15,8% -66,7%
p-value 0,701 0,800 0,219
PDI Corr 10,3% -15,4% 70,0% -97,5%
p-value 0,870 0,805 0,188 0,005*
G2
ADI Corr -13,9%
p-value 0,721
AOI Corr 58,1% 48,9%
p-value 0,101 0,182
PCC-R Corr -11,7% 22,3% -10,0%
p-value 0,764 0,564 0,798
PDI Corr 31,9% -11,0% 48,1% -71,3%
p-value 0,402 0,779 0,190 0,031*
G3
ADI Corr - x –
p-value - x –
AOI Corr 30,0% - x –
p-value 0,624 - x –
PCC-R Corr -87,2% - x – 5,1%
p-value 0,054* - x – 0,935
PDI Corr 90,0% - x – 60,0% -66,7%
p-value 0,037* - x – 0,285 0,219
Total sample
ADI Corr -48,2%
p-value 0,027*
AOI Corr 21,8% 38,0%
p-value 0,343 0,089
PCC-R Corr -90,7% 46,0% -19,2%
p-value <0,001* 0,036* 0,403
PDI Corr 84,3% -35,9% 38,3% -92,2%
p-value <0,001* 0,110 0,087 <0,001*
Nomeação IAS IAD IAO PCC-R
G1
ADI Corr -80,0%
p-value 0,104
AOI Corr 10,3% 35,9%
p-value 0,870 0,553
PCC-R Corr -70,0% 50,0% -61,6%
p-value 0,188 0,391 0,269
PDI Corr 20,5% 35,9% 81,6% -35,9%
p-value 0,741 0,553 0,092 0,553
G2
ADI Corr 17,1%
p-value 0,660
AOI Corr -29,2% 14,8%
p-value 0,446 0,704
PCC-R Corr -75,2% -16,2% -12,4%
p-value 0,019* 0,676 0,750
PDI Corr 59,4% 69,1% 28,2% -62,8%
p-value 0,092 0,039* 0,462 0,070
G3
ADI Corr - x –
p-value - x –
AOI Corr -20,5% - x –
p-value 0,741 - x –
PCC-R Corr -40,0% - x – -41,0%
p-value 0,505 - x – 0,493
PDI Corr 10,0% - x – 56,4% -70,0%
p-value 0,873 - x – 0,322 0,188
Total sample
ADI Corr -25,2%
p-value 0,271
AOI Corr 5,4% 21,7%
p-value 0,816 0,344
PCC-R Corr -90,2% 38,8% -23,7%
p-value <0,001* 0,082 0,301
PDI Corr 85,6% -23,2% 30,5% -93,7%
p-value <0,001* 0,312 0,179 <0,001*
Legend: *signiicance, ASI-absolute substitution index, AOI- absolute omission index, ADI- absolute distortion index, PCC-R-percen
-tage of consonants correct revised, PDI-process density index, Corr-correlation.
Table 4- Comparison between groups for the indexes, PCC-R and PDI for both picture naming and imitation of words tasks
Imitation of words N Mean SD p-value Picture naming N Mean SD p-value
ASI
G1 5 8,0% 6,7%
0,001* ASI
G1 5 6,3% 3,2%
0,003*
G2 9 23,3% 4,7% G2 9 28,2% 7,7%
G3 5 36,8% 2,3% G3 5 34,6% 5,9%
ADI
G1 5 8,5% 5,7%
0,028* ADI
G1 5 6,7% 5,7%
0,022*
G2 9 3,5% 4,7% G2 9 3,6% 2,3%
G3 5 0,0% 0,0% G3 5 0,0% 0,0%
AOI
G1 5 4,9% 3,3%
0,282 AOI
G1 5 3,5% 2,3%
0,780
G2 9 2,0% 2,2% G2 9 2,8% 2,7%
G3 5 3,7% 3,9% G3 5 2,8% 3,0%
PCC-R
G1 5 90,1% 4,0%
<0,001* PCC-R
G1 5 89,3% 2,0%
<0,001*
G2 9 77,6% 2,8% G2 9 74,1% 6,1%
G3 5 57,4% 6,5% G3 5 58,3% 5,3%
PDI
G1 5 35,0% 24,0%
0,002* PDI
G1 5 32,0% 17,0%
0,001*
G2 9 61,0% 10,0% G2 9 65,0% 16,0%
G3 5 117,0% 25,0% G3 5 115,0% 19,0%
Legend: *signiicance, ASI-absolute substitution index, AOI- absolute omission index, ADI- absolute distortion index, PCC-R-percen
-tage of consonants correct revised, PDI-process density index, SD-standard deviation Statistical Test: Kruskal-Wallis test.
Table 5- Two by two comparison across groups for the absolute indexes, PCC-R and PDI measurements for both picture naming and imitation of words tasks
Imitation of words task Picture naming task
G1 G2 G1 G2
ASI G2 0,004* ASI G2 0,003*
G3 0,009* 0,003* G3 0,009* 0,142
ADI G2 0,116* ADI G2 0,343
G3 0,018* 0,052* G3 0,019* 0,012*
PCC-R G2 0,003* PCC-R G2 0,003*
G3 0,009* 0,003* G3 0,009* 0,003*
PDI G2 0,052* PDI G2 0,008*
G3 0,009* 0,003* G3 0,009* 0,003*
Legend: *signiicance, ASI-absolute substitution index, AOI- absolute omission index, ADI- absolute distortion index, PCC-R-percen
-tage of consonants correct revised, PDI-process density index.
Statistical Test: Mann-Whitney test.
Furthermore, no differences between the types
of errors for the children of G1 and high PCC-R
values were observed. However, when looking at the absolute value of the ADI we veriied that the measure of this index was higher for G1compared
to G2 and G3 indicating that these are in an attun-ement phase of the phonological rules. It is also possible to suggest that the children from G2 and
G3 who had the highest number of substitutions
present more dificulty in the interaction between the
cognitive-linguistic aspects of speech.
Evidences pointed to the fact that children from G1 have a higher number of correct consonants
and fewer occurrence of phonological processes
the types of errors but, when compared to the more severe children with PCC-R below 85%, showed
more distortion and less number of substitutions. On the other hand the most severe participants from the study demonstrated greater occurrence of
substitu-tions, and those with PCC-R between 64 and 50%
had no distortion at all.
The ASI, ADI and AOI indexes were both effective and eficient to indicate the type of the most frequent type of error according to the SSD severity measured by the indexes PCC-R and PDI. Further studies with a larger sample of subjects should be
conducted in order to detail the linguistic
character-istics of Brazilian Portuguese-speaking children with
SSD. number of consonants produced correctly, resulting
in a commitment of the speech intelligibility.
The absolute indexes of substitution, omission and distortion were effective and eficient to identify the types of the most frequent types of errors in children with SSD with varying degrees of severity.
CONCLUSION
The results from the present study indicated that
Brazilian Portuguese- speaking children with SSD
have the substitution as the most prevalent type of
error. The less severe children with PCC-R index greater than 85% showed equivalence between
RESUMO
Objetivo: descrever e quantiicar os erros de fala de crianças com transtorno fonológico de acordo
com seu desempenho no índice porcentagem de consoantes corretas-revisado e process density
index, além de determinar se as crianças com diferentes graus de gravidade diferem quanto ao erro articulatório predominante na fala. Métodos: foram analisadas as amostras de fala de 21 crianças com transtorno fonológico de ambos os gêneros, com idades entre 5;2 e 7;11 anos. A partir de duas provas de fonologia (nomeação de iguras e imitação de palavras) foram calculados os índices absolu
-tos de substituição, omissão e distorção, a porcentagem de consoantes corretas-revisado e o process density index. Resultados: houve diferenças quanto ao tipo de erro predominante na fala indicando que a substituição foi o tipo de erro mais ocorrente. Para as crianças com maior gravidade a substi
-tuição foi o tipo de erro de fala predominante e, para aquelas com grau menor gravidade, observou
--se ocorrência semelhante dos diferentes tipos de erros. Na análise da amostra total as correlações apontaram que quanto maior a ocorrência de substituição menor o número de distorção. Conclusão: de forma geral, a substituição foi o tipo de erro mais ocorrente. As crianças menos graves apresen
-taram equivalência entre os tipos de erros e as mais graves, maior ocorrência de substituições. Os índices absolutos foram efetivos e eicientes para indicar o tipo de erro mais frequente em função da
gravidade do transtorno.
DESCRITORES: Linguagem Infantil; Transtornos da Linguagem; Testes de Linguagem; Otite Média;
Avaliação
REFERENCES
1. Dodd B. Differentiating speech delay from disorder: does it matter? Topics in Language
Disorders. 2011;31(2):96-111.
2. Wertzner HF, Pagan-Neves LO. Differentiating speech delay from disorder: does it matter? Rev
Soc Bras Fonoaudiol. 2011;16(4):490-1.
3. Fey ME. Phonological and treatment articulation
and phonology: inextricable constructs in
speech pathology. Lang Speech Hear Serv
Sch.1992;23:225-32.
4. Shriberg LD, Fourakis M, Hall SD, Karlsson HB,
Lohmeier HL Mcsweeny JL et al. Extensions to the Speech Disorders Classiication System (SDCS). Clin Linguist Phonet. 2010; 24(10):795-824.
5. Shriberg LD. Four new speech and prosody-voice measures for genetics research and other studies in developmental phonological disorders. J Speech
Lang Hear Res. 1993;36:105-40.
6. Wertzner HF, Sotelo MB, Amaro L. Analysis of
distortions in children with and without phonological disorders. Clinics. 2005;60(2):93-102.
7. Dodd B, Mcintosh B. The input processing,
Received on: September 10, 2012 Accepted on: May 16, 2013
Mailing address:
Haydée FiszbeinWertzner
R. Cipotânea,51 – Cidade Universitária – Butantã
São Paulo – SP – Brasil
CEP: 05360-160
E-mail: [email protected]
with speech dificulty. Int J Speech Lang Pathol. 2008;10(3):169-78.
8. Shriberg LD. Classiication and misclassiication of child speech sound disorders. Paper presented at the America Speech-Language-Hearing Association Convention, Atlanta, GA, November 2002.
9. Shriberg LD et al. Toward diagnostic and phenotype markers for genetically transmitted speech delay. J
Speech Lang Hear Res. 2005;48:834-52.
10. Broomield J, Dodd B. The nature of referred subtypes of primary speech disability. Child Lang Teach Ther. 2004;20(2):135-51.
11. Shriberg LD, Kwiatkowski J. Phonological
disorders I: A diagnostic classiication system. J Speech Lang Hear Disorders. 1982;47:226-41.
12. Shriberg LD, Kwiatkowski J. Phonological disorders III: a procedure for Assessing severity of involvement. J Speech Lang Hear Disorders.
1982;47:256-70.
13. Edwards ML. Phonological assessment and treatment in support of phonological processes.
Lang Speech Hear Serv Sch. 1992;23(3):233-40.
14. Shriberg LD et al. The percentage of consonants
correct (PCC) metric: extensions and reliability data. J Speech Lang Hear Res. 1997;40:708-22.
15. Wertzner HF, Papp ACCS, Galea DES. Provas
de nomeação e imitação como instrumentos de diagnóstico do transtorno fonológico. Rev Pró-Fono
Atual Cient. 2006;18(3):303-12.
16. Andrade CRF, Bei-Lopes DM, Fernandes FDM, Wertzner HF. ABFW: Teste de Linguagem Infantil
nas Áreas de Fonologia, Vocabulário, Fluência e Pragmática. São Paulo: Pró-Fono; 2004.
17. Field A. Descobrindo a estatística usando o
SPSS. . Tradução Lorí Viali. 2ª. Ed. Porto Alegre: Artmed, 2009. 688p.
18. Shriberg LD et al. Perceptual and acoustic reliability estimates for the Speech Disorders
Classiication System (SDCS). Clin Linguist Phonet.
2010;24(10):825-46.
19. Kent RD. Motor control: neurophysiology and
functional development. In: Caruso, A Strand, E. Clinical management of motor speech disorders
in children. New York: Thieme Medical Publishers, 1999.
20. Rvachew S, Chiang P, Evans N. Characteristics
of speech errors produced by children with and without delayed phonological awareness skills. Am
Speech Lang Hear Assoc. 2007;38:60-71.
21. Wertzner HF, Ramos ACO, Amaro L. Índices
fonológicos aplicados ao desenvlovimento fonológico típico e ao transtorno fonológico. Rev Soc Bras Fonoaudiol. 2004b;9(4):199-204.
22. Shriberg LD, Flipsen PJ, Kwiatkowski J,
Mcsweeny JL. A diagnostic marker for speech delay associated with otitis media with effusion:
the intelligibilityspeech gap. Clin Ling Phonetics. 2003;17(7):507-28.
23. Shriberg LD, Kent RD, Karlsson HB, Mcsweeny
JL, Nadler CJ, Brown RL. A diagnostic marker for speech delay associated with otitis media with effusion: backing of obstruents. Clin Ling Phonetics.
2001;15(8):631-50.
24. Smith A. Speech motor development: Integrating muscles, movements, and linguistic units. J Com
Dis. 2006;39:331-49.
25. Dodd B, McCormack P. A model of the speech processing for differential diagnosis of phonological disorders. In: Dodd B. Differential diagnosis and
treatment of children with speech disorder. London: Whurr; 1995.p. 65-89.
26. Dodd B, Seeff-Gabriel B, Shula C. Research report sentence imitation as a tool in identifying
expressive morphosyntactic dificulties in children with severe speech dificulties. Int J Lang Commun Disord. 2010;45(6):691-702.
27. Wertzner HF, Papp ACCS, Galea DES. Provas
de nomeação e imitação como instrumentos de diagnóstico do transtorno fonológico. Rev Pró-Fono
Atual Cient. 2006; 18(3):303-12.
28. Wertzner HF, Herrero SF, Pires SCF, Ideriha
PN. Classiicação do distúrbio fonológico por meio de duas medidas de análise: Porcentagem de consoantes corretas (PCC) e índice de ocorrências dos processos (PDI). Rev Pró-Fono Atual Cient. 2001;13(1):90-7.
29. Wertzner HF, Oliveira MMF. Semelhanças entre os sujeitos com distúrbio fonológico. Rev Pró-Fono