Revista Gaúcha
de Enfermagem
How to cite this article:
Urbanetto JS, Pasa TS, Bittencourt HR, Franz F, Rosa VPP, Magnago TSBS. Analysis of risk prediction capability and validity of Morse Fall Scale Brazilian version. Rev Gaúcha Enferm. 2016 Dec;37(4):e62200. doi: http://dx.doi.org/10.1590/1983-1447.2016.04.62200.
doi: http://dx.doi.org/10.1590/1983-1447.2016.04.62200
Analysis of risk prediction capability and
validity of Morse Fall Scale Brazilian version
Análise da capacidade de predição de risco e validade da Morse Fall Scale versão brasileira
Análisis de riesgo de predicción de la capacidad y validaçion de Morse Fall Scale versión brasileña
a Pontifícia Universidade Católica do Rio Grande do
Sul (PUCRS), Faculdade de Enfermagem, Nutrição e Fisioterapia (FAENFI), Curso de Graduação em Enfer-magem. Porto Alegre, Rio Grande do Sul, Brasil.
b Universidade Federal de Santa Maria (UFSM),
Hos-pital Universitário de Santa Maria. Santa Maria, Rio Grande do Sul, Brasil.
c Pontifícia Universidade Católica do Rio Grande do
Sul (PUCRS), Faculdade de Matemática. Porto Alegre, Rio Grande do Sul, Brasil.
d Pontifícia Universidade Católica do Rio Grande do
Sul (PUCRS), Faculdade de Enfermagem, Nutrição e Fisioterapia (FAENFI), Curso de Graduação em Fisi-oterapia. Porto Alegre, Rio Grande do Sul, Brasil.
e Universidade Federal de Santa Maria (UFSM),
Pro-grama de Pós-Graduação em Enfermagem. Santa Maria, Rio Grande do Sul, Brasil.
Janete de Souza Urbanettoa
Thiana Sebben Pasab
Hélio Radke Bittencoutc
Flavia Franzd
Vitor Pena Prazido Rosaa
Tânia Solange Bosi de Souza Magnagoe
ABSTRACT
Objective: To analyse the power to predict risk and verify the validity of the Morse Fall Scale – Brazilian version (MFS-B).
Method: This is a methodological, longitudinal study with 1487 adult patients of two university hospitals of Rio Grande do Sul, Brazil conducted from November 2013 to March 2014. The MFS-B was used to assess the risk of falls. Statistical analysis comprised multivar-iate methods (discriminant function analysis and ROC curve). The research was approved by the ethics committees of the institutions.
Results: The best estimate to predict falls was at the cutoff point 44.78 of the average MFS-B score, with a sensitivity of 95.2% and a specificity of 64%. The occurrence of falls and the high-risk classification were significant (p<0.00001).
Conclusions: The results show that the MFS-B can appropriately predict the risk of falls at the cutoff point for the high-risk classi-fication, according to the original classification. The MFS-B had adequate validation test results and maintained the six items of the original scale.
Keywords: Validation studies. Patient safety. Accidental falls. Nursing.
RESUMO
Objetivo: Analisar o poder de predição de risco da Morse Fall Scale na versão brasileira (MFS-B).
Método: Estudo metodológico, longitudinal, com 1487 pacientes adultos de dois hospitais universitários do Rio Grande do Sul, Brasil. A MFS-B foi utilizada para avaliar o risco para quedas. A análise estatística englobou métodos multivariados (Análise Fatorial e Discriminante, curva ROC para determinar o ponto de corte ótimo). Pesquisa aprovada pelos Comitês de Ética das instituições.
Resultados: A melhor estimativa para predizer a queda foi no ponto de corte 44,78 da pontuação média da MFS-B, com sensibili-dade de 95,2% e especificisensibili-dade de 64%. A ocorrência de queda e a classificação de risco elevado foram significativas (p<0,00001).
Conclusões: Os resultados apontam para uma boa capacidade de predição de queda pela MFS-B, no ponto de corte para a classifi-cação do risco elevado, conforme classificlassifi-cação original.
Palavras-chave: Estudos de validação. Segurança do paciente. Acidentes por quedas. Enfermagem.
RESUMEN
Objetivo: Analizar el poder de predicción de riesgo de la Morse Fall Scale en la versión brasilera (MFS-B).
Método: Estudio metodológico, longitudinal, con 1487 pacientes adultos de dos hospitales universitarios de Rio Grande do Sul, Bra-sil. La MFS-B fue utilizada para evaluar el riesgo para disminuciones. El análisis estadístico englobó métodos multivariados (Análisis Factorial y Discriminante, curva ROC para determinar el punto de corte óptimo). Estudio aprobado por los Comités de Ética de las instituciones.
Resultados: La mejor estimativa para predecir la disminución fue en el punto de corte 44,78 del puntaje promedio de la MFS-B, con sensibilidad de 95,2% y de especificidad de 64%. La disminución y la clasificación de riesgo elevado fueron significativos (p<0,00001). Conclusiones: Los resultados apuntan hacia una buena capacidad de predicción de la disminución por la MFS-B, en el punto de corte para la clasificación del riesgo elevado, según la clasificación original. MFS-B mostró pruebas de validez adecuada y el mantenimiento de los seis elementos de la escala original.
INTRODUCTION
The implementation of patient safety strategies during hospital stays is one of the challenges faced by healthcare institutions, managers and workers, and by patients and their chaperones/families. The numerous aspects that im-pair safe practices range from the structure of healthcare institutions to the material and human recourses(1-3). How-ever, in an attempt to minimise these issues, improvements in work processes and assistance have multiplied at inter-national and inter-national levels.
The guidelines of the World Health Organisation and, in Brazil, the ministry of health have spurred changes in the practices of health care, education and research. Some of these actions include the national patient safety pro-gramme established in Brazil in 20131. One of the interna-tional(2) and national(3) goals is the prevention of falls during hospitalisation. Falls are defined as events in which indi-viduals “inadvertently move downward onto the ground or any other lower level, excluding intentional position changes to lean on furniture, walls or other objects”(2).
One of the strategies for preventing falls is the early identification of the risk of falling. To this end, the Morse Fall Scale was translated and cross-culturally adapted to Brazil-ian Portuguese in 2013(4). In its original version, published by Morse in 1989, the sum of six items is used to produce a patient score that ranges from low and medium/moderate risk to high risk(5.6).
In the study of the Brazilian Portuguese translation and adaptation of the Morse Fall Scale (MFS-B), there was an agreement between the evaluators/judges regarding the perfect score (0.819 to 1.000) when applying the scale to all the items, with the exception of the item “Gait” that reached a substantial classification (0.798). For the assessment of to-tal and individual variability estimate of the measurements between the evaluators/judges, the Intraclass Correlation Coefficient (ICC) was 0.982 (p<0.01). Therefore, the MFS-B presented excellent reproducibility(4).
The original MFS was translated, adapted and validat-ed for use in other countries. The results of these studies available online were from Korea(7), China(8), Germany(9) and Portugal(10). For the latter version, only the translation and cross-cultural adaptation are available. The cutoff point and the capacity to predict falls of the MFS has been ques-tioned in several studies from different countries. To obtain a more profound understanding of the power of risk pre-diction and validity of the MFS-B, it was necessary to con-duct a further study that is described in this paper.
The research question for this study was: Is the Morse Fall Scale translated and adapted to Brazilian Portuguese
valid for use in Brazil and is it capable of predicting the fall risk of hospitalised adults?
Therefore, the aim of this paper is to analyse the risk prediction capacity of the MFS-B and to verify the validity of this scale.
METHOD
This is a methodological, longitudinal study with 1487 adult patients of two medium and large university hospitals of Rio Grande do Sul, Brazil. The study population was adult patients admitted from November 2013 to March 2014. A total of 1487 patients met the following inclusion criteria: ≥ 18 years of age, admitted to clinical or surgical units, and evaluated in relation to factors associated with falls within 48 hours of the initial time of admission. The sample was defined according to the average number of hospitalised patients in the study period (3900 patients), considering an estimated percentage of 50% and a sampling error of 2%.
Data were collected with the patients every day during the morning, afternoon, and night shifts by a team of nine students of the undergraduate and the graduate nursing programme who were previously trained by the research coordinators. The patients were monitored until hospital discharge, transfer or death.
The survey instrument contained two parts. The first part consisted of patient variables, namely age (in full years), gender (male or female), date of admission and dis-charge. The second part contained items of the MSF-B(4) and information on the occurrence of falls (yes or no).
The MFS-B contains six assessment items: (1) History of falling (No – 0 point; Yes – 25 points); (2) Secondary diagno-sis (No – 0; Yes – 15 points); (3) Ambulatory aid (None/Bed rest/Nurse assist – 0; Crutches/Cane/Walker – 15 points; Furniture/Wall – 30 points); (4) IV or heparin or saline IV ac-cess (No – 0; Yes – 20 points); (5) Gait (Normal/Bed rest/ Wheelchair – 0; Weak – 10 points; Impaired – 20 points); (6) Mental status (Oriented to own ability – 0 point; Over-estimates/Forgets limitations – 15 points)(4). The sum of the scores of each item generates a score for a low-risk rating (0-24 points), moderate risk rating (25-44 points) or high-risk rating (≥ 45 points)(4, 5).
out to evaluate the results obtained by the MFS-B based on the three outcomes:
a) Fall risk prediction: estimated by the area under the ROC curve (Receiver Operating Characteristic Curve);
b) Reliability: measured using Cronbach’s alpha calcula-tion to check that all items of the MFS-B assess aspects of different concepts, as opposed to the same concept; and
c) Factor analysis (FA): checks the validity of the factorial structure of the original instrument in the Brazilian version by means of principal component analysis and varimax rotation. The number of factors was selected according to the Kaiser normalisation, that is, the eigenvalues of the de-tected factors had to be greater than 1. Before proceeding with the factor analysis of the items, the basic assumptions were evaluated to apply the technique using Bartlett’s sphericity test and the KMO(11).
d) Discriminant analysis was used to check which items of the MFS best discriminate patients who have suffered falls and patients with no recorded falls.
Pearson’s correlation coefficient was used to analyse the correlation between the items of the MFS. The adopted significance level for all the analyses was 5%.
The research project was approved by the research eth-ics committee of the Pontifícia Universidade Católica do Rio Grande do Sul (OF. CEP – 1272/09) and of the
Universi-dade Federal de Santa Maria (CAAE 12173213.1.0000.5346, 23/02/2013). The patients who agreed to participate in the study signed two copies of an informed consent statement.
RESULTS
Data were collected with the daily monitoring of 1487 participants in inpatient clinical and surgical units of the two hospitals of the study. Of these participants, 860 (57.8%) were women with an average age of 58.1 ± 15.4 years, a minimum age of 18 and a maximum age of 97 years. The average hospital stay was 4.8 ± 4.5 days (min-imum 1, max(min-imum 28 days). With respect to falling, 393 (26.4%) patients had a fall history prior to admission and 104 (7.0%) suffered falls during their hospital stay. Regard-ing the day of the fall durRegard-ing hospitalisation, for 54 (51.9%) patients the fall occurred on the first day, for 27 (26.0%) on the second day, for 15 (14.4%) between the third and tenth day, and for eight patients (7.7%) the fall occurred after the tenth day.
Based on the scores of the MFS items, the average total score was 40.5 ± 21.7 points (median 35; minimum of zero and maximum of 125 points). As to the classification of risk for MFS-B, 597 (40.1%) were at high risk 508 (34.2%) at mod-erate risk, and 382 (25.7%) at in low risk of falling.
Morse Fall Scale (MFS-B)*
Occurrence of falls
p
Cronbach’s Alpha if item
excluded Yes (n = 104) No (n = 1,383)
n % n %
MFS-B Classiication
Low Risk 1 1.0 381 27.5
<0.00001
Moderate Risk 4 3.8 504 36.4
-High Risk 99 95.2 498 36.0
Average Score items**
Fall history 20.7 ± 7.2 (25.0) 5.9 ± 10.6 (0.0) <0.0001 0.100
Secondary diagnosis 10.0 ± 7.1 (15.0) 9.5 ± 7.2 (15.0) 0.543 0.277
Ambulatory aid 6.1 ± 10.5 (0.0) 1.8 ± 5.5 (0.0) <0.001 0.206
IV or heparin or saline IV access 16.5 ± 6.2 (20.0) 15.9 ± 7.0 (20.0) 0.395 0.273
Gait 8.6 ± 6.7 (10.0) 4.1 ± 6.0 (0.0) <0.001 0.199
Mental status 4.8 ± 6.2 (1.2) 1.4 ± 3.9 (0.0) <0.001 0.100
Total Average Score** 66.7 ± 19.4 (64.8) 38.5 ± 20.6 (35.0) <0.0001
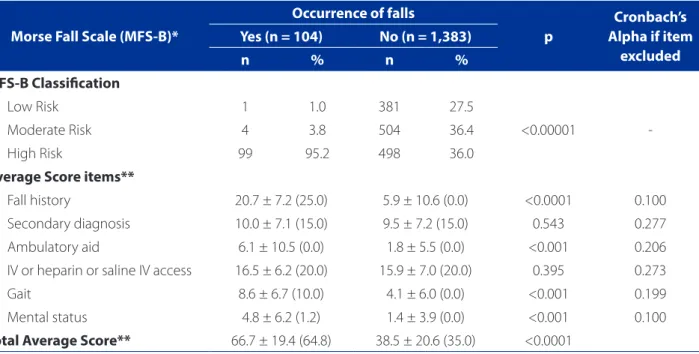
Table 1 – Absolute and relative distribution for the fall risk classification, according to the occurrence of falls; average, standard deviation and median for the items of the MFS-B and total score according to the occurrence of falls. RS, Brazil, 2014. (N = 1,487)
Source: Research data, 2014.
Table 1 shows the risk classification and average and median scores of the evaluated MFS-B items, according to the occurrence or not of falls.
Table 1 shows the statistically significant association between the occurrence of falls and the risk classification (p<0.00001), and the group that presented falls showed an association with high risk. This was also observed in the comparison of the groups (falls and no falls) with the av-erage scores of the items Fall history, Ambulatory aid, Gait and Mental status, and the total score of the scale.
Regarding the reliability of the MFS-B, Cronbach’s alpha was estimated at 0.278, which shows that the items assess differentiated information. The exclusion of any item does not raise the overall value of alpha.
Figure 1 shows the fall risk prediction results based on the ROC curve.
In the analysis of the relationship between the cases with falls and the total score of the scale, the best estimate obtained in the area under the ROC curve was 0.848 (CI: 95%: 0.820 – 0.876). At the cutoff point 44.78 (45 points, if rounded) of the average MFS-B score, the sensitivity was 0.952 (95.2%) and the specificity was 0.640 (64%).
Discriminant analysis was performed to identify the MSF-B items that best discriminate patients with risk of falling from a score of 45 points. The items Secondary di-agnosis and IV or heparin or saline IV access did not show the power of discrimination (p = 0.543 and p = 0.395, re-spectively). However, the items with the highest power of discrimination (p<0.0001) were Fall history, Mental status, Gait and Ambulatory aid.
Table 2 shows the predictive distribution (confirmatory factor analysis) and observed distribution of the falls.
The data of Table 2 shows that the sensitivity of the scale (percentage of a correct decision) was 90% (94/104) and the positive predictive value was 20% [94/(94 + 1018)]. However, the specificity of the scale (percentage of right decision for patients who have not fallen) was 73.6% (1018/1383) and the negative predictive value was 99% [1018/(1018 + 10)].
In relation to the correct or incorrect classification for the variable falling (yes or no), Diagonal A shows that in 1112 (74.8%) of the cases with and without falling, the clas-sification of patients was correct (true negatives and true positives), whereas according to Diagonal B, in 375 (25.2%) of the cases the rating was incorrect (false negatives and false positives) (Table 2).
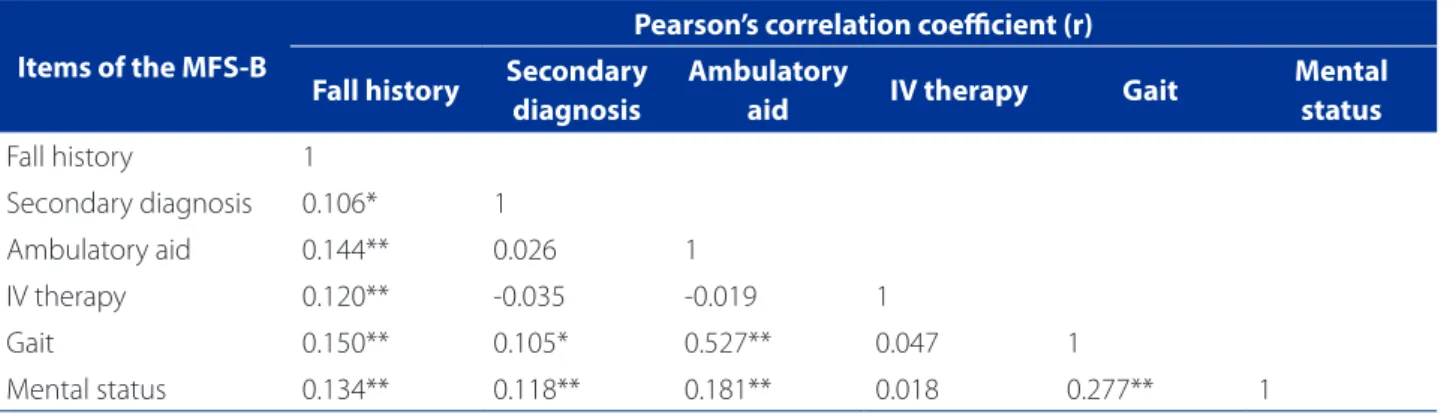
Table 3 shows the correlation between the items of the MFS-B.
Factor analysis was performed in order to confirm the hypothesis of independence between the items of the
scale, and investigate whether the structure of the MFS-B is similar to the original structure. The investigation of rel-evant correlations between the items of the construct re-vealed significant correlations, albeit of a weak magnitude (r<0.300), with a minimum of 0.105 (p=0.049), between the items Secondary diagnosis and Gait, and a maximum of 0.527 (p<0.001), between the items Ambulatory aid and Gait (Table 3).
Table 4 presents the factor load matrix of the MFS-B. The Kaiser-Meyer-Olkin (KMO) measure was 0.684, which indicates that the items of the MFS-B are suitable for factor analysis. The factor analysis revealed that the six items of the scale are represented by the six factors singled out by the technique. The factor loads for each of the items
Figure 1 – ROC curve of the total MFS-B score for the oc-currence of falls. RS/Brazil, 2014. (N = 1,487)
Source: Research data, 2014.
1 – Speciicity
ROC Curve – Occurrence of falls
S
ensitivit
y
0.0 0.2 0.4 0.6 0.8 1,0
1.0
1.8
1.6
1.4
1.2
0.0
Table 2 – Absolute distribution of the falls (Observed) in re-lation to the falls estimated by confirmatory factor analysis (Predicted). RS, Brazil, 2014. (N = 1,487)
Source: Research data, 2014.
Note: a true positive; b false negative; c false positive; d true negative.
Fall Prediction MFS-B ≥ 45 points
Observed Occurrence of Falls
Yes No
Yes 94a 365c
No 10b B A 1,018d
are presented in Table 4, where Factor 1 represents Mental status (0.987); Factor 2 represents Ambulatory aid (0.959); Factor 3 represents Fall history (0.992); Factor 4 represents IV or heparin or saline IV access (0.998); Factor 5 represents Secondary diagnosis (0.998); and Factor 6 represents Gait (0.949). The percentages of variance ranged from 16.7% (factors 1 to 5) to 15.5% (Factor 6), which indicates that the separate items form the factors.
DISCUSSION
Identifying the risk of falls is fundamental to reduce safety incidents during hospitalisation. The use of instru-ments that measure risk is a valuable and practical strategy that should be used by health professionals.
In this study, the average scores of the MFS-B among patients who had suffered a fall and those who had not were similar to those of the validation of the Korean MFS (69.0 ± 24.1; 45.0 ± 23.2, respectively)(7). However, the
scores were higher than the scores found in the Chi-nese validation (32.12 ± 26.2; 28.68 ± 19.13, respectively) (8) and in the original version (24.78 ± 22.95)(5). The study
of Portugal(10) does not describe the occurrence of falls and presents an average MFS score of 50.2 ± 24.2 points. These findings are probably the result of different patient profiles used in the study, such as patients at clinics, sur-gical units, and extended stay for the elderly, which lead to differentiated MFS score.
The cutoff point and the fall risk prediction capacity of the MFS have been the target of scrutiny in various stud-ies in different countrstud-ies. The MFS-B proved adequate to predict the occurrence of falls and produced a satisfactory ROC curve (0.848); the score of ≥ 45 points was defined as the best cutoff point for fall risk. This result coincides with the cutoff point to identify high risk of the original scale(5) and with the cutoff point found in the Chinese version(8). However, it differs from the Korean version (50 points)(7) and the German version (55 points)(9).
Items of the MFS-B
Pearson’s correlation coeicient (r)
Fall history Secondary diagnosis
Ambulatory
aid IV therapy Gait
Mental status
Fall history 1
Secondary diagnosis 0.106* 1
Ambulatory aid 0.144** 0.026 1
IV therapy 0.120** -0.035 -0.019 1
Gait 0.150** 0.105* 0.527** 0.047 1
Mental status 0.134** 0.118** 0.181** 0.018 0.277** 1
Table 3 – Analysis of correlation between the items of the MFS-B. RS, Brazil, 2014. (N = 1,487)
Source: Research data, 2014.
MFS-B – Morse Fall Scale – Brazilian version; * Significant correlation (p ≤ 0.05); ** Significant correlation (p ≤ 0.01).
Items of the MFS Principal Components
Factor 1 Factor 2 Factor 3 Factor 4 Factor 5 Factor 6
Fall history 0.060 0.061 0.992 0.061 0.032 0.060
Secondary diagnosis 0.038 0.008 0.031 -0.019 0.998 0.020
Ambulatory aid 0.076 0.959 0.066 -0.016 0.008 0.264
IV or heparin or saline IV access 0.006 -0.014 0.06 0.998 -0.019 0.022
Gait 0.137 0.273 0.066 0.026 0.023 0.949
Mental status 0.987 0.072 0.061 0.007 0.039 0.123
Table 4 – Factor load matrix of the MFS-B. RS, Brazil, 2014. (N = 1,487)
Source: Research data, 2014.
In this study, the score ≥ 45 points to predict the risk of falling during hospitalisation obtained the best result for the sensitivity of the scale (95.2%), i.e. the highest frequency of falls occurred in patients who obtained this score (true pos-itives). This evidence was better than the evidence found in the Chinese version (31%)(8), the original and the Korean versions (78%)(6, 7) and in the German version (74.5%)(9).
For specificity in the Brazilian version, the frequency of patients with scores below 45 points and of patients who did not fall was 64%. This percentage was better than the findings of the Korean version (55.8%)(7), which is similar to the German version (65.8%)(9) and lower than the original and Chinese versions (83%)(6, 8). These results show that the MFS-B has a good capacity to predict fall risk.
With respect to confirmatory factor analysis, the MFS-B classified 74.8% of the patients correctly (true positives and true negatives), which is slightly lower than the percentage found in the original version (80.5%)(6).
However, the variability of both sensitivity and specifici-ty demonstrated in validation studies of this scale suggests the existence of important extrinsic factors related to falls that are not considered by the MFS, such as the infrastruc-ture of the room/ward (lighting, placement of furniinfrastruc-ture, bell, height of the beds, among others) and the patient en-vironment during the first days of admission.
Another important aspect to be considered is the change of patient behaviour regarding fall prevention
during the study. The Hawthorne effect must be
consid-ered since approaching the patient and applying the daily MFS-B review can trigger a positive change of attitude (pa-tients/chaperones and professionals), as observed in the patient statements, “I get it now, call someone to help me” or “I changed my shoes”.
When evaluating reliability, it is important to establish whether the relationship between the items measures sim-ilar or different aspects. The analysis of the internal consis-tency of the MSF-B revealed a Cronbach’s alpha (α = 0.28) in the correlation between the items. According to the author of the original scale(6), the MSF comprises six independent items that measure different information, which is a neces-sary feature when measuring a multifaceted phenomenon. This aspect was also found in the original version (α = 0.16)(6) and in the Chinese version (α = 0.26)(8).
The factor analyses confirm the need to maintain the six items of the scale because they provide specific infor-mation for the final risk score. None of the items of the scale can be extracted or grouped without compromising the structure or the purpose of the scale. In the Chinese version(8), the factor analysis revealed three factors: Factor 1 grouped the items Gait and Ambulatory aid (factor load
0.83); Factor 2 grouped Secondary diagnosis and IV ther-apy (factor load 0.71 and 0.65, respectively); and Factor 3 grouped Fall history and Mental status (factor load 0.84 and 0.52, respectively).
Regarding the Brazilian version, the maintenance of six scale items is reinforced by the findings of the correlation analysis, which showed a weak relationship between all the items with the exception of Gait and Ambulatory aid. The findings corroborate the original version in that each item brings differentiated information, thus making any ex-clusion or addition unadvisable.
Despite the apparent simplicity of application of the MFS-B, it is important to ensure the permanent education of the professionals who will assess fall risk since the incor-rect understanding of any item may result in an inadequate score and misguided risk classifications. The item Mental status, for example, does not evaluate the patients’ level of consciousness, but rather how patients comprehend their capabilities or limitations when walking unaided. When the health professional identifies that the patient is at risk of falling (use of psychoactive medications, changes in gait and balance, for example) and provides the corresponding guidelines, the expected response is that the patient will not walk alone. The contrary refers to a fall risk score be-cause the patient has forgotten his or her limitations and overestimated his or her capabilities.
Studies on fall risk are complex due to the multiplicity of causes, the complexity of health issues and the individ-uality of patients, which casts doubts on the real risk pre-diction capacity of scales since no scale can contain all the risk factors for falls. This aspect is discussed in research that analyses the risk and occurrence of falls and focuses on the need for robust designs and financial, structural and hu-man investments since the fall risk classification can vary at any time during patient hospitalisation(11).
CONCLUSION
The results of this study show that the psychometric properties of the MFS-B are consistent and appropriate to evaluate the risk of falls among hospitalised adults in the investigated Brazilian scenario. The predictive validity was similar to the original version and the cutoff point of ≥ 45 points was maintained as indicative of fall risk. The low value of the Cronbach’s alpha and the low correlation be-tween the items of the MFS-B confirm the independence of the items and, therefore, the maintenance of all the items to predict risk.
is suggested and can contribute to the elucidation of exist-ing doubts, considerexist-ing the multiple causes of falls. The re-sults of this study can support the application of the MFS-B in education, research, care, and management.
A limitation of this study is the absence of an inves-tigation of fall risk among patients of specialised units. However, it is believed that the information bias was min-imised with the inclusion of clinical and surgical patients, young adults, middle-aged patients and elderly patients with a wide range of diagnoses. In addition, the study was conducted in two university hospitals with prospec-tive and random daily tracking of patients throughout the hospital stay to capture the individual variations and con-sequently ensure that the risk score analysed in this study was as reliable as possible.
REFERENCES
1. Brasil. Portaria nº 529, de 1º de Abril de 2013. Institui o Programa Nacional de Segurança do Paciente (PNSP). Brasília: Ministério da Saúde [Internet]. 2013 [cited 2015 dec 18]. Available at: http://bvsms.saude.gov.br/bvs/saudelegis/ gm/2013/prt0529_01_04_2013.html
2. WHO World Health Organization. Global report on falls prevention in older age. [Internet]. 2007 [cited 2015 Dec 18]. Available at: http://www.who.int/ageing/ publications/Falls_prevention7March.pdf
3. Brasil. Ministério da Saúde. Anexo I: Protocolo prevenção de quedas. Ministério da Saúde/ Anvisa/ Fiocruz [Internet]. 2013 [cited 2015 Nov 22]. Available at: http://portalsaude.saude.gov.br/portalsaude/arquivos/pdf/2013/Mai/06/pro-tocolos_CP_n6_2013.pdf.
4. Urbanetto JS, Creutzberg M, Franz F, Ojeda BS, Gustavo AS, Bittencourt HR et al. Morse Fall Scale: translation and transcultural adaptation for the Por-tuguese language. Rev. Esc. Enferm. USP [Internet]. 2013 [cited 2015 Nov
22];47(3):569-575. Available at: http://www.scielo.br/pdf/reeusp/v47n3/ en_0080-6234-reeusp-47-3-00569.pdf
5. Morse JM, Black C, Oberle K, Donahue P. A prospective study to identify the fall-prone patient. Sm. Sri. Med. 1989; 28(1):81-86.
6. Morse JM, Morse RM, Tylko SJ. Development of a scale to identify the fall-prone patient. Canadian Journal on Aging. 1989; 8(4)366-377
7. Kim KS, Kim JA, Choi Y, Kim YJ, Park MH, Kim , et al. A Comparative Study on the Validity of Fall Risk Assessment Scales in Korean Hospitals. Asian Nursing Re-search [Internet]. 2011 [cited 2015 Nov 22]; 5(1): p. 28-30. Available at: http:// ac.els-cdn.com/S197613171160011X/1-s2.0-S197613171160011X-main. pdf?_tid=3727d8c4-cdd1-11e5-aa70-00000aacb361&acdnat=1454873596 _15694640dff25c09d82069e47cef84e1
8. Chow KY, Lai CKY, Wong TKS, Lorna K.P. Suen , Suen LKP, Kong SKF, et al. Evalu-ation of the Morse Fall Scale: Applicability in Chinese. InternEvalu-ational Journal of Nursing Studies. 2007; 44: 556–565.
9. Schwendimann R, De Geest S, Milisen K. Evaluation of the Morse Fall Scale in hospitalised patients. Age Ageing [Internet]. 2006 [cited 2015 Nov 22]; 35:311-313. Available at: http://ageing.oxfordjournals.org/content/35/3/311.full. pdf+html
10. Martins da Costa-Dias J, Oliveira S, Ferreira PL. Cultural and linguistic adapta-tion and validaadapta-tion of the Morse Fall Scale. Revista de Enfermagem Referência [Internet]. 2014 [cited 2015 Nov 22]; 2(4): p. 7-17. Available at: http://www. scielo.mec.pt/pdf/ref/vserIVn2/serIVn2a02.pdf
11. Norusis, Marija; statistical package for the social sciences – SPSS Inc. Profes-sional Statistics Release 5. Chicago: SPSS Inc. 1992.
12. Morse MJ. The safety of safety research: the case of patient fall research. CJNR [Internet]. 2006 [cited 2015 Nov 22]; 38(2):74–8. Available at:http://docserver. ingentaconnect.com/deliver/connect/mcgill/08445621/v38n2/s7.pdf?expires =1454872077&id=85970369&titleid=6601&accname=Guest+User&check sum=408BFE14A20B2122C9F2D4BA19960D74
Acknowledgment to the National Council of Technological and Scientific Development – CNPq – Brazil, for the support received through the Universal Edict 14/2013.
Corresponding author:
Janete de Souza Urbanetto E-mail: [email protected]