Body mass index, overweight, and blood pressure among adolescent
schoolchildren in Limpopo province, South Africa
Índice de massa corpórea, sobrepeso e pressão arterial em escolares na província de Limpopo, África do Sul
Índice de masa corporal, sobrepeso y presión arterial en adolescentes de la província de limpopo, sudáfrica
Violet Kankane Moselakgomo1, Abel Lamina Toriola2, Brandon Stuwart Shaw3, Daniel Ter Goon4, Oluwadare Akinyemi5
Instituição: Tshwane University of Technology, Pretoria, South Africa
1Post-graduate student in the Department of Sports, Rehabilitation and
Dental Sciences, Tshwane University of Technology, Pretoria, South Africa
2Professor and Head of the Department of Sports, Rehabilitation and Dental
Sciences, Tshwane University of Technology, Pretoria, South Africa
3Associate Professor at the Department of Sports, Rehabilitation and Dental
Sciences, Tshwane University of Technology, Pretoria, South Africa
4Lecturer in the Centre for Biokinetics, Recreation and Sport Science,
University of Venda, Thohoyandou, South Africa
5Post-graduate student in the Department of Statistics, University of Venda,
Thohoyandou, South Africa ABSTRACT
Objective: To evaluate the relationship between body mass index, overweight, and blood pressure among South African rural children and adolescents.
Methods: The sample involved 1,172 schoolchildren (541 boys and 631 girls) aged 10 to 16 years. Stature, body mass, and skinfolds were measured using standard procedures. Overweight was defined by body mass index for gender and age. Blood pres-sure was monitored in each child three times using validated electronic devices (Omron HEM-705 CP, Device, Tokyo, Japan). Hypertension was determined as the average of three separate blood pressure readings, in which the systolic or diastolic blood
pressure was ≥90th percentile for age and sex. Descriptive
statis-tics were calculated for all variables.
Results: The prevalence of overweight was 5.5% for boys and 4.4% for girls. The children who had systolic blood
pres-sure >90th percentile ranged from 2.3 to 5.9%. The likelihood
of hypertension development among children is noticeable at age 10 for both boys and girls (0.2 and 0.1%, respectively), and ranged from 0.2 to 1.7% for boys and 0.1 to 1.2% for girls. Col-lectively, the prevalence of hypertension was 4.1 and 2.8% for boys and girls, respectively. Blood pressure correlated positively with stature, body mass, body mass index, body fat, and sum
of skinfolds (p<0.001).
Conclusions: Blood pressure increased with age in both genders. The routine measurement of blood pressure, as part of physical examinations of schoolchildren, is crucial for early prevention and intervention programs.
Key-words: overweight; body mass index; subcutaneous fat; blood pressure; South Africa.
RESUMO
Objetivo: Avaliar a relação entre índice de massa corporal, sobrepeso e pressão arterial em crianças e adolescentes da área rural da África do Sul.
Métodos: A amostra abrangeu 1.172 escolares (541 meninos e 631 meninas) com idades entre 10 e 16 anos. Estatura, massa corporal e dobras cutâneas foram medidas por meio de procedi-mentos padrão. O sobrepeso foi definido pelo índice de massa corporal para idade e sexo. A pressão arterial foi monitorada três vezes em cada criança com o uso de aparelhos eletrônicos validados (Omron HEM-705 CP, Omron, Tóquio, Japão). A hipertensão foi determinada como a média de três leituras da pressão arterial, em que a sistólica ou a diastólica foi igual ou acima do percentil 90 para idade e sexo. Estatísticas descritivas foram calculadas para todas as variáveis.
Resultados: A prevalência de sobrepeso foi de 5,5% para meninos e 4,4% para meninas. A taxa de crianças com pressão arterial acima do percentil 90 variou de 2,3 a 5,9%. A pro-babilidade do desenvolvimento de hipertensão em crianças é perceptível aos dez anos, tanto para os meninos (0,2%) quanto para as meninas (0,1%), e oscilou de 0,2 a 1,7% para o sexo masculino e de 0,1 a 1,2% para o feminino. Considerando-se a amostra total, a prevalência de hipertensão foi de 4,1% para os meninos e 2,8% para as meninas. A pressão arterial apresentou
Endereço para correspondência: Daniel Ter Goon
Centre for Biokinetics, Recreation and Sport Science, University of Venda Thohoyandou, South Africa
E-mail: [email protected]
Fonte financiadora: Tshwane University of Technology, Pretória, África do Sul Conflito de interesse: nada a declarar
correlação positiva com estatura, massa corporal, índice de massa
corporal, gordura corpórea e soma das dobras cutâneas (p<0,001).
Conclusões: A pressão arterial aumentou com a idade tanto para os meninos quanto para as meninas. A medição da pressão arterial de rotina, como parte do exame físico em escolares, é crucial para fins de prevenção e medidas de intervenção precoces.
Palavras-chave: sobrepeso; índice de massa corpórea; gordura subcutânea; pressão arterial; África do Sul.
RESUMEN
Objetivo: Este estudio evalúa la relación entre índice de masa corporal, sobrepeso y presión arterial en adolescentes rurales sudafricanos.
Métodos: La muestra incluyó a 1.172 niños de 10-16 años de edad (541 del sexo masculino y 631 del sexo femenino). La estatura, la masa corporal y los pliegues cutáneos se midieron utilizando procedimientos estándares. El sobrepeso se definió según el índice de masa corporal para sexo y edad. Se monitorizó la presión arterial por tres veces en cada niño utilizando aparatos electrónicos validados (Omron HEM-705 CP, Omron, Tokio, Japón). Se determinó la hipertensión cuando los promedios de la presión sistólica o diastólica, calculados con base en las tres medi-ciones de presión arterial, fueron ≥percentil 90 para edad y sexo. Se calcularon estadísticas descriptivas para todas las variables.
Resultados: La prevalencia de sobrepeso fue del 5,5% en los niños y 4,4% en las niñas. El porcentaje de adolescentes con pre-sión arterial sistólica >percentil 90 osciló entre el 2,3 y el 5,9%. La probabilidad de desarrollo de hipertensión entre los jóvenes fue notable a los 10 años tanto en los niños como en las niñas (0,2 y 0,1%, respectivamente) y osciló entre el 0,2 y el 1,7% en los niños y entre el 0,1 y el 1,2% en las niñas. Colectivamente, la prevalencia de hipertensión fue del 4,1 y el 2,8% en niños y niñas, respectivamente. La presión arterial estuvo positivamen-te correlacionada con estatura, masa corporal, índice de masa corporal, grasa corporal y suma de pliegues cutáneos (p=0,00).
Conclusiones: La presión arterial se elevó con la edad tanto en los niños como en las niñas, y estuvo positivamente correlacio-nada con estatura, masa corporal, índice de masa corporal, grasa corporal y suma de pliegues cutáneos. La medición de rutina de la presión arterial como parte del examen físico de escolares es crucial para la prevención precoz y la implementación de pro-gramas de intervención.
Palabras clave: Sobrepeso; índice de masa corporal; grasa subcutánea; presión arterial; Sudáfrica.
Introduction
Adolescent obesity is on the rise and is associated with adverse health effects. Excessive body weight, including over-weight and obesity, together with hypertension, represents
major threats to civilization in the 21st Century(1). Recent
data from the US suggest that the level of blood pressure (BP) and the incidence of hypertension in children and adolescents
is rising(2). Global prevalence of hypertension in children
stands at 1-3%(3). The increased prevalence of hypertension
in school-aged children may possibly be attributed to the ris-ing prevalence of overweight individuals. The BP may also be affected by other factors including age, exercise, and
emo-tions(4). However, the impact of weight gain on BP is neither
consistent across age groups, nor is it the same between men
and women(5).
Several International multi-centre studies, e.g. the advanced
data from vital and health statistics study(6), the CASPIAN
study(7), and other researchers(1,8-14) have shown a positive
relation-ship between overweight, obesity, unhealthy lipid proiles, high insulin levels, and hypertension in both children and adolescents.
In South Africa studies conducted on Ellisras(15) and Tshannda(16)
rural school children in Limpopo province have also reported an increasing prevalence of risk factors in metabolic and cardio-vascular diseases (CVDs) among children. The Bradshaw and
Steyn(17) study reported CVDs to be one of the top ten leading
causes of death in South Africa. Because high BP in children
is a predictor of adult BP levels(18), identifying children and
adolescents who are at increased risk of developing essential
hypertension as adults(19) is important. Such indings will thus
inform public policy and perhaps become an impetus to design and implement appropriate intervention strategies. Hence, the purpose of this study was to evaluate the relationship between body mass index, overweight, and BP among South African rural adolescents in Limpopo province of South Africa.
Methods
data to be collected. Further, it was more feasible to conduct the research in schools in the Capricom District with the assistance of trained ield workers who were also nursing and kinesiology students at the University of Limpopo which is situated in the district. It was also more appropriate to collect the data in this same district because the schools were in a rural location and the pupils have similar socio-economic backgrounds. The population relies mainly on subsistence farming and very meagre inancial support from the males of the families who work as migrant labourers in the mining sectors in the South and Gauteng. The home language of 52.1% of the provincial population is Sepedi, 22.4% of the population speak Xitsonga, while 15.8% speak Tshivenda. These three tribes constitute the major tribal popula-tion in the province. Most of these tribes live in remote areas and are characterized by poverty, illiteracy, and nutritional problems. A multi-stage stratiied sampling method was used in the study including a random sampling technique of the primary schools within the district. To select a sample, the schools in the two circuits (i.e. Mankweng and Toronto), were numbered serially based upon the school register and depending upon the pupil population density (only schools with more than 700 pupils were included in the sampling procedure). Four schools were subsequently chosen at random from each of the circuits. However, a school in the Toronto circuit declined to participate in the study and was therefore excluded. In each school, the clas-ses were listed numerically (e.g. grades 5A, 5B, 5C, etc.) and a simple ballot system was used to select four classes whose pupils were eventually assessed. Also, using oficial class registration lists, a stratiied random sample of children was drawn from each class according to their age and gender. Speciically, those who were aged 10-16 years, had no disability, and was not suffering from any serious ailment that could impair anthropometric or physical itness testing were measured. Also, only children who were present on the day of measurement were included.
The Central Higher Degrees Committee of Tshwane University of Technology, Pretoria, South Africa, and other rel-evant provincial regulatory authorities (namely the Department of Education (DoE), Limpopo ofice, and the DoE, district of-ice, Capricorn), granted ethics approval for the research to be carried out. Information lealets and informed consent forms were administered to the head teachers, pupils, and their par-ents or guardians who consented that the study go forward. In addition, children who were minors were briefed on the nature and procedures of the study and were asked for their consent to participate in the study
Eight trained research assistants, post-graduate students in the Department of Nursing and School of Education (Kinesiology
Unit), University of Limpopo, participated in the data collection. A specialized training workshop was conducted for the research assistants by the researchers to enable them to competently meas-ure the dependent variables in the study. At this workshop, each assistant was trained to perform a speciic task – a measurement procedure at a designated work station (e.g. anthropometric measurement). Each work station had a team leader who co-ordinated prescribed data collection procedures. The data were collected from March to April of 2010. Before data collection commenced, the pupils illed out the demographic section of the data form indicating their age and gender.
Resting blood pressure (RBP) was measured three times at ive minutes intervals using an Electronic Blood Pressure Monitor (Omron HEM-705 CP Device, Tokyo, Japan) according to
standardized guidelines(20). The children were seated with the
arm cuff and zero indicators on the monitor at the level of the examiner’s eye. All the readings were taken in duplicate on the right arm. Appropriate cuff sizes were used with the cuff width approximately 40% of mid arm circumference. In this position the cuff bladder covers 80 to 100% of the arm circumference at approximately two thirds of the length of the upper arm without overlapping. The procedure was explained to the participants before the measurement and the cuff inlated and delated once. The irst BP measure was not used in data analysis. The read-ings at the irst and third BP monitors were taken as systolic and diastolic BP (SBP and DBP), respectively. The average of the two BP measurements were recorded and included in the statistical analysis. Hypertension was determined as the average
of three separate BP readings where the SBP or DBP was ≥90th
percentile for age and sex(21). From the BP measurements, the
mean arterial pressure (MAP) was derived using the formula:
MAP = DBP + ⅓ (SBP – DBP)(22).
Height and body weight were measured according to the protocol of the International Society for the Advancement of
Kinanthropometry (ISAK)(23). Height was measured to the
near-est 0.1 centimetres (cm) in bare feet with participants standing upright against a mounted stadiometer. Weight was measured to the nearest 0.1 kilogram (kg) with participants lightly dressed (underwear and T-shirt) using a portable digital scale (Tanita HD 309, Creative Products, MI, USA). The body mass index (BMI)
was calculated from weight in kilograms height-2 (kg m-2). A
Harpenden (John Bull) calliper with inter-jaw pressure of 10g/
mm2 was used to measure skinfolds (subscapular and triceps)
to the last 0.2mm. The calculation of the percentage of body fat (%BF) was based on the sum of the triceps and subscapular
skinfolds (∑TS) using the equation of Slaughter et al(24). This
various ethnic groups. For boys (all ages) %BF=1.2 (∑TS) - 0.008
(∑TS)2 - 3.2. For girls (all ages) %BF=1.33 (∑TS) - 0.013 (∑TS)2
- 2.5; where ∑TS is the sum of triceps and subscapular skinfolds. Data were analyzed using descriptive statistics. The
para-metric t-test was applied to test signiicance levels at p<0.05
between sexes, while the F-test was used to test the signiicance level of the variables across the ive age groups. Pearson’s cor-relation test was used to investigate the cor-relationship between the anthropometric measurements and BP among the children. The Statistical Package for the Social Sciences (SPSS) was used
for the analyses. The statistical signiicance was set at p<0.05.
Results
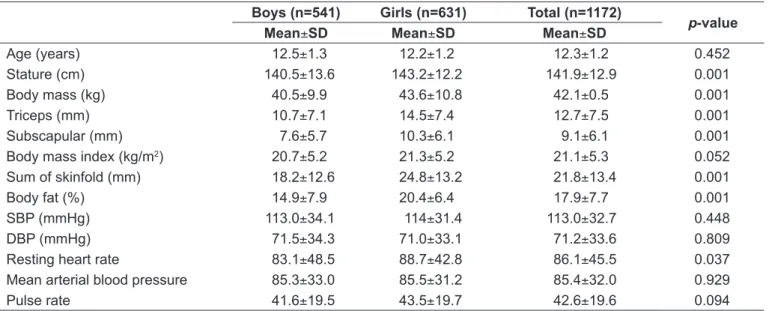
Hemodynamic and anthropometric data were collected from 541 boys (48.2 %) and 631 (51.8 %) girls. The mean age of the
participants was 12.3±1.2 years. Except for SBP, DBP, MBP, and
pulse rate, all other anthropometric and hemodynamic variables were signiicantly different in both sexes, with the girls having signiicantly higher mean values for body mass, stature, triceps, subscapular, and resting heart rate (RHR) compared to the boys (Table 1).
Both SBP and DBP increased with age in both sexes (Table 2).
For both, there was no signiicant difference (p≥0.05) in the
means of those aged 10−13 years compared to the 14−16 year
olds. The mean values of SBP and DBP were signiicant (p≤0.05)
only at ages 14−16 years. Mean arterial blood pressure (MAP)
was 75.3±33.0mmHg for boys and 75.5±31.2mmHg for girls.
In this regard, there was no signiicant difference in RHR
between boys and girls. Similarly, there was no age difference regarding the MAP of both sexes (Table 2).
Shown in Figure 1 are the proportions of the children with SBP and DBP >90th percentile used to deine hyper-tension in this category. The proportion of children in the >90th percentile increased with age. The children had SBP >90th percentile range from 2.3 to 5.9%.
Although SBP and DBP pressures did not signiicantly
cor-relate with age (p>0.05), statistically signiicant (p<0.05) positive
correlations were observed with stature, body mass, BMI and
body fat (Table 3). Shown in Table 4(25) is the distribution of the
prevalence of hypertension and the prevalence of overweight among the children according to sex and age. The prevalence of hypertension ranged from 0.2−1.7% to 0.1−1.2% in boys and girls, respectively. In both sexes, children at risk of overweight increases with age, peaking at age 12, with a decline thereafter. The percentage of children who were overweight were higher in boys (5.5%) compared with the girls (4.4%).
Discussion
The present study examined the relationship between BMI, overweight, and BP among adolescents attending schools in Limpopo, South Africa. High BP is a serious cardiovascular risk
factor. It is also associated with lesions of target organs(26-29). The
incidence of hypertension among our sample was 4.1 and 2.8% in boys and girls, respectively. The values vary among the ages, the highest being 1.2 and 1.7% in boys at the ages of 13 and 14−16 years, respectively. The prevalence of hypertension found
Table 1 - Anthropometric and hemodynamic measurements of the participants according to gender Boys (n=541) Girls (n=631) Total (n=1172)
p-value
Mean±SD Mean±SD Mean±SD
Age (years) 12.5±1.3 12.2±1.2 12.3±1.2 0.452
Stature (cm) 140.5±13.6 143.2±12.2 141.9±12.9 0.001
Body mass (kg) 40.5±9.9 43.6±10.8 42.1±0.5 0.001
Triceps (mm) 10.7±7.1 14.5±7.4 12.7±7.5 0.001
Subscapular (mm) 7.6±5.7 10.3±6.1 9.1±6.1 0.001
Body mass index (kg/m2) 20.7±5.2 21.3±5.2 21.1±5.3 0.052
Sum of skinfold (mm) 18.2±12.6 24.8±13.2 21.8±13.4 0.001
Body fat (%) 14.9±7.9 20.4±6.4 17.9±7.7 0.001
SBP (mmHg) 113.0±34.1 114±31.4 113.0±32.7 0.448
DBP (mmHg) 71.5±34.3 71.0±33.1 71.2±33.6 0.809
Resting heart rate 83.1±48.5 88.7±42.8 86.1±45.5 0.037
Mean arterial blood pressure 85.3±33.0 85.5±31.2 85.4±32.0 0.929
Pulse rate 41.6±19.5 43.5±19.7 42.6±19.6 0.094
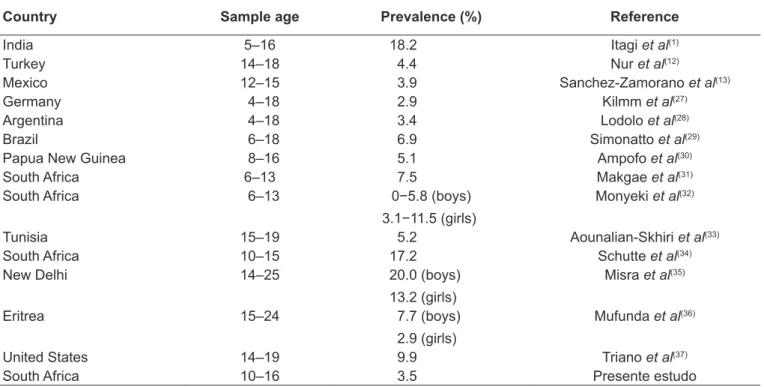
in this study varies with other studies reported in the literature,
with one study reporting lower values(29), others almost similar
values(13,30), while a majority of the studies had disproportionately
higher prevalence rates of hypertension (Table 5).(1,12,13,27-37)
The likely reasons for the difference between the prevalence of hypertension in this study and those reported in the litera-ture might be the use of different age groups, differing research methods and deinitions of BP, as well as differences in reported prevalence and risk estimates. It is possible too, that geographical location may account for the difference in distribution of BP. It has been reported that regional difference exists in the BP among paediatric and adult populations from various geographic areas
of the world – India, US, China, and Nigeria(11,38-42). However,
the high prevalence of hypertension in boys compared with girls might not be unconnected with the social and cultural lifestyle of females (in general) who are expected to stay at home and carry out household chores. This then calls for a greater inter-est and concerted effort in the invinter-estigation of early risk factor
development and their health - related outcomes(16), especially
in children and adolescents.
The prevalence of hypertension among the adolescents in this present study was 3.5%, and was consistent with the indings
of other studies indicating that BP increases with age(11,36). The
implication of this observation is disturbing, granted that chil-dren who are obese are at greater risk for high BP at adulthood and the possibility of developing CVDs later in life. The onset of these diseases affects mostly the vital organs of the body (heart, brain, and kidneys), leading to mortality with the primary cause
being heart attack, heart failure, stroke, and others(43). Therefore,
there is a need to identify and prevent high BP as soon in life as
Prevalence of hypertension (%)
Age (years)
Diastolic blood pressure Systolic blood pressure 7 6 5 4 3 2 1 0
10 11 12 13 14–16
1.9% 2.3%
3.6% 3.8%
5.1% 5.4% 5.4%
5.9%
4.1% 4.7%
Figure 1 - Prevalence of hypertension >90th percentile among
the children Table 2 -
Systolic, diastolic and mean arterial blood pressure of South
African boys and girls according to age groups
Age (years) Boys (n) Girls (n)
Systolic blood pressure (mmHg)
Diastolic blood pressure (mmHg)
Mean arterial blood pressure (mmHg)
Boys (Mean ± SD) Girls (Mean ± SD) p -value Boys (Mean ± SD) Girls (Mean ± SD) p -value Boys (Mean ± SD) Girls (Mean ± SD) p -value 10 26 42 105.2 ± 32.2 103.6 ± 30.3 0.280 62.8 ± 29.8 61.1 ± 30.2 0.826 73.6 ± 27.6 75.3 ± 28.7 0.810 11 11 0 147 109.6 ± 34.3 108.4 ± 32.6 0.31 1 63.4 ± 38.1 63.2 ± 39.8 0.971 76.2 ± 37.4 76.8 ± 38.6 0.908 12 150 162 1 12.0 ± 38.8 1 13.1 ± 38.8 0.678 69.1 ± 33.1 62.0 ± 36.2 0.451 72.6 ± 32.4 75.8 ± 32.9 0.378 13 133 194 1 19.6 ± 28.9 1 16.0 ± 29.0 0.453 70.8 ± 32.3 70.6 ± 30.0 0.957 75.0 ± 30.2 75.7 ± 28.7 0.838 14-16 122 86 127.3 ± 19.6 120.7 ± 18.4 0.021* 73.3 ± 35.6 71.1 ± 20.2 0.003* 78.6 ± 33.7 72.3 ± 18.1 0.1 14
SD: standard deviation; *Statistically signiicant (
p
≤
possible. The increasing trend of high BP among adolescents in a rural environment also points to a change in lifestyle that has been implicated in the causation of the increasing prevalence of hypertension in sub-Saharan African cities, and that may also
be creeping into the non-urban areas(11). This trend calls for a
modiication of lifestyle from birth to adulthood. Adopting a healthy diet, lower salt intake, and partaking in physical activity would help to maintain normal BP values in both children and
adolescents. As postulated by Halpern(5), measures of lifestyle
change should always be implemented as early as possible, as it is easier for children to change life habits than adults. A controlled consumption of salt from the early months of life, ighting excess weight from the irst year of life, and always encouraging the practice of physical activity in children and Table 3 - Relationship of systolic and diastolic blood pressure
with age, stature, body mass, body mass index and body fat in Pearson correlation analysis
Variables SBP (mm Hg) DBP (mm Hg) r p-value r p-value
Age (years) 0.19 0.06 0.22 0.25
Stature (cm) 0.50 0.00 0.45 0.04
Body mass (kg) 0.49 0.00 0.46 0.00
BMI (kg/m2) 0.40 0.00 0.47 0.03
Body fat (%) 0.57 0.00 0.53 0.00
Sum of skinfolds (mm)
0.55 0.00 0.51 0.00
BMI: body mass index; SBP: systolic blood pressure; DBP: diastolic blood pressure;r: linear correlation
Table 4 - Prevalence of hypertension and overweight among South African children according to age and gender
Age (years)
Gender Hypertension Overweight
Boys Girls Boys Girls Boys Girls
n n % % % %
10 26 42 0.2 0.1 7.7 4.8
11 110 147 0.4 0.2 8.2 6.8
12 150 162 0.6 0.5 7.3 5.6
13 133 194 1.2 0.8 2.3 2.1
14–16 122 86 1.7 1.2 4.1 3.5
Total 541 631 4.1 2.8 5.5 4.4
Hipertension: The average SDP and DPB ≥90th percentile for age and sex; Overweight: Internationally recommended body mass index cut-off points in children(25)
Table 5 - Prevalence of hypertension in literature compare with the present study
Country Sample age Prevalence (%) Reference
India 5–16 18.2 Itagi et al(1)
Turkey 14–18 4.4 Nur et al(12)
Mexico 12–15 3.9 Sanchez-Zamorano et al(13)
Germany 4–18 2.9 Kilmm et al(27)
Argentina 4–18 3.4 Lodolo et al(28)
Brazil 6–18 6.9 Simonatto et al(29)
Papua New Guinea 8–16 5.1 Ampofo et al(30)
South Africa 6–13 7.5 Makgae et al(31)
South Africa 6–13 0−5.8 (boys)
3.1−11.5 (girls)
Monyeki et al(32)
Tunisia 15–19 5.2 Aounalian-Skhiri et al(33)
South Africa 10–15 17.2 Schutte et al(34)
New Delhi 14–25 20.0 (boys)
13.2 (girls)
Misra et al(35)
Eritrea 15–24 7.7 (boys)
2.9 (girls)
Mufunda et al(36)
United States 14–19 9.9 Triano et al(37)
adolescents (combined with healthy eating habits(5) are feasible healthy options.
Consistent with other studies(11-13,36), the present research
demonstrated a signiicant (p=0.001) positive correlation of
BP with stature, body mass, BMI, body fat, and sum of skin-folds. A direct correlation between body mass and BP has been
documented at ive years of age(44), and it was reported that BP
increases with body mass(45), thus implying some physiological
relationships between these dependent measures.
The MAP is an indication of the rate of perfusion of blood through the arteries and veins to the organs. Normal values range
from 70–110mmHg. A lower MAP is indicative of ischemia(22).
Regardless of age and gender the mean MAP values for the children in our study were within normal limits.
However, signiicant differences were found in the resting HR values among the older boys and girls (i.e. 13−16 year-olds) with the girls having consistently higher values. This suggests that the boys were more it than the girls in that age category.
Similar RHR values have been reported for South African(46) and
Nigerian(47) children of comparable age.
The results of this research should be interpreted bearing in mind the limitations of the study. It is appropriate to assume that the sampled population represents the adolescent children in Mankeng and Toronto, but is not relective of province or national level. In this regard, and given the area and size of the sample, the generalisation of the study‘s indings must be viewed with caution. BP were measured only at one visit, at
difference with theNational High Blood Pressure Education
Program (NHBPEP) criteria that require BP to be measured at least on three occasions. This disparity could have affected the estimate of the hypertension prevalence in the sampled children. In our analysis, however, BP was mainly considered as a continuous variable thereby minimizing misclassiication problems. Additionally, salt intake and urinary sodium excretion of the participants were not assessed, nor were the birth weights of the children taken in to consideration as most of them were born in rural hospitals or clinics where accurate records are hardly
kept. Again, if we consider the socio-economical circumstances and the environmental risks these children are exposed to dur-ing childhood (and even before birth), which could be included in the analysis as risk factors, they also may have contributed
to the results obtained in the estimate of the children’s BP(48).
However, the role of these confounding variables was not part of our investigation. Therefore, the data should be interpreted with caution. For example, it would have been interesting to examine the association between nutrition, physical activity, and the other risk factors as well as the ability of these variables to predict the prevalence of hypertension among older children (i.e. 14−16 years of age). Also, it should be noted that this age range, that of childhood, marks the period in which signiicant biological changes occur. However, in view of the sensitivity of assessing biological maturation in the South African context, it was not feasible to evaluate the children’s maturation status using standard indices, such as Tanner’s.
In conclusion, BP increased with age among the boys and girls in our study, and this is positively correlated with stature, body mass, BMI, body fat and the sum of skinfolds. Boys were more predisposed to hypertension than girls, particularly at 11 and 12 years of age. These indings highlight the need for routine measurement of BP as part of periodic physical examinations in school children. More research should be done to evaluate the itness among children and adolescents as well as CVDs risk fac-tors since these are indicafac-tors of disease patterns in adulthood. In this regard, intervention measures should be instituted to address the rising trend of overweight and obesity in both children and adolescents. Such preventive measures would stem the prevalence of the associated disorders, including hypertension.
Acknowledgements
This study was supported with funding from Tshwane University of Technology, Pretoria, South Africa. We thank all the study participants, research assistants, and the school principals involved in this study.
References
1. Itagi V, Patil R. Obesity in children and adolescents and its relationship with hypertension. Turk J Med Sci 2011;41:259-66.
2. Muntner P, He J, Cutler JA, Wildman RP, Whelton PK. Trends in blood pressure among children and adolescents. JAMA 2004;291:2107-13.
3. The Seventh Report of the Joint National Committee on Prevention, Detection, Evaluation, and Treatment of High Blood Pressure: the JNC 7 report. JAMA 2003;289:2560-872.
4. Franklin BA. Treadmill scores to diagnose heart disease and assess prognosis.
ACSM’s Health Fit J 2000;4:29-31.
5. Halpern A, Mancini MC, Magalhaes MEC, Fisberg M, Radominski R, Bertolami MC et al. Metabolic syndrome, dyslipidemia, hypertension and type 2 diabetes in youth: from diagnosis to treatment. Diab Metab Syndr 2010;2:55.
in Iranian adolescents: IHHP - HHPC. Prev Med 2004;39:760-6.
8. Nielsen GA, Andersen LB. The association between high blood pressure, physical itness, and body mass index in adolescents. Prev Med 2003;36:229-34. 9. Ribeiro J, Guerra A, Pinto A, Oliveira J, Duarte J, Mota J. Overweight and obesity
in children and adolescents: relationship with blood pressure, physical activity. Ann Hum Biol 2003;30:203-13.
10. Flores-Huerta S, Klunder-Klunder M, De La Cruz LY, Santos JI. Increase in body mass index and waist circumference is associated with high blood pressure in children and adolescents in Mexico City. Arch Med Res 2009;40:208-15. 11. Ejike EC, Ugwu CE, Ezeanyika LU, Olayemi AT. Blood pressure patterns in relation
to geographic area of residence: A cross-sectional study of adolescents in Kogi state, Nigeria. Pub Health 2008;8:411.
12. Nur N, Cetinkaya S, Yilmaz A, Ayvaz A, Bulut MO, Sumer H. Prevalence of hypertension among high school students in a middle Anatolian Province of Turkey. Health Popul Nutr 2008;26:88-94.
13. Sanchez-Zamorano LM, Salazar -Martinez E, Anaya-Ocampo R, Lazcano-Ponce E. Body mass index associated with elevated blood pressure in Mexican school - aged adolescents. Prev Med 2009;48:543-8.
14. Ray M, Sundaram KR, Paul M, Sudhakar A, Kumar RK. Body mass index trend and its association with blood pressure distribution in children. J Hum Hypertens 2010;24:652-8.
15. Monyeki KD, Kemper HC, Makgae PJ. The association of fat patterning with blood pressure in rural South African children: the Ellisras Longitudinal Growth and Health Study. Int J Epidemiol 2005;35:114-20.
16. Amusa LO, Mbhenyane XG, Toriola AL, Amey AK, Ndaba L, Monyeki KD. The prevalence of hypokinetic risk factors in rural South African children: The Tshannda Longitudinal Study. Afr J Phys Health Educ Recre Dance 2007; Suppl:86-101. 17. Bradshaw D, Steyn K. Poverty and chronic disease in South Africa: Technical
Report. Medical Research Council: Cape Town; 2001.
18. Gillman M, Cook N, Rosner B. Prediction of adult blood pressure from childhood values (Abstract). Am J Epidemiol 1999;134:730.
19. Buonomo E, Pasquarella A, Palombi L. Blood pressure and anthropometry in parents and children of a Southern Italian village. J Hum Hypertens 1996;10 (Suppl):S77-9.
20. National Heart, Lung And Blood Institute/National High Blood Pressure Education Program: Nhbpep Coordinating Committee (1987). Report of the second task force on blood pressure control in children. Pediatrics 1987;79:25.
21. National High Blood Pressure Education Program Working Group on High Blood Pressure in Children and Adolescents. The fourth report on the diagnosis, evaluation and treatment of high blood pressure in children and adolescents. Pediatrics 2004;114:555-76.
22. Zheng L, Sun Z, Li J. Pulse pressure and mean arterial pressure in relation to ischemic stroke among patients with uncontrolled hypertension in rural areas of China. Stroke 2008;39:1932-7.
23. Marfell-Jones M, Olds T, Stew A, Carter L. International standards for anthropometric assessment. Australia: The International Society for the Advancement of Kinanthropometry; 2006.
24. Slaughter MH, Lohman TG, Boileau RA, Horwill CA, Stillman RJ, Van Loan MD et al. Skinfold equation for estimation of body fatness in children and youth. Hum Biol 1988;60:709-23.
25. Cole TJ, Bellizzi MC, Flegal KM, Dietz WH. Establishing a standard deinition for child overweight and obesity worldwide: International survey. Br Med J 2000;320:1240-3.
26. Brandao AA, Pozzan R, Albanesi Filho FM, Brabdao AP. Role of anthropometric indexes and blood pressure as determinants of left ventricular mass and geometry in adolescents: the Rio de Janeiro Study. Hypertension 1995;26:1190-4. 27. Kilmm HD, Reuter-Kuhn I. Pravalenz der hypertonie im kindesalter: eine
untersuchung in 21 hauserztlichen praxen [Prevalence of hypertension in children: a study of 21 family physician practices]. Fortschr Med 1994;112:49-52.
28. Lodolo AD, Novoa P, Sakuyama E, Lodolo MM, Palma JA, Martinez JR. Arterial hypertension in childhood and adolescence. Rev Fac Cien Med Univ Nac Cordoba 1989;47:19-22.
29. Simonatto DM, Dias MD, Machado RI, Abensur H, Cruz J. Arterial hypertension in students of the Great Sao Paulo area. Rev Assoc Med Bras 1991;37:109-14. 30. Ampofo EK. Blood pressure distribution in children at Port Moresby, Papua New
Guinea. PNG Med J 1989;32:101-8.
31. Makgae PJ, Monyeki KD, Brits JS, Kemper HC, Mashita J. Somatotype and blood pressure of rural South African children aged 9-13 years: Ellisras Longitudinal Growth and Health Study. Ann Hum Biol 2007;34:240-51.
32. Monyeki KD, Kemper HC, Makgae PJ. The association of fat patterning with blood pressure in rural South African children: The Ellisras Longitudinal Growth and Health Study. Int J Epidemiol 2006;35:114-20.
33. Aounalian-Skhiri H, Traissac P, Ati JE, Eymard-Duvernay E, Landais E. Nutrition transition among adolescents of a south-Mediterranean country: dietary patterns, association with socio-economic factors, overweight and blood pressure. a cross-sectional study in Tunisia. Nutr J 2011;10:38.
34. Schutte AE, van Rooyen JM, Huisman HW, Kruger HS, Malan NT. The potential role of biotin as dietary risk marker for hypertension in black South African children-the THUSA BANA study. S Afr J Clin Nutr 2003;16:144-8.
35. Misra A, Madhavan M, Vikram NK, Pamdey RM, Dhingra V, Luthra K. Simple anthropometric measures identify fasting hyperinsulinemia and clustering of cardiovascular risk factors in Asian Indian adolescents. Metab Clin Ex 2006;55:1569-73.
36. Mufunda J, Mebrahtu G, Usman A, Nyarango P, Kosia A, Ghebrat Y et al. The prevalence of hypertension and its relationship with obesity: results from a national blood pressure survey in Eritrea. J Hum Hypertens 2006;20:59-65.
37. Triano RP, Flegal KM. Overweight children and adolescents: Description, epidemiology and demographics. Pediatrics 1998;101:497-505.
38. Arno RH, Kathleen MD, James HD. Blood pressure in youth from four ethnic groups: The Pasedena prevention project. J Pediatr 1994;125:368-73. 39. Wolf-Maier K, Cooper RS, Banegas JR, Giampaoli S, Hense HW, Joffres M.
Hypertension prevalence and blood pressure levels in 6 European countries, Canada, and the United States. JAMA 2003;289:2363-9.
40. Lei S, S-Yong YX, Xiao-Han D, Chang-Sheng C. Geographical differences in blood pressure of male youth aged 17-21 years in China. Blood Press 2004;13:169-75. 41. Krishna P, Bajaj S, Thennarasu K, Desai N, Prasammakumar KM. Regional
differences in the reference blood pressure in young Indians. Indian Pediatr 2007;44:921-3.
42. Hamidu LJ, Okoro EO, Ali MA. Blood pressure proile in Nigerian children. East Afr Med J 2000;77:180-4.
43. Monyeki KD, Kemper HC. The risk factors for elevated blood pressure and how to address cardiovascular risk factors: a review in paediatric populations. J Hum Hypertens 2008;22:450-9.
44. Gutin B, Basch C, Shea S, Contento I, Delozier M, Rips J. Blood pressure, itness, and fatness in 5- and 6 -years-old children. JAMA 1990;264:1123-7.
45. Kotchen JM, McKean HE, Neill M, Kotchen TA. Blood pressure trends associated with changes in height and weight from early adolescence to young adulthood. J Clin Epidemiol 1989;42:735-41.
46. Monyeki MA, Toriola AL, Monyeki KD, Brits JS, Pienaar AE. Body size, body composition and physical itness of 7-year-old Ellisras rural children, South Africa: Ellisras Longitudinal Study. Afr J Phys Health Edu Recrea Dance 2004;10:154-62.
47. Musa DI, Lawal B, Fawa M. Body fat and blood pressure levels in school boys in Kano city, Nigeria. The African Symposium: An on-line Edu Res J 2002;2:1-7. 48. O’Brien E, Asmar R, Beilin L, Imai Y, Mancia G. European Society for Hypertension