www.jped.com.br
ORIGINAL ARTICLE
Temporal trends of overall mortality and hospital morbidity due to
diarrheal disease in Brazilian children younger than 5 years from
2000 to 2010
夽
Patrícia S. de A. Mendes
∗, Hugo da C. Ribeiro Jr., Carlos Maurício C. Mendes
MD. PhD. Universidade Federal da Bahia (UFBA), Salvador, BA, Brazil
Received 6 September 2012; accepted 31 October 2012 Available online 26 April 2013
KEYWORDS
Childhood diarrhea; Temporal series studies; Child mortality; Hospitalization
Abstract
Objective: To verify the temporal trends of the indicators of overall mortality and hospital morbidity due to diarrheal disease in children younger than 1 year and between 1 and 4 years, according to the region of Brazil, between 2000 and 2010.
Method: This was an ecological study of temporal series. Data on hospital admission authoriza-tion, mean length of stay, and mean value of the authorization were obtained from the Hospital Information System. The number of infant deaths was obtained from the Mortality Information System; information on live births and the general population were obtained from the Informa-tion System on Live Births and Demographic Censuses, respectively. These data were available at the website of the informatics department of the Brazilian Unified Health System/Ministry of Health
Results: Mortality due to diarrheal disease in Brazil showed a downwards trend in both age groups. Regarding hospitalization, there was a slight downwards trend in children younger than 1 year and a non-significant upwards trend between 1-4 years, with a shorter hospital stay and lower mean value of hospital stay, regardless of age and region. The North and Northeast had the highest mortality rates and the highest percentage of hospitalizations in children younger than 1 year. The Midwest had the highest mean annual reduction in hospital stay.
Conclusion: Currently, the indicators of overall mortality and hospital morbidity due to diarrhea in Brazilian children are generally lower, but decreasing slowly.
© 2013 Sociedade Brasileira de Pediatria. Published by Elsevier Editora Ltda. All rights reserved.
夽 Please cite this article as: Mendes PS, Ribeiro Jr. HC, Mendes CM. Temporal trends of overall mortality and hospital morbidity due to diarrheal disease in Brazilian children younger than 5 years from 2000 to 2010. J Pediatr (Rio J). 2013;89:315---25.
∗Corresponding author.
E-mail:psam.ufba@gmail.com (P.S.d.A. Mendes).
PALAVRAS-CHAVE
Diarreia infantil; Estudos de séries temporais;
Mortalidade infantil; Hospitalizac¸ão
Tendência temporal da mortalidade geral e morbidade hospitalar por doenc¸a
diarreica em crianc¸as brasileiras menores de cinco anos no período de 2000 a 2010
Resumo
Objetivo: Conhecer as tendências temporais dos indicadores de mortalidade geral e morbidade hospitalar por doenc¸a diarreica em crianc¸as menores de um ano e de um a quatro anos, conforme as regiões brasileiras, entre 2000 e 2010.
Método: Estudo ecológico de séries temporais. Os dados sobre Autorizac¸ão de Internac¸ão Hos-pitalar, média de permanência e valor médio dessa autorizac¸ão foram obtidos do Sistema de Informac¸ões Hospitalares; o número de óbitos infantis foi adquirido no Sistema de Informac¸ões sobre Mortalidade; as informac¸ões sobre os nascidos vivos e a populac¸ão geral foram obtidas do Sistema de Informac¸ões sobre Nascidos Vivos e dos Censos Demográficos, respectivamente. Dados disponíveis no enderec¸o eletrônico do Departamento de Informática do Sistema Único de Saúde/Ministério da Saúde.
Resultados: A mortalidade por diarreia no Brasil evidenciou tendência de decréscimo desacel-erado em ambas as faixas etárias. Quanto à hospitalizac¸ão, houve tendência decrescente discreta nos menores de um ano e ascendência insignificante entre 1-4 anos, entretanto, com menor permanência e valor médio de internamento, independentemente da idade e da região. Registraram-se no Norte e Nordeste os maiores coeficientes de mortalidade e maior porcent-agem de internac¸ão nos menores de um ano. O Centro-Oeste apresentou maior reduc¸ão média anual do tempo de permanência hospitalar.
Conclusão: Atualmente, os indicadores de mortalidade geral e morbidade hospitalar por diar-reia em crianc¸as brasileiras encontram-se, de forma geral, mais baixos, porém lentamente decrescentes.
© 2013 Sociedade Brasileira de Pediatria. Publicado por Elsevier Editora Ltda. Todos os direitos reservados.
Introduction
Diarrheal disease (DD) is considered a public health problem with high morbidity and mortality worldwide.1The demand
for healthcare in the emergency department is high, often resulting in hospitalization and risk of death due to dehy-dration.
In 2008, infectious diseases were responsible for approxi-mately six million deaths worldwide in children younger than 5 years. DD was responsible for 15% of these deaths (1.336 million), after pneumonia (18%, 1.575 million).2 In Brazil,
between 1995 and 2005, there were 1,505,800 hospitaliza-tions and 39,421 deaths of children younger than 1 year of age due to diarrhea and its complications.3
In some countries, oral rehydration therapy (ORT) was able yield a reduction of approximately 75% in infant deaths and of 61% in hospitalizations due to diarrhea between 1980 and 2008.4,5 However, there has been some
stabiliza-tion in the rates of morbidity and mortality caused by this disease.6,7
The worldwide rates of morbidity and mortality from diarrhea, although lower, are not acceptable, consider-ing that the disease can be prevented through relatively simple public health measures. Recent advances in the pre-vention and treatment of diarrheal disease, such as the formulation of improved oral rehydration solution, zinc supplementation, rotavirus vaccines, and vitamin A supple-mentation, are some of the measures proposed by the World Health Organization and the United Nations Children’s Fund (WHO/UNICEF) to reduce these epidemiological indicators and revitalize DD control.1 However, evidence suggests a
slow global progress since 2000 regarding the implemen-tation of the new recommendations for the treatment and prevention of diarrhea.1
Given the above considerations and regional differences in Brazil, this study aimed to understand the temporal trends of indicators of overall mortality and hospital morbidity due to diarrheal disease in children younger than 1 year and between 1 and 4 years, according to the regions of Brazil, between 2000 and 2010.
Methods
This was an ecological study of temporal series performed based on hospital morbidity data from the Brazilian Uni-fied Health System (Sistema Único de Saúde - SUS), such as hospital admission authorization (HAA), mean length of hos-pital stay, and mean HAA value obtained from the Hoshos-pital Information System (Sistema de Informac¸ões Hospitalares ---SIH/SUS); the number of infant deaths was obtained from the Mortality Information System (Sistema de Informac¸ões sobre Mortalidade --- SIM); information on live births and the general population were obtained from the Live Birth Information System (Sistema de Informac¸ões sobre Nascidos Vivos --- SINASC) and demographic censuses from the Brazilian Institute of Geography and Statistics (Instituto Brasileiro de Geografia e Estatística --- IBGE), respectively. This evaluation included collection of pre-existing data, obtained from the SUS database, available on the website of the SUS Informat-ics Department (DATASUS)8The code used for data selection
origin), according to the tenth International Classification of Diseases (ICD-10).9
The coefficient of mortality, hospitalization rate, mean hospital stay, mean hospitalization values, and percent-age of hospitalization of children younger than 1 year and between 1 and 4 years were described, as these age groups are the most vulnerable to this disease.
Calculation procedures
The infant mortality rate for diarrhea was defined as the total number of deaths due to diarrhea in children younger than 1 year x 1,000 by the number of live births (LB). The mortality rate of children aged between 1 and 4 years due to diarrhea was defined as the total number of deaths due to diarrhea in children in this age group x 100,000 by the number of children aged between 1 and 4 years.
The rate of hospitalization due to diarrhea in children younger than 1 year was defined as the number of hospital-izations due to diarrhea in children younger than 1 year x 1,000 by the number of live births and the rate of hospital-ization of children aged between 1 and 4 years as the number of hospitalizations due to diarrhea children at this age group x 100,000 by the number of children aged between 1 and 4 years.
The proportion of hospitalizations due to diarrhea in chil-dren younger than 1 year was defined as the number of hospitalizations due to diarrhea in children younger than 1 year x 100 by the total number of hospitalizations in children younger than 1 year and the proportion of hospitalization of children aged between 1 and 4 years was defined as the num-ber of hospitalizations due to diarrhea in children in this age group x 100 by the total number of hospitalizations of chil-dren aged between 1 and 4 years. Hospital stay and mean hospitalization value due to diarrhea were obtained directly from DATASUS.
For the analysis of the temporal series, dynamic regres-sion models were used (regresregres-sion with ARIMA errors),10
as they allow for the incorporation and adjustment of the effect of a historical series autocorrelation, reducing such bias when estimating trends. For the total of the 50 series studied, those that were non-stationary were dif-ferentiated. Then, structural parameters of auto-regression and moving averages were estimated (autocorrelation (AR), differentiation (d), moving average (MA)), with an ARIMA notation (AR, d, MA), as well as the slopes of the regressions () representing the changes in average trends of the series, per year.
To diagnose the best model, the Akaike’s information criterion10 that provided the least value was obtained for
each series, together with the residual analysis, observa-tion of autocorrelaobserva-tion and partial autocorrelaobserva-tion graphs (descriptively through the Ljung-Box test), evaluation of parameter overestimation, and comparison of the original data with those predicted by the models. As the entire tar-get population was studied, inferential statistics were not calculated. The statistical package R, release 2.15.1, was used for the analysis of data in this temporal series.11
The Committee of Ethics in Research of the Complexo Hospitalar Universitário Professor Edgard Santos (COM-HUPES) approved this study under protocol No. 001/01/2012
as an addendum to a previously approved project by the same committee under protocol No. 121/2003.
Results
According to official data from the Brazilian Ministry of Health, during the study period there were 22,933 deaths among children younger than 5 years due to ICD A09 (80.3% in children younger 1 year) and 1,209,622 hospitalizations (62.6% in children between 1 and 4 years); the Northeast accounted for 57% and 46%, respectively.
Coefficients of mortality due to diarrhea --- ICD 409
There was a reduction in the number of deaths in chil-dren younger than 1 year from approximately 77% in 2000 (2,738) to 2010 (632) versus 57% (541/235) among children aged 1 to 4 years. Between the extremes of the temporal series, reductions in the infant mortality rate from 0.96/1,000 to 0.39/1,000 in the North, from 1.62/1,000 to 0.38/1,000 in the Northeast, from 0.71/1,000 to 0.23/1,000 in the Midwest, from 0.43/1,000 to 0.1/1,000 in the Southeast, and from 0.5/1,000 to 0.08/1,000 in the South were observed. Regarding the coefficient of mor-tality of children aged between 1 to 4 years, there was a reduction from 6.81/100,000 to 5.04/100,000 in the North, from 6.05/100,000 to 2.52/100,000 in the Northeast, from 5.76/100,000 to 3.17/100,000 in the Midwest, from 1.99/100.000 to 1.13/100,000 in the Southeast, and from 2.86/100,000 to 0.85/100,000 in the South.
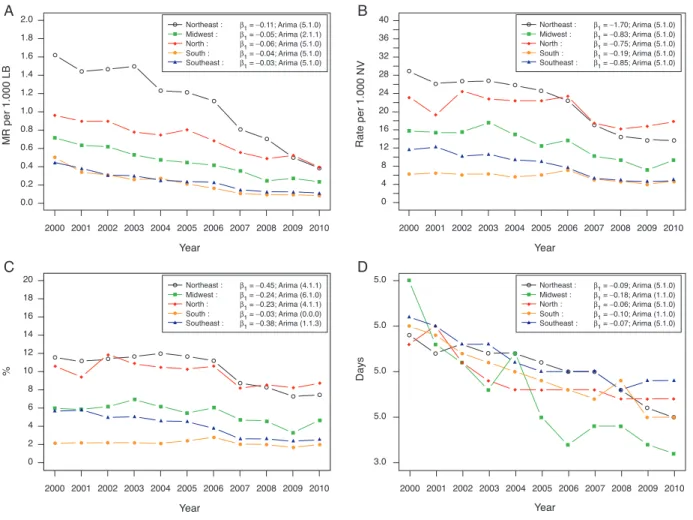
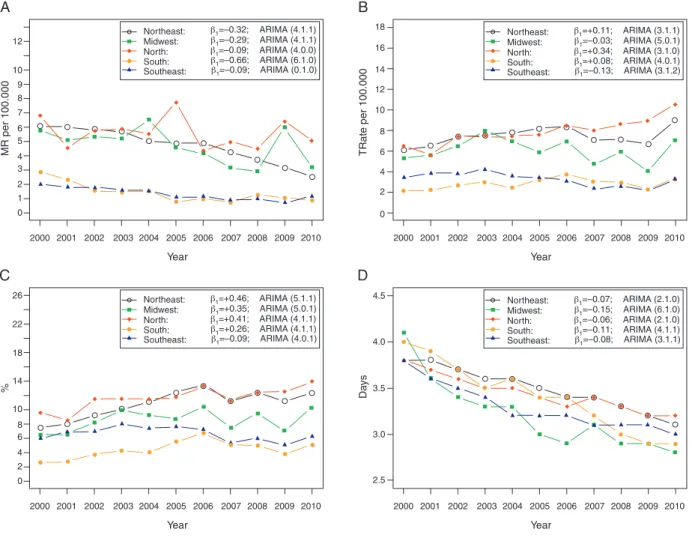
Figs. 1A and 2A show the downward trend in coefficients of mortality by age group and by region during the study period. For the age range younger than 1 year, all regions showed a slow decrease over time, ranging on aver-age from 0.03 to 0.11 deaths/year/1,000 LB (3 to 11 deaths/year/100,000 LB). Although the Northeast (1 = -0.11) had the largest annual decrease, it was also the region, throughout almost the entire period, with the highest rates of infant mortality from diarrhea (ranging from 1.62 to 0.38 deaths/1,000 LB), followed by the North (1 = -0.06). Among older children, the mean annual reduction in the coeffi-cient of mortality ranged from 0.09 to 0.66 deaths/100,000 (Tables 1 and 2). The North (5.6 deaths/100,000), Northeast (4.7 deaths/100,000), and Midwest (4.7 deaths/100,000) had, on average, higher values of mortality coefficients when compared to the South (1.4 deaths/100,000) and Southeast (1.3 deaths/100,000) during the ten-year study period.
Hospital morbidity
Northeast : Midwest : North : South : Southeast :
β1 = −0.11; Arima (5.1.0) β1 = −0.05; Arima (2.1.1) β1 = −0.06; Arima (5.1.0) β1 = −0.04; Arima (5.1.0) β1 = −0.03; Arima (5.1.0)
Northeast : Midwest : North : South : Southeast :
β1 = −0.45; Arima (4.1.1) β1 = −0.24; Arima (6.1.0) β
1 = −0.23; Arima (4.1.1)
β1 = −0.03; Arima (0.0.0) β
1 = −0.38; Arima (1.1.3)
Northeast : Midwest : North : South : Southeast :
β1 = −1.70; Arima (5.1.0) β1 = −0.83; Arima (5.1.0) β1 = −0.75; Arima (5.1.0) β1 = −0.19; Arima (5.1.0) β1 = −0.85; Arima (5.1.0)
Northeast : Midwest : North : South : Southeast :
β1 = −0.09; Arima (5.1.0) β1 = −0.18; Arima (1.1.0) β
1 = −0.06; Arima (5.1.0)
β1 = −0.10; Arima (1.1.0) β
1 = −0.07; Arima (5.1.0)
2000 2001 2002 2003 2004 2005 2006 2007 2008 2009 2010
2000 2001 2002 2003 2004 2005 2006 2007 2008 2009 2010 Year Year Year 0 5.0 5.0 5.0 5.0 3.0 4 8 12 16 20 24 28 32 36 40
2000 2001 2002 2003 2004 2005 2006 2007 2008 2009 2010
Year
2000 2001 2002 2003 2004 2005 2006 2007 2008 2009 2010 0 2 4 6 8 10 12 14 16 18 20
Rate per 1.000 NV
MR per 1.000 LB
% Days 0.2 0.0 0.4 0.6 0.8 1.0 1.2 1.4 1.6 1.8 2.0
A
C
D
B
Figure 1 (A) Child mortality coefficient per 1,000 LB due to diarrhea, according to the regions of Brazil, 2000-2010. (B) Child hospitalization rate per 1,000 LB due to diarrhea, according to the regions of Brazil, 2000-2010. (C) Percentage of children hospi-talized due to diarrhea, according to the regions of Brazil, 2000-2010. (D) Mean hospital stay in days due to diarrhea, according to the regions of Brazil, 2000-2010. MR, mortality rate; LB, live births;1, slope coefficient.
(1 = -1.70 --- reduction of 1.7 hospitalizations per thousand LB each year) (Table 1).
Among older children, a stabilization trend was observed, with a non-significant increase (Fig. 2B), except in the Southeast, which presented a slight decrease in hospital-ization rates (1 = -0.13) (Table 2). The same pattern was observed regarding the percentage of estimated annual hospitalizations in both age groups in the last decade (Tables 1 and 2); however, it could be observed that the North and Northeast had more hospitalized children due to diarrhea, especially among children younger than 1 year (Figs. 1C and 2C). On average, the rate of hos-pitalizations among children younger than 1 year in the Northeast was 10.2% (standard deviation [SD] = 1.9%); in the North, 9.8% (SD = 1.2%); in the Southeast, 4% (SD = 1.3%); in the Midwest, 5.4% (SD = 1.0%); and in the South, 2.2% (SD = 0.3%). For older children, on average, the rate of hos-pitalization in the Northeast was 10.7% (SD = 1.9%); in the North, 11.6% (SD = 1.5%); in the Southeast, 6.5% (SD = 1.0%); in the Midwest, 8.5% (SD = 1.5%); and in the South, 5.3% (SD = 1.2%).
The mean length of hospital stay during the study period was 4 days in those younger than 1 year and 3.4 days in children aged between 1 and 4 years, with a reduction of
approximately 20% (0.85 days) between 2000 and 2010 in both age groups.
Figs. 1D and 2D demonstrates that the mean length of stay is decreasing and homogeneous in all regions, except for the Midwest, which presented a heterogeneous pattern, especially in children younger than 1 year; however, the Midwest presented the highest estimated annual decrease, although negligible, in the mean length of stay (days) in both age groups (1 = -0.18/1 = -0.15) (Tables 1 and 2).
The mean value paid by HAA in 2000/2010 was R$ 405.36 (US$ 221.14)/R$ 368.43 (US$ 209.72) and R$ 360.12 (US$ 196.46)/R$ 347.62 (US$ 197.88), for children younger than 1 year and between 1 and 4 years, respectively. This repre-sents a reduction of 9.1% and 3.5%, respectively, for a mean stay of 4 days. The value of HAA in 2000 was adjusted for inflation, based on the year 2010.
Discussion
Mortality
12
A
B
10 9 8 7 6 5 4 3 2 1 02000 2001 2002 2003 2004 2005 Northeast:
Southeast: β1=–0.09; ARIMA (0.1.0) β1=–0.66; ARIMA (6.1.0) β1=–0.09; ARIMA (4.0.0) β1=–0.29; ARIMA (4.1.1) β1=–0.32; ARIMA (4.1.1)
South: North: Midwest:
2006 2007 2008 2009 2010
Year
MR per 100.000
0 2 4 6 8 10 12 14 16 18
2000 2001 2002 2003 2004 2005 Northeast:
Southeast: β1=–0.13; ARIMA (3.1.2) β1=+0.08; ARIMA (4.0.1) β1=+0.34; ARIMA (3.1.0) β1=–0.03; ARIMA (5.0.1) β1=+0.11; ARIMA (3.1.1)
South: North: Midwest:
2006 2007 2008 2009 2010
Year
TRate per 100.000
22 26
C
D
18 14 10 8 6 4 2 02000 2001 2002 2003 2004 2005 Northeast:
Southeast: β1=–0.09; ARIMA (4.0.1) β1=+0.26; ARIMA (4.1.1) β1=+0.41; ARIMA (4.1.1) β1=+0.35; ARIMA (5.0.1) β1=+0.46; ARIMA (5.1.1)
South: North: Midwest:
2006 2007 2008 2009 2010
Year % 2.5 3.0 3.5 4.0 4.5
2000 2001 2002 2003 2004 2005 Northeast:
Southeast: β1=–0.08; ARIMA (3.1.1) β1=–0.11; ARIMA (4.1.1) β1=–0.06; ARIMA (2.1.0) β1=–0.15; ARIMA (6.1.0) β1=–0.07; ARIMA (2.1.0)
South: North: Midwest:
2006 2007 2008 2009 2010
Year
Da
ys
Figure 2 (A) Overall mortality rate per 100,000 children aged 1 to 4 years due to diarrhea, according to the regions of Brazil, 2000-2010. (B) Rate of hospitalization per 100,000 children aged 1 to 4 years due to diarrhea, according to the regions of Brazil, 2000-2010. (C) Percentage of hospitalization in children 1 to 4 years due to diarrhea, according to the regions of Brazil, 2000-2010. (D) Mean days of hospitalization in children aged 1 to 4 years due to diarrhea, according to the regions of Brazil, 2000-2010. MR, mortality rate;1, slope coefficient.
Brazil3,12,13and worldwide.2,6However, it has been reported
that progress in the decease of global mortality has not been accelerated, when compared with three decades ago;7the
same was observed in Brazil in the previous decade.13 In
parallel, a slow progress has been observed in the imple-mentation of the new global recommendations for diarrhea control.1 Contaminated water, inadequate sanitation, and
poor hygiene still account for 88% of world deaths due to diarrhea.1
This slow progress in the management of diarrheal dis-ease may be a factor contributing to the stabilization of infant mortality, since this disease is the second infectious cause of this indicator worldwide.1,2
It is fair to say that the current rates of mortality attributable to this disease in Brazil, albeit low, are still unacceptable. This is a disease transmitted via fecal-oral route; it is self-limited, preventable, of simple manage-ment at home with ORS, and does not require technology or relatively high costs for its prevention.
In some parts of Brazil, diarrhea is still a major public health problem.3 The regional heterogeneity in
mortality rates from diarrhea described here reflects the
socioeconomic and cultural inequality, as well as the diffi-culty of access to health care and sanitation.The Northeast and Midwest showed higher rates of reduction in these coefficients when compared to the South and Southeast. Although these regions showed higher levels of these indi-cators in 2000, which could explain the higher rates of reduction, it is possible that this downward trend is a reflection of national public health strategies, such as the Family Health program, training programs for profes-sionals on diarrheal disease monitoring, rotavirus vaccine campaigns, breastfeeding encouragement programs, and vitamin A supplementation. These strategies were imple-mented in important sectors, especially after the 1990s, with promising results on the impact of overall mortality, as well as mortality due to diarrheal disease, in children younger than 5 years.3,14---17
It is possible that the recent investments aimed at reduc-ing inequalities have been an important factor on infant mortality due to diarrhea in some regions;3 however, this
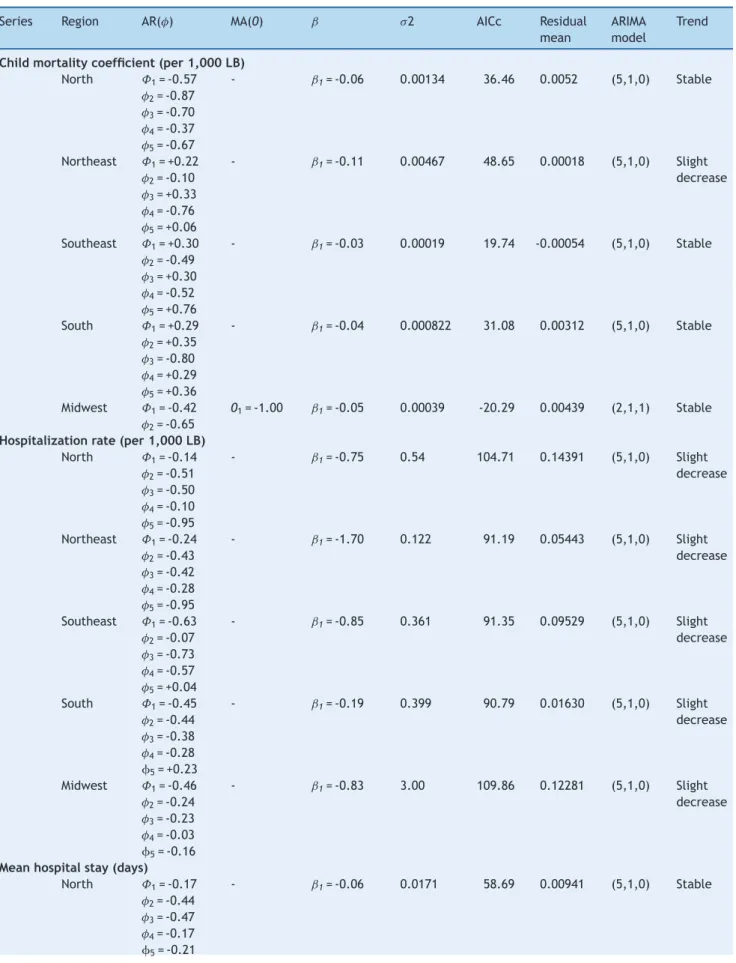
Table 1 Estimated coefficients per year for temporal series of diarrhea in children younger than 1 year according to the region.
Series Region AR() MA(0) ˇ 2 AICc Residual
mean
ARIMA model
Trend
Child mortality coefficient (per 1,000 LB)
North ˚1= -0.57 2= -0.87 3= -0.70 4= -0.37 5= -0.67
- ˇ1= -0.06 0.00134 36.46 0.0052 (5,1,0) Stable
Northeast ˚1= +0.22 2= -0.10 3= +0.33 4= -0.76 5= +0.06
- ˇ1= -0.11 0.00467 48.65 0.00018 (5,1,0) Slight decrease
Southeast ˚1= +0.30 2= -0.49 3= +0.30 4= -0.52 5= +0.76
- ˇ1= -0.03 0.00019 19.74 -0.00054 (5,1,0) Stable
South ˚1= +0.29 2= +0.35 3= -0.80 4= +0.29 5= +0.36
- ˇ1= -0.04 0.000822 31.08 0.00312 (5,1,0) Stable
Midwest ˚1= -0.42 2= -0.65
01= -1.00 ˇ1= -0.05 0.00039 -20.29 0.00439 (2,1,1) Stable
Hospitalization rate (per 1,000 LB)
North ˚1= -0.14 2= -0.51 3= -0.50 4= -0.10 5= -0.95
- ˇ1= -0.75 0.54 104.71 0.14391 (5,1,0) Slight decrease
Northeast ˚1= -0.24 2= -0.43 3= -0.42 4= -0.28 5= -0.95
- ˇ1= -1.70 0.122 91.19 0.05443 (5,1,0) Slight decrease
Southeast ˚1= -0.63 2= -0.07 3= -0.73 4= -0.57 5= +0.04
- ˇ1= -0.85 0.361 91.35 0.09529 (5,1,0) Slight decrease
South ˚1= -0.45 2= -0.44 3= -0.38 4= -0.28 5= +0.23
- ˇ1= -0.19 0.399 90.79 0.01630 (5,1,0) Slight decrease
Midwest ˚1= -0.46 2= -0.24 3= -0.23 4= -0.03 5= -0.16
- ˇ1= -0.83 3.00 109.86 0.12281 (5,1,0) Slight decrease
Mean hospital stay (days)
North ˚1= -0.17 2= -0.44 3= -0.47 4= -0.17 5= -0.21
Table 1 (Continued)
Series Region AR() MA(0) ˇ 2 AICc Residual
mean
ARIMA model
Trend
Northeast ˚1= -0.21 2= +0.18 3= -0.02 4= -0.24 5= +0.07
- ˇ1= -0.09 0.00763 50.03 0.00011 (5,1,0) Stable
Southeast ˚1= -0.06 2= +0.16 3= +0.24 4= +0.10 5= -0.82
- ˇ1= -0.07 0.00197 43.07 -0.0073 (5,1,0) Stable
South ˚1= -0.58 ˇ1= -0.10 0.0124 -5.08 0.00056 (1,1,0) Slight decrease Midwest ˚1= -0.30 ˇ1= -0.18 0.0996 15.41 -0.01159 (1,1,0) Slight
decrease
Percentage of hospitalization (%)
North ˚1= -0.87 2= -0.46 3= -0.12 4= +0.48
01= +0.98 ˇ1= -0.23 0.349 93.83 -0.00403 (4,1,1) Slight decrease
Northeast ˚1= +0.12 2= +0.27 3= -0.41 4= -0.59
01= -1.00 ˇ1= -0.45 0.112 84.74 0.08130 (4,1,1) Slight decrease
Southeast ˚1= -0.48 01= +0.08 02= -0.08 03= -0.99
ˇ1= -0.38 0.0645 45.67 0.026105 (1,1,3) Slight decrease
South - - ˇ1= -0.03
ˇ0= +2.32
0.062 10.11 0 (0,0,0) Stable
Midwest ˚1= -0.62 2= -0.08 3= -0.34 4= -0.04 5= -0.58 6= -0.90
- ˇ1= -0.24 0.0758 173.72 0.07072 (6,1,0) Slight decrease
AR(), Autoregressive term; ARIMA, autoregressive integrated moving average; cAIC, corrected Akaike information criterion; MA(0), moving average term;, model coefficient;0, intercept;1, slope coefficient;2, variance average.
Such prevention strategies were considered models for export;16 however, regarding the treatment of diarrhea,
Brazil does not explicitly adopt the recommendation of low-osmolarity ORS (66 countries) and zinc supplementation (46 countries). This occurs, perhaps, due to the difficulty to acquire and/or handle the products, mainly by the finan-cial investment involved in this process.1According to the
National Survey on Demography and Health/2006, Brazil used the ‘‘homemade hydration solution’’ more frequently than other forms of ORS (government-provided solution and commercially available solutions) to revert cases of morbid diarrhea.18
Hospital morbidity
Lower numbers of deaths from diarrhea have been recorded, but without a proportional decrease in morbidity attributable to this disease,6,18which imposes a heavy
bur-den on the public health system.19The present study showed
a slow annual reduction in rates of hospitalization for diar-rhea in children younger than 1 year and a slight increase in children between 1 and 4 years, demonstrating that hos-pitalizations remained generally stable, despite a modest increase in some regions of the country (North/Northeast).
National literature mentions a reduction of approxi-mately 40% to 60% in the rate of hospitalization in children younger than 1 year,3,20 with different evolutions between
the Brazilian regions and stabilization between the ages of 1 and 4 years,20 but at different time periods. In the U.S.,
diarrhea was considered a major cause of hospitalization of children younger than 5 years in 2000, with an expected reduction after rotavirus vaccination measures.21 This fact
was recorded in Brazil,15 mainly in children younger than
1 year, although in the present study a small reduction in hospitalization rates was observed, perhaps explained by the low and variable rotavirus vaccine coverage achieved since 2006 in Brazil.8Even though the Brazilian Ministry of
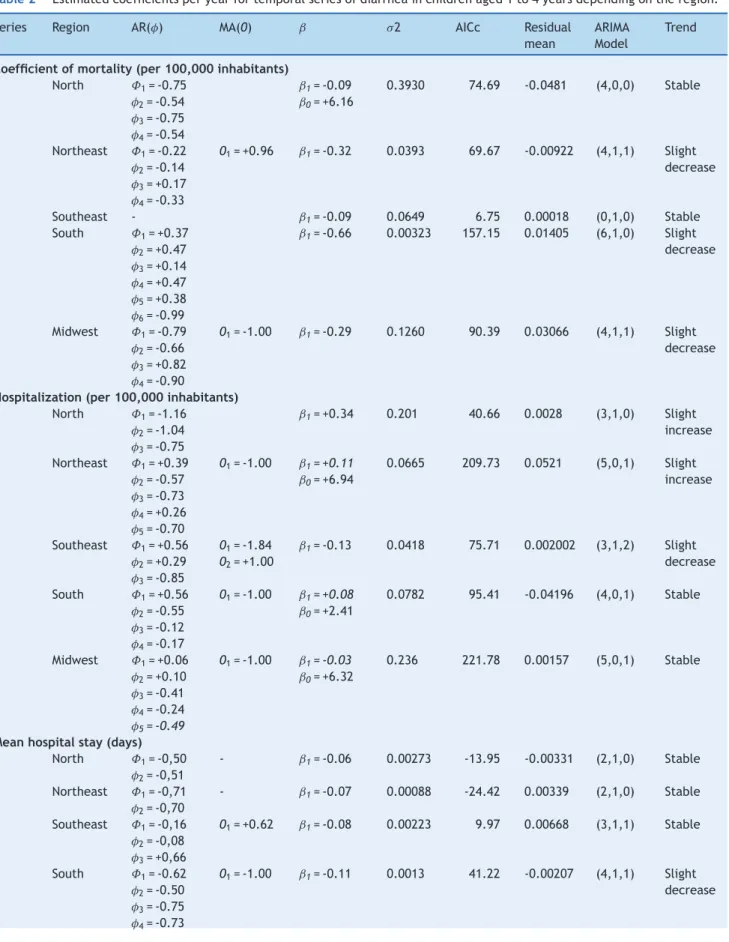
Table 2 Estimated coefficients per year for temporal series of diarrhea in children aged 1 to 4 years depending on the region.
Series Region AR() MA(0) ˇ 2 AICc Residual
mean
ARIMA Model
Trend
Coefficient of mortality (per 100,000 inhabitants)
North ˚1= -0.75 2= -0.54 3= -0.75 4= -0.54
ˇ1= -0.09
ˇ0= +6.16
0.3930 74.69 -0.0481 (4,0,0) Stable
Northeast ˚1= -0.22 2= -0.14 3= +0.17 4= -0.33
01= +0.96 ˇ1= -0.32 0.0393 69.67 -0.00922 (4,1,1) Slight decrease
Southeast - ˇ1= -0.09 0.0649 6.75 0.00018 (0,1,0) Stable
South ˚1= +0.37 2= +0.47 3= +0.14 4= +0.47 5= +0.38 6= -0.99
ˇ1= -0.66 0.00323 157.15 0.01405 (6,1,0) Slight decrease
Midwest ˚1= -0.79 2= -0.66 3= +0.82 4= -0.90
01= -1.00 ˇ1= -0.29 0.1260 90.39 0.03066 (4,1,1) Slight decrease
Hospitalization (per 100,000 inhabitants)
North ˚1= -1.16 2= -1.04 3= -0.75
ˇ1= +0.34 0.201 40.66 0.0028 (3,1,0) Slight increase
Northeast ˚1= +0.39 2= -0.57 3= -0.73 4= +0.26 5= -0.70
01= -1.00 ˇ1=+0.11
ˇ0= +6.94
0.0665 209.73 0.0521 (5,0,1) Slight increase
Southeast ˚1= +0.56 2= +0.29 3= -0.85
01= -1.84 02= +1.00
ˇ1= -0.13 0.0418 75.71 0.002002 (3,1,2) Slight decrease
South ˚1= +0.56 2= -0.55 3= -0.12 4= -0.17
01= -1.00 ˇ1=+0.08
ˇ0= +2.41
0.0782 95.41 -0.04196 (4,0,1) Stable
Midwest ˚1= +0.06 2= +0.10 3= -0.41 4= -0.24 5=-0.49
01= -1.00 ˇ1=-0.03
ˇ0= +6.32
0.236 221.78 0.00157 (5,0,1) Stable
Mean hospital stay (days)
North ˚1= -0,50 2= -0,51
- ˇ1= -0.06 0.00273 -13.95 -0.00331 (2,1,0) Stable
Northeast ˚1= -0,71 2= -0,70
- ˇ1= -0.07 0.00088 -24.42 0.00339 (2,1,0) Stable
Southeast ˚1= -0,16 2= -0,08 3= +0,66
01= +0.62 ˇ1= -0.08 0.00223 9.97 0.00668 (3,1,1) Stable
South ˚1= -0.62 2= -0.50 3= -0.75 4= -0.73
Table 2 (Continued)
Series Region AR() MA(0) ˇ 2 AICc Residual
mean
ARIMA Model
Trend
Midwest ˚1= -0.40 2= +0.84 3= +0.60 4= +0.84 5= -0.99
- ˇ1= -0.15 0.00053 138.94 0.00150 (6,1,0) Slight decrease
Percentage of hospitalization (%)
North ˚1= -1.06 2= -0.65 3= -0.23 4= +0.36
01= +0.97 ˇ1= +0.41 0.344 93.32 -0.00133 (4,1,1) Slight increase
Northeast ˚1= -0.18 2= +0.03 3= -0.25 4= -0.39 5= -0.63
01= -1.00 ˇ1= +0.46 0.27 184.02 0.15042 (5,1,1) Slight increase
Southeast ˚1= +0.09 2= +0.42 3= -0.37 4= -0.68
01= -1.00 ˇ1= -0.09
ˇ0= +7.19
0.0524 97.46 -0.01261 (4,0,1) Stable
South ˚1= +0.43 2= -0.22 3= -0.18 4= -0.21
01= -1.00 ˇ1= +0.26 0.531 95.44 0.11548 (4,1,1) Slight increase
Midwest ˚1= -0.11 2= +0.55 3= +0.03 4= -0.43 5= -0.59
01= -1.00 ˇ1= +0.35
ˇ0= +6.30
0.224 223.85 0.06615 (5,0,1) Slight increase
AR(), Autoregressive term; ARIMA, autoregressive integrated moving average; cAIC, corrected Akaike information criterion; MA(0), moving average term;, model coefficient;0, intercept;1, slope coefficient;2, variance.
coverage achieved was 84.4% in 2009, and the mean was only 58.7% in the country between 2006 and 2010.
In spite of the mentioned reduction, gastroenteritis and its complications are the leading cause of hospitalization of children younger than 5 years due to conditions treated in primary care between 1999 and 2006, with higher rates of hospitalization in the North, Northeast, and Midwest.20
The trend in this series was similar: the North and Northeast accounted for the greatest number of hospitalizations, espe-cially in children younger than 1 year, throughout the study period. This is possibly due to socioeconomic and cultural differences historically found in these regions, in addition to the increased demand for public hospitals in these regions.18
The recommendation of hospitalization during an episode of diarrhea is restricted to complicated cases with severe dehydration due to hypovolemic shock and high risk of death, in addition to small infants, malnourished patients, those with elevated fecal loss, and those whose caregiver is unable to successfully manage the disease at home.23
Furthermore, the low level of education in certain regions of Brazil account for most of the hospitalizations.18Despite
the success of preventive strategies to control diarrheal disease in Brazil, the deficit of primary care in some regions affects the redirection of care in cases of diarrhea
to emergencies,19,24 with presumed risk of hospitalization
secondary to multifactorial causes, favoring the mismanage-ment of the case (intravenous rehydration, unnecessary use of drugs, excessive tests), increasing the time and cost of hospitalization.4,19,25---27
In this study, the mean hospital length of stay during ten years was reduced by only 20% (0.85 days), with a mean of 4 days among children younger than 1 year and 3.4 days in those aged 1 to 4 years. The Midwest and South had the highest rates of annual decrease, a fact that needs further investigation to better understand such behavior.
Associated with a modest reduction in hospital length of stay, there was a small reduction in mean hospitaliza-tion value (adjusted for inflahospitaliza-tion during the period), and it was assumed that investments targeted to reduce the length of hospitalization may represent a reduction in the health system burden attributed to diarrheal disease.
In Brazil, in 2010, approximately R$ 9.8 million were spent on hospital admissions of children younger than 1 year with diarrhea, and R$ 23.5 million for those aged between 1 and 4 years;8 these resources could have been invested
per procedure, not necessarily associated with the actual costs of the hospitalization;28 therefore, these values may
be underestimated.
Research priorities are being defined to reduce the over-all morbimortality of childhood diarrhea by 2015; the main areas are targeted for public health and epidemiological policies in order to understand the barriers to the imple-mentation and to optimize the available programs and interventions.29
It appears that strategies aimed at reducing the num-ber of hospitalizations and length of hospital stay, with consequent reduction in cost and risk to the patient, are appropriate in the management of diarrheal disease in Brazil.
Conclusion
The levels of mortality rates in children from diarrhea were found to be lower and slowly decreasing over the study period. Hospitalization rates remained stable, and there was a slight decrease in hospital length of stay and hospi-tal costs during disease management. There were regional differences for all indicators, except for the mean hospital stay.
Clear and socially regulated public policies aiming pri-marily at reducing social differences; enabling collective sanitary measures; structuring health services; training human resources; and encouraging and financing research in local health diagnosis, information solutions, prevention, and treatment must be strategically coordinated so they can effectively extend the scope and resolution of what has been achieved when addressing this specific but crucial health situation.
Conflicts of interest
The authors declare no conflicts of interest.
References
1. Wardlaw T, Salama P, Brocklehurst C, Chopra M, Mason E. Diar-rhoea: why children are still dying and what can be done. Lancet. 2010;375:870---2.
2. Black RE, Cousens S, Johnson HL, Lawn JE, Rudan I, Bas-sani DG, et al. Global, regional, and national causes of child mortality in 2008: a systematic analysis. Lancet. 2010;375: 1969---87.
3. Oliveira TC, Latorre MdoR. Trends in hospital admission and infant mortality from diarrhea: Brazil, 1995-2005. Rev Saude Publica. 2010 fev;44:102---11.
4. Santosham M, Chandran A, Fitzwater S, Fischer-Walker C, Baqui AH, Black R. Progress and barriers for the control of diarrhoeal disease. Lancet. 2010;376:63---7.
5. WHO. Impact of oral rehydration therapy on hospital admis-sion and case-fatality rates for diarrhoeal disease: results from 11 countries. Weekly Epidemiological Record. 1988;8: 49---52.
6. Kosek M, Bern C, Guerrant RL. The global burden of diarrhoeal disease, as estimated from studies published between 1992 and 2000. Bull World Health Organ. 2003;81: 197---204.
7. Murray CJ, Laakso T, Shibuya K, Hill K, Lopez AD. Can we achieve Millennium Development Goal 4? New analysis of coun-try trends and forecasts of under-5 mortality to 2015. Lancet. 2007;370:1040---54.
8. Brasil. Ministério da Saúde. DATASUS, Informac¸ões de saúde - Brasil. 2012 [accessed 13 aug 2010]. Available from: http://tabnet.datasus.gov.br
9. OMS. CID-10, V. 1-Classificac¸ao internacional de doenc¸as e problemas relacionados a saúde. São Paulo: Edusp; 2000.
10. Shumway RH, Stoffer DS. Time series analysis and its appli-cations: with R examples. 2nd ed. Nova Iorque: Springer;
2006.
11. Team RDC. R: A language and environment for statistical computing. Vienna, Austria:The R Foundation for Statistical Computing. Available from: http://www.r-project.org 12. Holcman MM, Latorre Mdo R, Santos JL. Evoluc¸ão da mortalidade
infantil na região metropolitana de São Paulo, 1980-2000. Rev Saude Publica. 2004;38:180---6.
13. Duarte CM. Reflexos das políticas de saúde sobre as tendências da mortalidade infantil no Brasil: revisão da lit-eratura sobre a última década. Cad Saude Publica. 2007;23: 1511---28.
14. Rasella D, Aquino R, Barreto ML. Reducing childhood mortality from diarrhea and lower respiratory tract infections in Brazil. Pediatrics. 2010;126:e534---40.
15. do Carmo GMI, Yen C, Cortes J, Siqueira AA, de Oliveira WK, Cortez-Escalante JJ, et al. Decline in diarrhea mortality and admissions after routine childhood rotavirus immuniza-tion in Brazil: a time-series analysis. PLoS Med. 2011;8: e1001024.
16. Victora CG. Diarrhea mortality: what can the world learn from Brazil? J Pediatr (Rio J). 2009;85:3---5.
17. Escuder MM, Venancio SI, Pereira JC. Estimativa de impacto da amamentac¸ão sobre a mortalidade infantil. Rev Saude Publica. 2003;37:319---25.
18. Brasil. Ministério da Saúde. PNDS - pesquisa nacional de demografia e saúde da crianc¸a e da mulher [accessed 12 oct 2012]. Available from: http://bvsms.saude.gov.br/bvs/pnds/ index.php
19. Tieder JS, Robertson A, Garrison MM. Pediatric hospital adher-ence to the standard of care for acute gastroenteritis. Pediatrics. 2009;124:e1081---7.
20. Moura BA, Cunha RC, da, Aquino R, Medina MG, Mota EA, Macinko J, et al. The main causes of hospitalization for pri-mary health care sensitive conditions in Brazil: an analysis by age groups and region. Rev Bras de Saude Matern Infantil. 2010;10:s83---91.
21. Malek MA, Curns AT, Holman RC, Fischer TK, Bresee JS, Glass RI, et al. Diarrhea-and rotavirus-associated hospitalizations among children less than 5 years of age: United States, 1997 and 2000. Pediatrics. 2006;117:1887---92.
22. Brasil. Ministério da Saúde. Secretaria de Vigilância em Saúde. Departamento de Vigilância Epidemiológica. Informe técnico doenc¸a diarréica por rotavírus: vigilância epi-demiológica e prevenc¸ão pela vacina oral de rotavírus humano VORH, 2006 [accessed 12 oct 2012]. Available from: http://portal.saude.gov.br/portal/arquivos/pdf/informe rota virus 02 03 2006.pdf
23. Armon K, Stephenson T, MacFaul R, Eccleston P, Werneke U. An evidence and consensus based guideline for acute diarrhoea management. Arch Dis Child. 2001;85:132---42.
24. Pileggi C, Raffaele G, Angelillo IF. Paediatric utilization of an emergency department in Italy. Eur J Public Health. 2006;16: 565---9.
26. Costa AD, Silva GA. Use of oral rehydration therapy in the emergency unit: a clinical-based decision? Rev Paul Pediatr. 2010;28:215---20.
27. Ozuah PO, Avner JR, Stein RE. Oral rehydration, emergency physicians, and practice parameters: a national survey. Pedi-atrics. 2002;109:259---61.
28. La Forgia GM, Couttolenc BF. Desempenho hospitalar no Brasil: em busca da excelência. São Paulo: Singular; 2009.