supply and use of Brazilian National Health System
health care network for the period 2010-2012*
doi: 10.5123/S1679-49742017000400004
Abstract
Objective: to assess the supply and use of procedures for early detection, diagnosis and surgeries of breast cancer in the Brazilian National Health System (SUS). Methods: descriptive study using data from SUS Ambulatory Care and Hospital Information Systems, and from the National Register of Health Care Facilities; the indicators of supply and use of these services in Brazil and its macroregions for 2010-2012 were calculated. Results: the ratio mammography equipment and female population/100 thousand remained stable (1.5), ranging from 1.0 in the North region to 2.0 in the South; the ratio mammograms and female population/100 thousand increased in all macroregions; there was a low proportion of diagnostic procedures when compared to the estimates (biopsy, 11.5%; core biopsy, 16.6% in women aged 50-69 years); the installed capacity decreased, however the production increased, and the supply (3,995,627) was below the necessary to cover 70% (7,785,415). Conclusion: there are inequalities in supply and use of the procedures in the Brazilian regions, and the access to diagnosis is worrisome.
Keywords: Breast Neoplasms; Early Detection of Cancer; Health Services; Indicators of Health Services.
Correspondence:
Jeane Glaucia Tomazelli – Instituto Nacional de Câncer José Alencar Gomes da Silva, Divisão de Detecção Precoce e Apoio à Organização de Rede, Rua Marquês de Pombal, No. 125, 7º andar, Centro, Rio de Janeiro-RJ, Brasil. CEP: 22230-240
E-mail: [email protected]
Jeane Glaucia Tomazelli1
Gulnar Azevedo e Silva2
1Ministério da Saúde, Instituto Nacional de Câncer José Alencar Gomes da Silva, Rio de Janeiro-RJ, Brasil 2Universidade do Estado do Rio de Janeiro, Instituto de Medicina Social, Rio de Janeiro-RJ, Brasil
Introduction
The high incidence and mortality rates of breast cancer in women in Brazil1 strengthened the debate about control
actions of this neoplasm in the country,2 especially regarding
early detection of the disease, including screening, which is directed at asymptomatic women, and the early diagnosis of those presenting signs and symptoms.3
A screening program is effective when it increases the cases detected in early stages.4,5 However, there has
been a broad discussion on the increasing detection of ductal carcinoma in situ as a harmful effect of mammography screening,6 which would cause high
levels of over-diagnosis and overtreatment.
In Brazil, although the Ministry of Health disclosed consensus recommendations on the control of breast cancer in 2004, there is no organized screening program, since, among other relevant aspects, there is a lack of an information system that records all the target population, and a routine call and systematic follow-up of these women based on indicators.7-11
In the implementation of a screening program, we need to consider the organization of the health care network as well as, the availability of human and structural resources for diagnosis and treatment.
The supply of health services is related to access; discussing it means to deal with the barriers to the use of available health services.12 Therefore, the use of these
services is influenced by the health needs of the population, its users, by the health care professionals and health care organization, by health policy13 and its intersectoral actions.
Continuity of care includes women returning to the primary health care unit with the mammography report and if there is suspicion, with the referral to a diagnostic investigation. The access to diagnostic tests and treatment, when necessary, is related to established references and health care network organization,14,15
being also affected by the availability of human and equipment resources.
In Brazil, several studies have tried to scale the situation of early detection of breast cancer through the identification of factors related to mammography coverage, access to diagnosis and treatment. The mammography coverage in the country is low, compared to the World Health Organization (WHO) recommendations;11 even so, there
is an important difference between this coverage and the number of diagnostic confirmation tests carried out by the Brazilian National Health System (SUS),16 even with
an increase in mammograms, influenced by the larger distribution of the services supply for its achievement.17
In 2014, a survey of ambulatory records related to breast cancer diagnosis18 in the country showed that
4,110 services informed carrying out some diagnostic procedure, and of those, only 46 conducted the six diagnostic procedures for breast cancer: (i) screening mammography, (ii) diagnostic mammography (iii) breast ultrasound (iv) fine needle aspiration, (v) core biopsy and (vi) surgical biopsy.
Studies that investigate the diagnosis of health care network and assess regional differences in the supply and use of services related to the early detection of breast cancer are necessary, in order to encourage and subsidize discussions to improve patient care management.
The objective of this study was to evaluate the supply and use of procedures related to early detection, diagnosis and surgery of breast cancer in the assistance network of the Brazilian National Health System and to estimate the mammography coverage in Brazil and its macroregions, from 2010 to 2012.
Methods
A descriptive study was conducted using data from the Ambulatory Care Information System (SIA/SUS) and Hospital Information System (SIH/SUS), as well as the National Register of Health Care Facilities (CNES). Population size used as denominators to calculate the indicators, were obtained from the 2010 Demographic Census and inter-census projections (2011 and 2012), available at the website of SUS IT Department (Datasus): www.datasus.gov.br
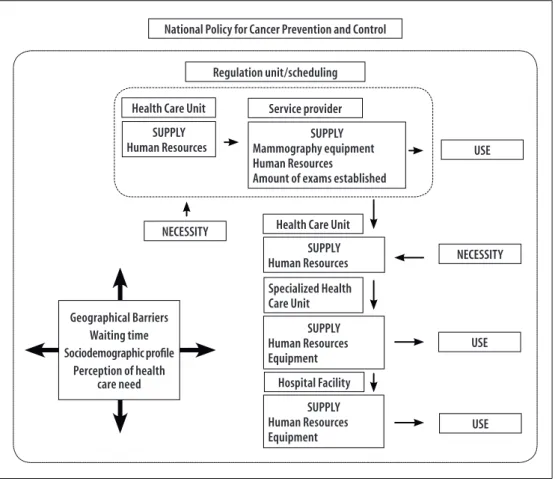
In the model proposed for this study, the mammography, primary examination of the screening program, is requested in a primary health care unit. The need for the examination can be perceived by the woman or by the health care professional when she seeks the service. Usually, the supply of the exam depends
The access to diagnostic tests and
on authorization by a regulation unit, according to limits established between municipalities and services that perform mammography, and on the amount of mammography equipment and professionals available to perform the procedure.
Every model is influenced by geographical barriers (distance/easy access), women’s social condition (job/ day off, income, education level) and length of time between exams (request, scheduling, examination and result). The conceptual model presented in Figure 1 seeks to highlight the main components involved in this process, in which all factors occur according to the National Policy for Cancer Prevention and Control.14
To identify the existing supply structure for procedures related to breast cancer care, we raised the following information: the absolute number of equipment used by SUS (simple/digital mammography equipment, conventional ultrasound) and the total number of professionals who work at SUS per procedure related to the early detection of breast cancer, based on the Brazilian Occupational Classification (CBO), according
to the Table of Procedures, Medications and Orthoses, Prostheses and Supplies of SUS (SIGTAP). We calculated the annual average of equipment and professionals, using the absolute number per month informed for the period from 2010 to 2012.
To evaluate the use of these services, we verified the informed production of procedures for breast cancer screening, diagnostic investigation and surgery on SIA/ SUS and SIH/SUS systems. The ambulatory procedures studied were: (i) screening mammography, (ii) breast ultrasound, (iii) fine needle aspiration, (iv) core biopsy and (v) surgical biopsy.
The hospital procedures selected were surgeries for breast cancer performed exclusively in units specialized in cancer treatment (segmentectomy/ quadrantectomy/ sectorectomy in oncology, simple mastectomy, and radical mastectomy with lymph node dissection in oncology) and those that can be performed in any hospital unit (sectorectomy/ quadrantectomy, sectorectomy/ quadrantectomy with axillary clearance, simple and radical mastectomy with lymph node dissection).
Figure 1 – Conceptual Model
National Policy for Cancer Prevention and Control
Regulation unit/scheduling
Health Care Unit
SUPPLY Human Resources
Service provider
SUPPLY Mammography equipment Human Resources
Amount of exams established
USE
USE NECESSITY
USE
NECESSITY Health Care Unit
SUPPLY Human Resources
Specialized Health Care Unit
SUPPLY Human Resources Equipment
Hospital Facility
SUPPLY Human Resources Equipment Geographical Barriers
Waiting time Sociodemographic profile
We calculated indicators for Brazil and its macroregions, per 100,000 women, in order to assess the availability of facilities and human resources and the use of procedures related to the early detection of breast cancer, adopting the local female population and year as denominators, namely:
- ratio between the average number of simple/digital mammography equipment in use at SUS and the population of women;
- ratio between the average number of conventional ultrasound in use at SUS and the population of women; - ratio of average number of professionals who work
at SUS and can perform/report mammography/ ultrasound, and the population of women; - ratio between the average number of professionals
who work at SUS and who can perform fine needle aspiration, and the population of women;
- ratio between the average number of professionals who work at SUS and who can perform core biopsy or surgical biopsy, and the population of women; - ratio between the average number of professionals
who work at SUS and can carry out breast cancer surgeries, and the population of women;
- ratio between the number of screening mammography and the population of women;
- ratio between the number of procedures of breast ultrasound and the population of women;
- ratio between the number of procedures of fine needle aspiration and the population of women;
- ratio between the number of procedures of core biopsy and the population of women;
- ratio between the number of biopsy procedures and the population of women;
- ratio between the number of breast surgical procedures with codes exclusive to units specialized in cancer treatment and the population of women; and - ratio between the number of breast surgical procedures
with non-exclusive codes to specialized units and the population of women.
From the number of mammography screening performed in the age groups 40-49 and 50-69 years, we estimated the need for diagnostic investigation procedures (breast ultrasound; fine needle aspiration; core biopsy; surgical biopsy), using technical parameters for screening programming: breast ultrasound, 6.5%; fine needle aspiration, 0.5%; core biopsy, 1.5%; and surgical biopsy, 0.7%.19 The Ministry of Health
recommends biennial screening mammography for
women from 50 to 69 years old;20 however, almost 40%
of screening mammograms are performed on women between 40-49 years old.21 Therefore, we applied the
same programming parameters related to diagnostic procedures used for the age group of 50-69 years old. We estimated the need for screening mammograms to cover 70% of the population, taking into account the following parameters: 1% of the female population >35 years old + 16% women aged between 40-49 years + 56% of women in the age group 50-69 years.19
The installed capacity of production of mammography equipment in use at SUS and the screening coverage of the target population were calculated. The production of mammograms based on the availability of equipment was assessed from the average number of mammography equipment, considering a production capacity of 5,096 mammograms/year per mammography equipment, as recommended by the Brazilian National Cancer Institute José Alencar Gomes da Silva (INCA).22
To estimate mammography coverage, we calculated the ratio between the number of screening mammograms on women aged 50-69 years old and half the female population at this age group, given the biannual recommendation for screening.20,23
The proportion of diagnostic procedures performed by SUS between the estimated necessary amount, from the parameters adopted19 was calculated according to
the age groups 40-49 and 50-69 years old, per Brazilian macroregion, in the years studied.
The study project was approved by the Research Ethics Committee of the Institute of Social Medicine of the State University of Rio de Janeiro – Report No. 1,105,945, dated June 13th 2015.
Results
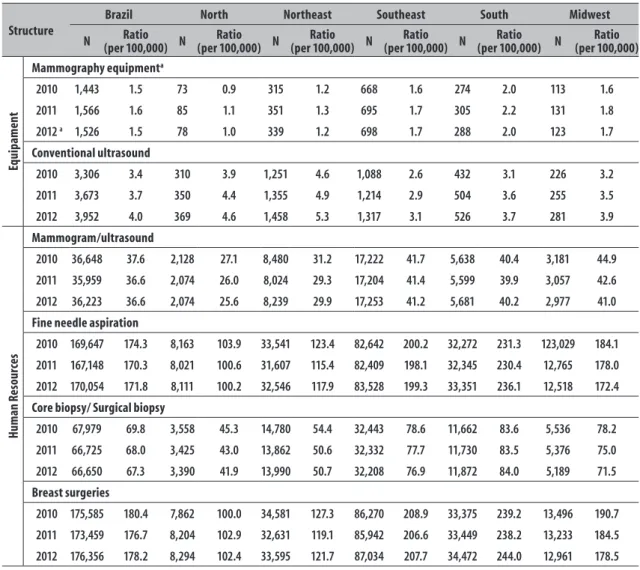
In Brazil, the average number of simple mammography equipment available at SUS has increased from 1,443 to 1,526 between 2010 and 2012. In 2012, there was 1.5 mammography equipment for every 100,000 women. The lower ratio mammography equipment/100,000 women was observed in the North (1.0) and the highest, in the South (2.0).
Table 1 – Mammography equipment and conventional ultrasound equipment, professionals able to perform the procedure and who work at the Brazilian National Health System, in absolute numbers (N) and ratio (per 100,000 women), Brazil and macroregions, 2010-2012
Structure
Brazil North Northeast Southeast South Midwest
N (per 100,000)Ratio N (per 100,000)Ratio N (per 100,000)Ratio N (per 100,000)Ratio N (per 100,000)Ratio N (per 100,000)Ratio
Eq
uip
am
en
t
Mammography equipmenta
2010 1,443 1.5 73 0.9 315 1.2 668 1.6 274 2.0 113 1.6
2011 1,566 1.6 85 1.1 351 1.3 695 1.7 305 2.2 131 1.8
2012 a 1,526 1.5 78 1.0 339 1.2 698 1.7 288 2.0 123 1.7
Conventional ultrasound
2010 3,306 3.4 310 3.9 1,251 4.6 1,088 2.6 432 3.1 226 3.2
2011 3,673 3.7 350 4.4 1,355 4.9 1,214 2.9 504 3.6 255 3.5
2012 3,952 4.0 369 4.6 1,458 5.3 1,317 3.1 526 3.7 281 3.9
H
uma
n R
esour
ce
s
Mammogram/ultrasound
2010 36,648 37.6 2,128 27.1 8,480 31.2 17,222 41.7 5,638 40.4 3,181 44.9
2011 35,959 36.6 2,074 26.0 8,024 29.3 17,204 41.4 5,599 39.9 3,057 42.6
2012 36,223 36.6 2,074 25.6 8,239 29.9 17,253 41.2 5,681 40.2 2,977 41.0
Fine needle aspiration
2010 169,647 174.3 8,163 103.9 33,541 123.4 82,642 200.2 32,272 231.3 123,029 184.1
2011 167,148 170.3 8,021 100.6 31,607 115.4 82,409 198.1 32,345 230.4 12,765 178.0
2012 170,054 171.8 8,111 100.2 32,546 117.9 83,528 199.3 33,351 236.1 12,518 172.4
Core biopsy/ Surgical biopsy
2010 67,979 69.8 3,558 45.3 14,780 54.4 32,443 78.6 11,662 83.6 5,536 78.2
2011 66,725 68.0 3,425 43.0 13,862 50.6 32,332 77.7 11,730 83.5 5,376 75.0
2012 66,650 67.3 3,390 41.9 13,990 50.7 32,208 76.9 11,872 84.0 5,189 71.5
Breast surgeries
2010 175,585 180.4 7,862 100.0 34,581 127.3 86,270 208.9 33,375 239.2 13,496 190.7
2011 173,459 176.7 8,204 102.9 32,631 119.1 85,942 206.6 33,449 238.2 13,233 184.5
2012 176,356 178.2 8,294 102.4 33,595 121.7 87,034 207.7 34,472 244.0 12,961 178.5
a) Includes simple and digital equipment, available from 2012 on. Note: Search in the Brazilian Occupational Classification on May 26th 2014.
machines in the Northeast (5.3/100,000 women) and in the North (4.6/100,000 women), and a smaller offer in the South (3.7/100,000 women) and in the Southeast (3.1/100,000 women) (Table 1), opposite to what was observed for mammography equipment.
The professionals authorized to make mammography reports are the same who can perform breast ultrasound. Except for the Midwest region, the average number of professionals has remained virtually stable in all regions throughout this period. In 2012, in Brazil, the average ratio of professionals trained to report/perform mammograms or breast ultrasound was of 36.6/100,000 women. The Southeast and Midwest regions presented
the highest ratios (41.2/100,000 and 41.0/100,000 women, respectively), and the North region presented the lowest ratio (25.6/100,000 women).
core biopsy or surgical biopsy was 67.3 per 100,000 women in 2012, ranging from 41.9/100,000 in the North to 84.0/100,000 in the South.
There was a reduction in the average ratio of professionals who can perform breast surgeries in Brazil: 180.4/100,000 women in 2010 to 178.2/100,000 women in 2012. Also in 2012, the North region presented the lowest offer of specialized professionals for breast surgeries (102.4/100,000 women), followed by the Northeast (121.7/100,000 women), whilst the highest offer was observed in the South region (244.0/100,000 women) (Table 1).
The indicators of ratio for the screening mammography procedures – breast ultrasound, fine needle aspiration, and core biopsy, per 100,000 women – held at SUS presented an increase in the country from 2010 to 2012, whilst biopsies revealed a slight reduction. There was a reduction in breast surgical procedures in not exclusively specialized units, whereas Oncology exclusive surgical procedures remained stable (Table 2).
There was a reduction in the ratio of fine needle aspiration in women in the North and Southeast regions. The ratio of breast surgical procedures conducted exclusively in specialized units per 100,000 women increased in the South, Southeast and Midwest. The ratio of biopsies for 100,000 women decreased in Brazil and in the North, Northeast and Southeast regions throughout the period (Table 2).
Despite the installed capacity of mammography equipment in the country has decreased between 2011 and 2012, mammograms increased in all regions, as well as its coverage. The Southeast region was the only one with increased installed capacity between 2011 and 2012, with only the South and Midwest regions having installed capacity to offer coverage for 70% of the population (Table 3).
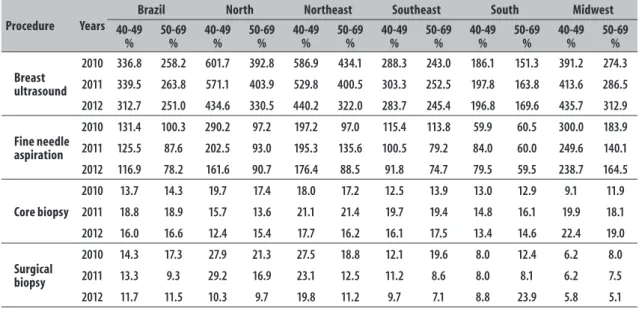
In Brazil, the proportion of breast ultrasound and fine needle aspiration procedures was well above the estimated for both age groups; except for the number of fine needle aspiration in the age group of 50-69 years old, whose value was below the estimated in 2011 and 2012 (Table 4).
When we compare the South with the other regions, it presented the lowest proportion of breast ultrasound among the estimated number of procedures required. When it comes to fine needle aspiration procedure, there was an overall reduction, especially for the age group of 40-49 years old; except for the South region,
where there was an increase between 2010 and 2011 with subsequent reduction between 2011 and 2012 (Table 4).
Despite the increase observed between 2010 and 2012, in the proportion of core biopsy held in Brazil and in Southeast and Midwest regions, the number of these procedures at SUS was below the necessary. Similarly, the proportion of surgical biopsies performed proved to be far smaller than the necessary for both age groups, throughout the period analyzed; the South region was the exception: there was an increase in 2012 (Table 4).
Discussion
The ratio of mammography equipment by the total female population remained stable between 2010 and 2012, and in 2012, the ratio of mammography equipment by women in the South region was double the total of the North region. Still, the ratio between mammograms and the women population increased in all regions of the country, showing that the number of mammography equipment is not a determinant factor in the increase of examinations, as observed in a study developed in Brazil for the period 2003-2008, using data from the National Household Sample Survey (PNAD), of the Brazilian Institute of Geography and Statistics (IBGE).17
Despite the ultrasound supply in the North and Northeast regions was higher than in other regions, we must consider that such equipment is not exclusive to perform breast ultrasound.
There is an inequality in the distribution of professionals able to perform specific procedures for breast cancer diagnosis in Brazil. The North and Northeast regions presented the smallest supply of professionals able to perform these procedures; and the professionals able to perform core biopsy and surgical biopsy (based on the based on the Brazilian Occupational Classification) presented the lowest offer, in all regions.
Table 2 – Procedures for early detection of breast cancer and surgeries, in absolute numbers (N) and ratio (per 100,000 women) in Brazil and macroregions, 2010-2012
Procedure
Brazil North Northeast Southeast South Midwest
N (per 100,000)Ratio N (per 100,000)Ratio N (per 100,000)Ratio N (per 100,000)Ratio N (per 100,000)Ratio N (per 100,000)Ratio
Mammograms
2010 3,077,658 3,161.5 68,092 866.4 568,934 2,093.8 1,590,669 3,852.6 791,741 5,230.9 120,222 1,968.5
2011 3,565,929 3,653.6 81,700 1,021.6 705,894 2,577.3 1,858,234 4,466.8 811,230 5,778.2 127,871 1,783.0
2012 3,995,627 4,036.7 94,134 1,162.6 895,791 3,246.0 2,011,637 4,800.8 847,115 5,996.9 146,950 2,023.5
Breast ultrasound
2010 845,949 869.0 38,880 494.7 292,018 1,074.7 370,803 898.1 103,962 745.2 40,286 569.2
2011 992,999 1,011.5 46,196 579.4 325,682 1,189.1 452,879 1,088.6 124,443 886.4 43,799 610.2
2012 1,018,331 1,028.8 47,162 582.5 325,699 1,180.2 461,444 1,101.2 131,955 934.1 52,071 717.0
Fine needle aspiration
2010 24,180 24.8 1,146 14.6 5,756 20.5 12,013 29.1 3,180 22.8 2,265 32.0
2011 25,971 26.5 1,029 12.9 7,545 27.5 11,310 27.2 4,024 28.7 2,063 28.8
2012 26,939 27.2 1,031 13.2 7,916 28.7 11,434 27.8 3,875 27.4 2,439 33.6
Core biopsy
2010 8,694 8.9 274 3.5 2,163 8.0 4,234 10.3 1,758 12.6 265 3.7
2011 13,322 13.6 292 3.7 3,071 11.2 7,002 16.8 2,469 17.6 488 6.8
2012 13,510 13.6 323 4.0 3,259 11.8 6,537 16.5 2,404 17.0 587 8.1
Surgical biopsy
2010 5,696 5.9 167 2.1 2,114 7.8 2,636 6.4 737 5.3 42 0.6
2011 5,063 5.2 212 2.7 1,947 7.1 2,142 5.1 696 5.0 66 0.9
2012 5,644 5.7 157 1.9 2,116 7.7 1,993 4.9 1,229 8.7 89 1.2
Breast surgeries non-exclusive to specialized units
2010 29,522 30.3 1,551 19.7 7,978 29.4 12,291 29.8 5,298 38.0 2,404 34.0
2011 27,953 28.5 1,390 17.4 7,866 28.7 11,907 28.6 4,408 31.4 2,382 33.2
2012 28,172 28.5 1,187 14.7 7,976 29.9 12,256 29.2 4,421 31.3 2,332 32.1
Breast surgeries exclusive to specialized units (oncological)
2010 10,275 10.6 370 4.7 2,597 9.6 4,937 12.0 1,821 13.1 550 7.8
2011 9,387 9.6 384 4.8 2,337 8.5 4,388 10.5 1,729 12.3 549 7.7
2012 10,410 10.5 329 4.1 2,126 7.7 5,479 13.1 1,877 13.3 599 8.2
The study indicates an imbalance among the procedures for early detection of breast cancer: the ratio between mammography, fine needle aspiration and core biopsy and the population of women have increased, whereas the ratios for biopsy decreased in several regions, except in the South and Midwest. This indicates that, in many areas, the public health care network has not fulfilled biopsy needs, an essential procedure to confirm malignant neoplasms in the breast, which may be related to the low availability of human resources to carry out this procedure.
There was a reduction of ratios of surgical procedures non-exclusive to specialized units throughout Brazil and in its North, South and Midwest regions. This finding possibly expresses a reorganization of the network, with cases of breast cancer being referred to specialized hospitals.14,15 In the North region, however, there
was also a reduction on ratios of surgical procedures exclusive of oncology, a result that is consistent with the findings of another study conducted in Brazil,24
Table 3 – Amount of mammography equipment available at the Brazilian National Health System (SUS), total production of screening mammograms, estimated production capacity of mammography, number of mammograms required to cover 70% of the population and coverage of target population, Brazil and macroregions, 2010-2012
Brazil and
major regions Year
Average number of mammography equipment available
at SUS
Total production of screening mammograms
Estimated production capacitya
Number of mammograms
requiredb
Ratio between mammograms and target populationc
Brazil
2010 1,443 3,077,658 7,314,567 7,666,360 0.20
2011 1,566 3,584,929 7,938,054 7,726,687 0.23
2012 1,526 3,995,627 7,735,294 7,785,415 0.27
North
2010 73 68,092 370,037 428,328 0.08
2011 85 81,700 430,865 434,103 0.09
2012 78 94,134 395,382 440,223 0.12
Northeast
2010 315 568,934 1,596,735 1,909,175 0.14
2011 351 705,894 1,779,219 1,923,626 0.17
2012 339 895,791 1,718,391 1,937,528 0.24
Southeast
2010 668 1,590,669 3,386,092 3,582,772 0.22
2011 695 1,858,234 3,522,955 3,609,099 0.26
2012 698 2,011,637 3,538,162 3,634,509 0.29
South
2010 274 729,741 1,388,906 1,237,129 0.29
2011 305 811,230 1,546,045 1,244,535 0.33
2012 288 847,115 1,459,872 1,251,706 0.35
Midwest
2010 113 120,122 572,797 508,956 0.12
2011 131 127,871 664,039 515,324 0.13
2012 123 146,950 623,487 521,448 0.15
a) Production capacity of mammography equipment: equipment x 3 exam/hour x 8 hours x 22 days x 12 months x 80%
b) Calculation for 70% coverage of the population that will need mammography: 0.7 x (1% of the female population 35 years + 16% > women aged 40 to 49 years + 56% of women aged 50 to 69 years) c) The ratio indicator, coverage proxy, used half the population due to the biennial periodicity of the screening mammography.
in all state capitals, except in those located in the North region, suggesting that the women in that region could be facing more difficulties to access treatment.
In 2014, some hospitals specialized in cancer treatment and surgeries did not report any breast surgery,18 which
highlights the need for a better investigation about these surgeries, since this type of cancer, its incidence and prevalence, authorize its treatment in all qualified units.14
The number of screening mammograms performed in Brazil (3,995,627 in 2012) falls short of the production capacity of mammography equipment (7,735,294 in 2012). Some private services of mammography can establish partnerships with SUS and provide exams below the capacity of the equipment. In these cases, although the equipment is considered to be in use by SUS, its installed capacity will be different. A study that assessed some screening programs in Europe25
found an average annual production of mammogram per mammography equipment that ranged from 672 to 13,705 mammograms per year, demonstrating the importance of monitoring the production of this exam.
The difference between production and need for mammograms for a 70% coverage of the target population remains significant. Data from screening programs of other countries and regions also present coverage below 70%;25,26 however, this coverage in Brazil (27
mammograms for every 100 women in 2012) is much lower than the recommended amount (50 mammograms for every 100 women). The ratio indicator adopted uses as denominator all the female population between 50-69 years old,23 without subtracting the population covered
Table 4 – Proportion of diagnostic procedures for breast cancer carried out in relation to the estimated need from the number of screening mammograms performed, by age (in years), Brazil and macroregions, 2010-2012
Procedure Years
Brazil North Northeast Southeast South Midwest
40-49 %
50-69 %
40-49 %
50-69 %
40-49 %
50-69 %
40-49 %
50-69 %
40-49 %
50-69 %
40-49 %
50-69 %
Breast ultrasound
2010 336.8 258.2 601.7 392.8 586.9 434.1 288.3 243.0 186.1 151.3 391.2 274.3
2011 339.5 263.8 571.1 403.9 529.8 400.5 303.3 252.5 197.8 163.8 413.6 286.5
2012 312.7 251.0 434.6 330.5 440.2 322.0 283.7 245.4 196.8 169.6 435.7 312.9
Fine needle aspiration
2010 131.4 100.3 290.2 97.2 197.2 97.0 115.4 113.8 59.9 60.5 300.0 183.9
2011 125.5 87.6 202.5 93.0 195.3 135.6 100.5 79.2 84.0 60.0 249.6 140.1
2012 116.9 78.2 161.6 90.7 176.4 88.5 91.8 74.7 79.5 59.5 238.7 164.5
Core biopsy
2010 13.7 14.3 19.7 17.4 18.0 17.2 12.5 13.9 13.0 12.9 9.1 11.9
2011 18.8 18.9 15.7 13.6 21.1 21.4 19.7 19.4 14.8 16.1 19.9 18.1
2012 16.0 16.6 12.4 15.4 17.7 16.2 16.1 17.5 13.4 14.6 22.4 19.0
Surgical biopsy
2010 14.3 17.3 27.9 21.3 27.5 18.8 12.1 19.6 8.0 12.4 6.2 8.0
2011 13.3 9.3 29.2 16.9 23.1 12.5 11.2 8.6 8.0 8.1 6.2 7.5
2012 11.7 11.5 10.3 9.7 19.8 11.2 9.7 7.1 8.8 23.9 5.8 5.1
in Brazil in 2010, also showed low coverage of this indicator when including only the female population dependent of SUS.16
The mammography coverage estimated from the ratio of exams and population in the age group targeted cannot separate the cases of exams repetition, being, therefore, overrated. Among screening mammograms with information of other previous mammograms, repetition in the range of a year was 46.6% in 2010 and 44.7% in 2011.21,28
In turn, screening mammography production refers to all age groups, and almost 40% of mammograms are performed in women aged 40-49 years old,21,28 which
explains – partially – the low indicator of coverage of the target population. The high supply of screening mammography outside the recommended age group increases the demand for diagnostic confirmation tests, producing a greater imbalance between supply and use, in addition to exposing women of lower risk to overdiagnosis and overtreatment effects.20,21,25
The comparison between the informed and necessary estimated production shows an imbalance between supply and needs, highlighting problems of access to tissue diagnostic confirmation tests – which is low and showed a decrease in all regions, except in the South. This result is similar to another study16 which identified
that access to histopathological investigation of altered
cases in Brazil is low. The proportion of fine needle aspiration in the country shows to be close to what would be estimated for the age group 50-69 years old, although with sharp differences between the national macroregions. The situation of production higher than the estimated as necessary is especially sharp for ultrasound, both in Brazil as in its macroregions, regardless of the age group.
The use of the programming parameters in the age group 40-49 years old may have generated inadequate estimates. However, the proportion of diagnostic procedures performed in women aged 50-69 is much lower than the estimated and, considering that there is a demand for histopathological research among women aged 40-49 who undergo screening mammography, we can highlight the critical situation of the diagnostic investigation in the country. It is equally important to consider that the production of diagnostic procedures assessed in this study is also shared by women who are already in treatment and for those coming from diagnostic mammography, making this diagnostic production even lower than the necessary.
information. The use of information is crucial to have a closer look into the reality of public health care in the country, because it subsidizes planning and management. SIA/SUS and SIH/SUS are among the top three information systems more often used in decision making by the health managers who are responsible for the control actions of breast cancer.29
An important aspect in the analysis of data from such systems is their consistency to regulations and public policies to encourage – or restrict – health care practices, as can be seen in the increase of the supply of screening mammography, induced by the funding established in 2009, which included the screening mammography procedures through extra funding sources.30
The study showed significant differences in the country, whether in the distribution of the supply and use of procedures for early detection of breast cancer, or in the coverage and in the imbalance between what is produced and the estimated social need. The results display the difference between the encouragement to
undergo mammography exams and the corresponding structure for diagnostic investigation, showing huge bottlenecks in diagnostic capacity at SUS network.
This study shows the need for direct efforts to overcome the gaps present in breast cancer care, and the importance of local similar analyses to improve diagnosis, aiming at better structuring of health care network.
Authors' contributions
Tomazelli JG contributed to the conception and design of the study, extraction, analysis and interpretation of data, writing and relevant review of the intellectual content of the manuscript. Azevedo e Silva G contributed to analysis and interpretations of data, writing and relevant review of the intellectual content of the manuscript. Both authors have approved the final version of the manuscript and declare to be responsible for all aspects of the study, ensuring its accuracy and integrity.
1. Ministério da Saúde (BR). Instituto Nacional de Câncer José Alencar Gomes da Silva. Coordenação Geral de Ações Estratégica. Coordenação Prevenção e Vigilância. Estimativa 2016: incidência de câncer no Brasil [Internet]. Rio de Janeiro (RJ): INCA; 2015 [citado 2017 Maio 19]. 122 p. Disponível em: http:// www.inca.gov.br/estimativa/2016/
2. Ministério da Saúde (BR). Secretaria de Vigilância em Saúde. Departamento de Análise de Situação de Saúde. Plano de ações estratégicas para o enfrentamento das doenças crônicas não transmissíveis (DCNT) no Brasil 2011-2022 [Internet]. Brasília (DF): Ministério da Saúde; 2011 [citado 2017 Maio 19]. 160 p. Disponível em: http:// bvsms.saude.gov.br/bvs/publicacoes/plano_acoes_ enfrent_dcnt_2011.pdf
3. Silva RCF, Hortale VA. Rastreamento do câncer de mama no Brasil: quem, como e por quê? Rev Bras Cancerol. 2012;58(1):67-71.
4. Bleyer A, Welch HG. Effect of three decades of screening mammography on breast-cancer incidence. N Engl J Med. 2012 Nov 22;367(21):1998-2005.
5. Kalager M, Adami HO, Bretthauer M, Tamimi RM. Overdiagnosis of invasive breast cancer due to mammography screening: results from the Norwegian screening program. Ann Intern Med. 2012 Apr 3;156(7):491-9.
6. Lynge E, Ponti A, James T, Májek O, von Euler-Chelpin M, Anttila A, et al. Variation in detection of ductal carcinoma in situ (DCIS) during screening mammography: a survey within the International Cancer Screening Network (ICSN). Eur J Cancer. 2014 Jan;50(1):185-92.
7. Perry N, Broeders M, de Wolf C, Törnberg S, Holland R, von Karsa L. European guidelines for quality assurance in breast cancer screening and diagnosis. Fourth edition--summary document. Ann Oncol. 2008 Apr;19(4):614-22.
8. Australian Institute of Health and Welfare.
BreastScreen Australia monitoring report 2009-2010 [Internet]. Canberra (AU): Australian Institute of Health and Welfare; 2012 [cited 2017 May 19]. 93 p. Available from: http://www.aihw.gov.au/WorkArea/ DownloadAsset.aspx?id=60129552863
9. Health and Social Care Information Centre, Screening and Immunisations. Breast screening programme, England 2011-12 [Internet]. 2013 - [citado 2017 May 19]. Available from: http://content.digital.nhs.uk/catalogue/ PUB10339/bres-scre-prog-eng-2011-12-rep.pdf
10. Canadian Partnership Against Cancer. Report from the evaluation indicators working group. Guidelines for monitoring breast cancer screening program performance [Internet]. 3rd ed. Toronto (CA):
Canadian Partnership Against Cancer; 2013 [cited 2017 May 19]. 46 p. Available from: http://www. getcheckedmanitoba.ca/files/b-rep-gdlnmonitor.pdf
11. World Health Organization. Early Detection. Cancer control: knowledge into action. WHO guide for effective programmes. Module 3: early detection [Internet]. Geneva (SZ): World Health Organization; 2007 [cited 2017 May 19]. Available from: https:// www.ncbi.nlm.nih.gov/pubmed/24716262
12. Viacava F, Ugá MAD, Porto S, Laguardia J, Moreira RS. Avaliação de desempenho de sistemas de saúde: um modelo de análise. Ciênc Saúde Coletiva. 2012;17(4):921-34.
13. Travassos C, Martins M. Uma revisão sobre os conceitos de acesso e utilização de serviços de saúde. Cad Saúde Pública. 2004;20(Sup 2):S190-8.
14. Brasil. Ministério da Saúde. Portaria GM n. 874 de maio de 2013. Institui a política nacional para a prevenção e controle do câncer na rede de atenção à saúde das pessoas com doenças crônicas no âmbito do Sistema Único de Saúde (SUS). Diário Oficial da República Federativa do Brasil, Brasília (DF), 2013 Maio 15; Seção I, p. 129.
15. Brasil. Ministério da Saúde. Portaria GM n. 4.279 de 30 dezembro de 2010. Estabelece diretrizes para organização da rede de atenção à saúde no âmbito do Sistema Único de Saúde (SUS). Diário Oficial da República Federativa do Brasil, Brasília (DF), 2010 Dez 31; Seção I, p. 88.
16. Silva GA, Bustamante-Teixeira MT, Aquino EML, Tomazelli JG, Silva IS. Acesso à detecção precoce do câncer de mama no Sistema Único de Saúde: uma análise a partir dos dados do Sistema de Informações de Saúde. Cad Saúde Pública. 2014 Jul; 30(7):1537-50.
17. Oliveira EXGO, Pinheiro RS, Melo ECP, Carvalho MS. Condicionantes socioeconômicos e geográficos do acesso à mamografia no Brasil, 2003-2008. Ciênc Saúde Coletiva. 2011 Set; 16(9):3649-64.
18. Ministério da Saúde (BR). Instituto Nacional de Câncer José Alencar Gomes da Silva. Informativo detecção precoce. Monitoramento das ações de controle do câncer de mama. Linha de Cuidado e rede de atenção ao câncer de mama [Internet]. 2015 Set-Dez [citado 2017 Maio 19];6(3). Available from: http://www1.inca.gov.br/inca/Arquivos/informativo_ numero3_2015.pdf
19. Ministério da Saúde (BR). Instituto Nacional de Câncer José Alencar Gomes da Silva. Parâmetros técnicos para o rastreamento do câncer de mama: recomendações para gestores estaduais e municipais [Internet]. Rio de Janeiro (RJ): INCA; 2009 [citado 2017 Maio 19]. 28 p. Disponível em: http://
bvsms.saude.gov.br/bvs/publicacoes/parametros_ rastreamento_cancer_mama.pdf
20. Ministério da Saúde (BR). Instituto Nacional de Câncer José Alencar Gomes da Silva. Diretrizes para a detecção precoce do câncer de mama no Brasil [Internet]. Rio de Janeiro (RJ): INCA; 2015 [citado 2017 Maio 19]. 168 p. Disponível em: www1.inca.gov.br/inca/Arquivos/ livro_detecção_precoce_final.pdf
21. Ministério da Saúde (BR). Instituto Nacional de Câncer José Alencar Gomes da Silva. Coordenação Geral de Prevenção e Vigilância. Divisão de Apoio à Rede de Atenção Oncológica. Avaliação de indicadores das ações de detecção precoce dos cânceres do colo do útero e de mama - Brasil e Regiões, 2013 [Internet]. Rio de Janeiro (RJ): INCA; 2015 [citado 2017 Maio 19]. p. 29. Disponível em: http://www2.inca.gov.br/wps/wcm/ connect/cbe1398046d98a238c0ced5120665fa8/Avalia% C3%A7%C3%A3o+indicadores+colo+e+mama+2013. pdf?MOD=AJPERES&CACHEID=cbe1398046d98a238c0 ced5120665fa8
22. Ministério da Saúde (BR). Instituto Nacional de Câncer. Divisão de Detecção Precoce e Apoio à Organização de Rede. Coordenação de Prevenção e Vigilância. Nota técnica de 01 de novembro de 2015. Revisão do parâmetro para cálculo da capacidade de produção do mamógrafo simples [Internet]. Rio de Janeiro (RJ): INCA; 2015 [citado 2017 Maio 19]. Disponível em: http://www2.inca.gov.br/wps/wcm/ connect/fb4249004a99e827be5dfe504e7bf539/Nota+ Revis%C3%A3o+Capacidade+dos+Mam%C3%B3graf os+2015.pdf?MOD=AJPERES&CACHEID=fb4249004a 99e827be5dfe504e7bf539
23. Ministério da Saúde (BR). Instituto Nacional de Câncer José Alencar Gomes da Silva. Coordenação Geral de Prevenção e Vigilância. Divisão de Apoio à Rede de Atenção Oncológica. Ficha técnica de indicadores relativos às ações de controle do câncer de mama. [Internet]. Rio de Janeiro (RJ): INCA; 2015 [citado 2017 Maio 19]. Disponível em: http://www2.inca.gov.br/wps/wcm/connect/ df17e400469f69aa8542ed5120665fa8/fICHA+T%C3% 89CNICA+Indicadores+Mama+2014.pdf?MOD=AJPER ES&CACHEID=df17e400469f69aa8542ed5120665fa8
24. Silva GA, Gamarra CJ, Girianelli VR, Valente JG. Tendência da mortalidade por câncer nas capitais e interior do Brasil entre 1980 e 2006. Rev Saúde Pública. 2011 Dez; 45(6):1009-18.
Received on 11/11/2016
Approved on 28/04/2017
26. Wilde S, Wirth T, Zöllner Y. Mammography screening in the OECD and its impact on health and health system related indicators. J Health Policy. 2014;1:76-83.
27. Instituto Brasileiro de Geografia e Estatística. Coordenação de Trabalho e Rendimento. Pesquisa nacional de saúde 2013: ciclos da vida - Brasil e grandes regiões [Internet]. Rio de Janeiro (RJ): IBGE; 2015 [citado 2017 Maio 19]. 92 p. Disponível em: http://biblioteca.ibge.gov.br/visualizacao/livros/ liv94522.pdf
28. Ministério da Saúde (BR). Instituto Nacional de Câncer José Alencar Gomes da Silva. Informativo detecção precoce. Monitoramento das ações de controle dos cânceres do colo do útero e de mama [Internet]. 2012 Ago-Dez [citado 2017 Maio 19];3(3). Disponível em: http://bvsms.saude.gov. br/bvs/publicacoes/inca/Informativo_Deteccao_ Precoce_agosto_dezembro_2012.pdf
29. Martins CHF. Ambiente de Informação para apoio à decisão dos gestores do controle do câncer de mama [dissertação]. Rio de Janeiro (RJ): Escola Nacional de Saúde Pública Sérgio Arouca/Fiocruz; 2009.