Verbal fluency in elderly with and
without hypertension and diabetes from
the FIBRA study in Ermelino Matarazzo
Nathalia Lais Morelli1, Meire Cachioni1,2, Andrea Lopes1, Samila Sathler Tavares Batistoni1,2, Deusivania Vieira da Silva Falcão1, Anita Liberalesso Neri1,2, Monica Sanches Yassuda1,2
ABSTRACT. Background: There are few studies on the qualitative variables derived from the animal category verbal fluency test (VF), especially with data originating from low-income samples of community-based studies. Objective: To compare elderly with and without hypertension (HTN) and diabetes mellitus (DM) regarding the total number of animals spoken, number of categories, groups and category switches on the VF test. Methods: We used the database of the FIBRA (Frailty in Brazilian Elderly) community-based study. The variables number of Categories, Groups and Category Switches were created for each participant. The total sample (n = 384) was divided into groups of elderly who reported having HTN, DM, both HTN and DM, or neither of these conditions. Results: There were no significant differences between the groups with and without these chronic diseases for VF total score or for the qualitative variables. Conclusion: Among independent community-dwelling elderly, the qualitative variables derived from the VF animal category may not add information regarding the cognitive profile of elderly with chronic diseases. Total VF score and the qualitative variables Category, Group and Switching did not differentiate elderly with and without HTN and DM.
Key words: older adults, cognition, verbal fluency, executive function, hypertension, diabetes.
FLUÊNCIA VERBAL EM IDOSOS COM E SEM HIPERTENSÃO E DIABETES NO ESTUDO FIBRA EM ERMELINO MATARAZZO RESUMO. Introdução: Existem poucos estudos sobre as variáveis qualitativas decorrentes do teste de fluência verbal (FV) categoria animais, em especial com dados provenientes de amostra populacional de países com baixa renda. Objetivo:
Comparar idosos com e sem hipertensão (HAS) e diabetes mellitus (DM) quanto ao número total de animais falados, número de categorias, grupos e trocas de categoria no teste de FV. Métodos: Utilizou-se o banco de dados do estudo FIBRA (Fragilidade em Idosos Brasileiros) de base populacional em Ermelino Matarazzo. Foram criadas as variáveis Categoria, Grupo e Troca de Categoria para cada participante. A amostra total (n = 384) foi dividida entre aqueles idosos que relataram ter HAS, DM, ambas ou nenhuma destas condições. Resultados: Não houve diferença significativa entre os grupos com e sem estas doenças crônicas para o escore total da FV nem para as variáveis qualitativas. Conclusão:
Entre idosos independentes residentes na comunidade, as variáveis qualitativas derivadas da FV animais podem não adicionar informações sobre o perfil cognitivo de idosos com condições crônicas. O escore total da FV e as variáveis qualitativas Categoria, Grupo e Troca de Categoria não diferenciaram idosos com e sem HAS e DM.
Palavras-chave: idoso, cognição, fluência verbal, função executiva, hipertensão, diabetes.
INTRODUCTION
T
he aging of the world population andgrowing prevalence of cognitive impair-ments in the elderly has led to great inter-est in instruments that can detect cognitive changes beyond those expected in healthy aging. Early identiication of elderly with mild
cognitive impairment or dementia is impor-tant for planning and implementing care and treatment. For this purpose, the most widely-used instruments are the Mini-Mental State Exam, the Verbal Fluency (VF) test and the
Clock Drawing Test.1 he VF animals category
test entails participants producing names of
This study was conducted at the Gerontologia, Escola de Artes, Ciências e Humanidades, Universidade de São Paulo, São Paulo, São Paulo, Brazil.
1Gerontologia, Escola de Artes, Ciências e Humanidades, Universidade de São Paulo, São Paulo, São Paulo, Brazil. 2Gerontologia, Faculdade de Ciências Médicas,
UNICAMP, Campinas, São Paulo, Brazil.
Mônica Sanches Yassuda. Gerontologia. USP Leste – Av. Arlindo Bettio, 1000 – 03828-000 São Paulo SP – Brazil. E-mail: [email protected]
Disclosure: The authors report no conflicts of interest.
Received October 17, 2017. Accepted in final form November 06, 2017.
animals for 60 seconds. Besides total score (number of animals produced), qualitative scores extracted from the test can be analyzed, such as number of animal catego-ries cited, number of groups formed in the same cat-egory (sequence of three or more animals belonging to
the same category) and number of category switches.2
he VF semantic test requires a search drawing on previ-ous conceptual knowledge held, based on a given target category, e.g. animals or fruit. On the VF animals test, the individual may produce words such as “horse, pig, cow and sheep” in succession, owing to the close
asso-ciations with the concept of farm animals.3 During the
task, the individual is expected to mention diferent cat-egories of animals, where such category switching can produce better performance on the test.
To exemplify, in a previous study,4 young adults
produced more words and performed more category switches during the VF semantic tasks (supermarket items). However, results were similar across diferent age groups for size of the group of items within the same category. No gender diferences were found for total words produced on any of the VF tasks, but men produced larger groups on both tasks while women performed more switches than men on the VF seman-tic task. he study showed that fewer group switches resulted in lower total words produced among adults that were older.
Category switching appears to rely on the integrity of the frontal lobes. hese regions are important for initiating search processes in semantic networks and
for lexibility in the use of cognitive strategies.3,5 he
VF semantic task6 appears to depend on involvement
of the left and right pre-frontal cortex, as well as the left temporal lobe.
Besides the efect of age, the VF test is also
inlu-enced by education. A previous study7 showed that
elderly with high educational level performed better on total VF and also on the irst 15-second interval, number of categories cited, and on number of category switches. hus, scores derived from the test should be analyzed according to the sociodemographic character-istics of the individual.
he VF animals test is widely use in the diagnosis of diseases that afect cognition, e.g. dementias and their pre-clinical stages. In general, most studies use total score on the VF animals tests but few studies have investigated the contribution of the variables number of categories mentioned, number and size of groups, and category switching for identifying cognitive changes.
Some studies8-10 have suggested that hypertension
(HTN) is a risk factor for cognitive decline. Cognitive
dysfunction can result from long-term exposure to vas-cular risk factors, such as HTN. Uncontrolled HTN can afect attention, episodic memory, processing speed, and
executive functions.9-10 A study investigating primary
attention10 found worse performance on the VF animals
test among hypertensive older adults, even when in use of drug treatment.
Additionally, other studies have highlighted that dia-betes mellitus (DM) may also represent a risk factor for
cognitive decline.11 A recent study based on data from
the National Alzheimer’s Coordinating Center’s Uniform
Data Set (NACC-UDS) 12 identiied elders with normal
cognition (N = 7,663) and mild cognitive impairment (N = 4,114) and compared subjects with and without DM for cognitive composite score and domain speciic sub-scores. he results from the database revealed a higher rate of diabetes among those with cognitive impairment and that diabetics had lower cognitive performance. However, diabetics did not have signiicantly more rapid cognitive decline on the longitudinal follow-up.
Few studies exist on clustering and switching vari-ables of the VF animals test, especially with data derived from community samples of low-income countries. No previous studies comparing elderly with and without HTN and DM for qualitative variables from the VF ani-mals test were found. herefore, the objective of the present study was to compare elderly with and without the chronic diseases HTN and DM for total animals pro-duced on the VF test, number of animal categories cited, number of groups formed by a sequence of two or more names belonging to the same category, and number of category switches, during the VF animals category test. he original hypothesis of the study was that the quali-tative variables derived from the VF would diferentiate the diagnostic groups and that these groups would have similar total scores on the VF test.
METHODS
Participants. his study was carried out using the data-base of the FIBRA (Frailty in Brazilian Elderly) commu-nity-based study, whose objective was to determine the prevalence of frailty in elderly and associated variables. A total of 384 older adults took part in the present cross-sectional study.
Inclusion criteria were: being aged 65 years or older; and being a permanent resident of Ermelino
Mata-razzo.13 Exclusion criteria of the FIBRA study were:
stroke-induced aphasia; severe impairment of motricity, speech or afective disorders associated with advanced Parkinson’s disease; severe auditory or visual impair-ments; and being in a terminal state.
he present study included all participants of the FIBRA study in Ermelino Matarazzo, i.e. participants scoring below the cut-of score on the Min-Mental State Exam were not excluded. his decision was owing to the need to explore the impact of the chronic diseases (HTN and DM) in a sample with greater variability in cognitive
performance.14
Instruments. he instruments used for characterizing the sample proile were a sociodemographic question-naire, the Mini-Mental State Exam (MMSE), and the
Brief Cognitive Screening Battery (BCSB).15
he BCSB was developed to assess the cognition of individuals with low education and includes memorizing 10 black and white drawings, the Verbal Fluency (VF) test – animals category, and the Clock Drawing Test (CDT). In the memorizing task, individuals are asked to name the drawings and then recall the them incidentally (Incidental Memory). Subsequently, subjects examine the drawings for 30 seconds and attempt to recall them (Immediate Memory). Participants have another oppor-tunity to study the drawings for 30 seconds and recall them (Learning). After performing both the VF and CDT tests, delayed recall (Delayed Memory) and recognition of target igures among 10 distractors is performed.
he CDT is an instrument for detecting cognitive changes. he test assesses visuoconstructional and visuospatial functions. In the present study, the CDT
was scored based on Shulman’s criteria.16
he presence or absence of HTN and DM was based on self-reports. he following questions from the FIBRA protocol were used: “Do you have hypertension?” “Are you diabetic?”. Positive responses for each of the dis-eases were considered and participants that answered yes to both questions were deined as individuals with HTN and DM. Blood pressure was measured three times with participants in a sitting position and twice in a standing position. An automatic pressure monitor was used (Omron Hem 705 CP). Average values for systolic blood pressure (SBP) and diastolic blood pressure (DBP) were then calculated.
Procedures. On the VF test, interviewees must cite examples, in this case, animals in one minute, divided into 15-second intervals. he test assesses vocabulary and lexical access, restricting the semantic search to a given category.
For the present study, the participants’ responses on the VF animals test were reanalyzed to calculate number of categories, number of groups and number of group switches. Category was deined as a class of animals sharing a core characteristic distinguishing it from other classes of animals (e.g. domestic versus wild, aquatic ver-sus land, lying verver-sus crawling). he following catego-ries were employed: domestic and farm animals, wild animals, insects, ish, birds and reptiles. Groups were deined as a sequence of two or more names of animals of the same category. Switching was deined as a change from the concept underlying a sequence of names the speaker was producing to another concept represented by a new sequence of names belonging to another cat-egory, or by single names not belonging to the category being produced (e.g. [duck, hen, horse], [dragonly, mosquito], bear, butterly, [tiger, lion, zebra], alligator,
[shark, salmon, tuna].2,7
For the present study, 383 records from the FIBRA studies were reviewed. he variables Category, Group and Switches were created for each participant by two specially trained researchers. At the start of the pro-cess, for training purposes, both researchers assessed the same new variables for around 30 records and dis-parities were resolved through discussions. he remain-ing records were assessed independently by one of the researchers. After completing the calculation of the new scores, the results registered in the records were typed into the database of the FIBRA study. In the present study, the number of animals produced every 15 sec-onds of the test were used.
Statistical analyses. he presence of a normal distri-bution was assessed using the Kolmogorov-Smirnov test. ANOVA was used for the descriptive analyses comparing the sociodemographic characteristics of the groups with HTN, DM, HTN+DM and without either of these chronic diseases, given that age, income and education had a normal distribution. he Kruskal-Wallis test was employed to compare cognitive scores among the groups because the cognitive variables had a non-normal distribution. Correlation analyses were performed using Spearman’s test.
RESULTS
partici-pants had four years of education (60.5%) and most had a family income of 1-3 minimum wages per person (53.2%). Regarding cognition, 16.6% scored below the education-adjusted cutof on the MMSE.
he sociodemographic characteristics of the sample for participants without HTN or DM (normal group), with HTN, with DM and with both diseases are given in Table 1. he groups studied were equivalent for age, education and income.
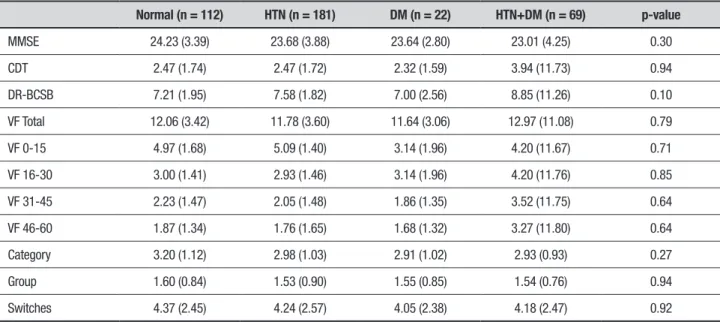
Comparison of cognitive performance revealed no signiicant diferences among the groups (Table 2). Simi-larly, no group diferences were observed for the vari-ables Category, Group and Group Switches.
No signiicant correlation was evident among the VF variables Category, Group and Group Switches or for SBP and DBP readings (Table 3).
DISCUSSION
he objective of this study was to assess the contribution of measurements derived from the VF animals (number of categories, groups and switches) in diferentiating elderly with HTN, DM, HTN and DM from elderly without these conditions. he results showed that the qualitative variables did not add information about the groups. None of the VF variables diferentiated between the groups with and without the clinical condi-tions. he qualitative variables were expected to reveal cognitive problems not detected by the overall VF score. he results of the present study were similar to those
of an earlier investigation17 which found no signiicant
diferences for cognitive variables between hypertensive and normotensive elderly users of a Basic Health Unit in the interior of São Paulo state. However, in the cited
Table 1. Sociodemographic characteristics of sample grouped by participants with HTN, DM, HTN and DM, and individuals without either disease (Normal).
Normal (n = 112) HTN (n = 181) DM (n = 22) HTN+DM (n = 69) p-value
Age 72.29 (5.72) 72.38 (5.59) 71.90 (4.73) 72.33 (6.65) 0.94
Education 3.83 (3.44) 3.87 (2.56) 3.00 (2.45) 2.94 (2.42) 0.39
Income (reais) 1301.50 (1368.03)
1119.15 (1093.88)
1656.45 (2135.57)
1259.59 (1405.34)
0.74
HTN: hypertension; DM: diabetes mellitus; M: mean; SD: standard deviation; p-value refers to Kruskal-Wallis test.
Table 2. Cognitive characteristics of sample grouped by participants with HTN, DM, HTN and DM, and individuals without either disease (Normal), ex-pressed as mean (standard deviation).
Normal (n = 112) HTN (n = 181) DM (n = 22) HTN+DM (n = 69) p-value
MMSE 24.23 (3.39) 23.68 (3.88) 23.64 (2.80) 23.01 (4.25) 0.30
CDT 2.47 (1.74) 2.47 (1.72) 2.32 (1.59) 3.94 (11.73) 0.94
DR-BCSB 7.21 (1.95) 7.58 (1.82) 7.00 (2.56) 8.85 (11.26) 0.10
VF Total 12.06 (3.42) 11.78 (3.60) 11.64 (3.06) 12.97 (11.08) 0.79
VF 0-15 4.97 (1.68) 5.09 (1.40) 3.14 (1.96) 4.20 (11.67) 0.71
VF 16-30 3.00 (1.41) 2.93 (1.46) 3.14 (1.96) 4.20 (11.76) 0.85
VF 31-45 2.23 (1.47) 2.05 (1.48) 1.86 (1.35) 3.52 (11.75) 0.64
VF 46-60 1.87 (1.34) 1.76 (1.65) 1.68 (1.32) 3.27 (11.80) 0.64
Category 3.20 (1.12) 2.98 (1.03) 2.91 (1.02) 2.93 (0.93) 0.27
Group 1.60 (0.84) 1.53 (0.90) 1.55 (0.85) 1.54 (0.76) 0.94
Switches 4.37 (2.45) 4.24 (2.57) 4.05 (2.38) 4.18 (2.47) 0.92
study, the diference for VF animals approached statisti-cal signiicance, where this diference between groups would likely reach signiicance in a larger sample. he authors suggested that the absence of an efect of HTN on cognition might be explained by the fact that par-ticipants were undergoing treatment. Another study also revealed that the performance of elderly with HTN not in use of pharmacological treatment was lower than
patients undergoing treatment.18 In the present study, it
is plausible to deduce that the absence of diferences in cognitive performance of the groups was associated with adherence to pharmacological treatment. In the sample, 96.4% of HTN participants reported undergoing treat-ment, compared with 85.7% of DM patients.
Studies19 have shown that elevated glycemia is
asso-ciated with poorer cognitive function among elderly with DM and coronary heart disease. Disease duration and level of glycemic control also appeared to be deter-minants for the emergence of cognitive impairments. In the cited study, the presence of DM was associated with lower performance on executive functions, including VF. In the present study, this inding was not conirmed for VF or MMSE performance, corroborating the results of
a previous study.20
Limitations of the present study include the fact that data on the clinical conditions were based on self-reports. herefore, it was not possible to clinically
con-irm that the elderly had the diseases reported. In addi-tion, subjects’ low educational level may have afected understanding of the questions about health. Addition-ally, the vast majority of participants were undergoing pharmacological treatment for the clinical conditions investigated, precluding comparison of treated and untreated individuals to assess the inluence of treat-ment on the results.
In conclusion, the present study comparing groups with clinical conditions (HTN, DM, HTN and DM, without HTN or DM) found that none of the cognitive variables diferentiated these groups. hese data sug-gest that qualitative variables do not add further infor-mation to total VF score. his study was performed in community-dwelling elderly and the value of these qualitative variables may be more evident in elderly with more severe cognitive impairment. he results obtained should be interpreted in the context of a population-based sample of low-educated elderly. Previous studies have tended to investigate elderly with 12 years or more of education.
Author contribution. NM and MSY analysed the data and wrote the article. All the authors contributed in the FIBRA study design and data collection, and revised the article.
REFERENCES
1. Chaves ML, Godinho CC, Porto CS, Mansur L, Carthery-Goulart MT, Yassuda MS, et al. Doença de Alzheimer. Avaliação cognitiva, compor-tamental e funcional. Dement Neuropsychol. 2011; 5 supl.1:21-33. 2. Brucki SMD, Rocha MSG. Category fluency test: effects of age, gender
and education on total scores, clustering and switching in Brazilian Portuguese-speaking subjects. Braz J Med Biol Res. 2004;37:1771-7. 3. Weakley A, Edgecombe SM, Anderson J. Analysis of Verbal Fluency
Ability in Amnestic and Non-Amnestic Mild Cognitive Impairment. Arch Clin Neuropsychol. 2013;721-31.
4. Lanting S, Haugrud N, Crossley M. The Effect of Age and Sex on Clus-tering and Switching During Speeded Verbal Fluency Tasks. J Int Neuro-psychol Soc. 2009; 15:196-204.
5. Santana OPA, Santos PK. Teste de Fluência Verbal: Uma Revisão Histórico-Crítica do Conceito de Fluência. Distúrbios Comum. 2015; 27(4):807-18.
6. Cook AP, McMillan TC, Avants BB, Peelle EJ, Gee CJ, Grossman M. Relating Brain Anatomy and Cognitive Ability Using a Multivariate Multi-modal Framework. Neuroimage. 2014;99:477-86.
7. Silva TBL, Yassuda MS, Guimarães VV, Florindo AA. Fluência Verbal e Variáveis Sociodemográficas no Processo de Envelhecimento: Um Estudo Epidemiológico. Psicol Reflex Crit. 2011;24(4):739-46. 8. Spinelli C, Caro FM, Schirosi G, Mezzapesa D, Benedittis L,
Chiappa-rino C, et al. Impaired Cognitive Executive Dysfunction in Adult Treated Hypertensives With a Confirmed Diagnosis of Poorly Controlled Blood Pressure. Int J Med Sci. 2014; 11(8):771-8.
9. Gifford KA, Badaracco M, Liu DD, Tripodis Y, Gentile A, Lu ZQ, Jefferson AL. Blood Pressure and Cognition Among Older Adults: A Meta-Analysis. Arch Clin Neuropsychol. 2013:28:649-64.
10. Nucci FCRF, Coimbra VMA, Neri LA, Yassuda SM. Ausência de Relação entre Hipertensão Arterial Sistêmica e Desempenho Cognitivo em Idosos de Uma Comunidade. Psiq Clin. 2010;37(2):52-6.
11. Feinkohl I, Keller M, Robertson RJ, Morling RJ, Williamson MR, Nee DL, et al. Clinical and Subclinical Macrovascular Disease as Predictors of Cognitive Decline in Older Patients With Type 2 Diabetes. Diabetes Care. 2013;36(9):2779-86.
12. Sano M; Zhu WC, Grossman HMD; Schimming C. Longitudinal Cognitive
Table 3. Results of correlation analyses between SBP and DBP with cognitive variables investigated.
VF Total Category Group Group switching
Systolic pressure 0.038 0.009 0.076 0.029
Diastolic pressure –0.045 0.036 –0.035 0.011
Profiles in Diabetes: Results from the National Alzheimer’s Coordinating Center’s Uniform Data. J Am Geriatr Soc. 2017;65(10):2198-204. 13. Neri LA, Yassuda SM, Araújo FL, Eulálio CM, Cabral EB, Siqueira CEM,
et al. Metodologia e Perfil Sociodemográfico, Cognitivo e de Fragilidade de Idosos Comunitários de Sete Cidades Brasileiras: Estudo FIBRA. Cad Saúde Pública, Rio de Janeiro. 2013;29(4):778-92.
14. Brucki DMS, Nitrini R, Caramelli P, Bertolucci FHP, Okamoto HI. Sugestões Para o Uso do Mini Exame do Estado Mental no Brasil. Arq Neuropsiquiatr. 2003;61(3-B):777-8.
15. Nitrini R, Caramelli P, Porto CS, Charchat-Fichman H , Formigoni AP , Carthery-Goulart MT, et al. Brief cognitive battery in the diagnosis of mild Alzheimer’s disease in subjects with medium and high levels of educa-tion. Dement Neuropsychol. 2007;1:32-6.
16. Aprahamian I1, Martinelli JE, Neri AL, Yassuda MS. The accuracy of the Clock Drawing Test compared to that of standard screening tests
for Alzheimer’s disease: results from a study of Brazilian elderly with heterogeneous educational backgrounds. Int Psychogeriatr. 2010;22(1): 64-71.
17. Nucci FCRF, Coimbra VMA, Neri LA, Yassuda SM. Ausência de Relação entre Hipertensão Arterial Sistêmica e Desempenho Cognitivo em Idosos de Uma Comunidade. Arch Psiquiatr Clín. 2010;37(2):52-6
18. Hannesdottir K, Nitkunan A, Chalton AR, Barrick RT, MacGregor AG, Markus SH. Cognitive Impairment and White Matter Damage in Hyper-tension: A Pilot Study. Acta Neurol Scand. 2009;119:261-8.
19. Avadhani R, Fowler K, Barbato C, Sherine T, Wong W, Paul C, et al. Glycemia and Cognitive Function in Metabolic Syndrome and Coronary Heart Disease. Am J Med. 2015;128(1):46-55.