CLINICAL SCIENCE
Evaluation of prognostic factors in stage IIA breast
tumors and their correlation with mortality risk
Solange Torchia Carvalho, Monica Maria Stiepcich, Jose´ Humberto Fregnani, Sueli Nonogaki, Rafael Rocha, Fernando Augusto Soares
Department of Breast Surgery, Hospital do Caˆncer- A C Camargo, Sa˜o Paulo, SP, Brazil.
ABSTRACT:Breast tumors exhibit extensive molecular and clinical heterogeneity. One of the most utilized breast carcinoma classifications is based on its molecular aspects and subdivides breast cancer into five major groups based on the expression of certain genes. In this study, we evaluated which factors are important in determining a prognosis after 5 years of follow-up for patients with clinical stage IIA breast tumors. We took into consideration the different phenotypes (luminal A luminal B HER-2 overexpression, basal and triple-negative), various epithelial-mesenchymal (EMT) molecular markers and adhesion molecules (E-cadherin, P-cadherin, N-cadherin, vimentin, twist snail and slug) and NOS-2, in addition to clinical and demographic data, tumor characteristics and treatment types.
METHODS:The study population consisted of 82 patients with breast cancer. We analyzed eight molecular markers by immunohistochemistry on tissue microarrays containing breast tumor specimens from patients with ten years of follow-up, and we classified each tumor according to its estrogen receptor, progesterone receptor and HER-2 expression. We then placed the tumor into one of the above categories.
RESULTS:The presence of several clinical and demographic factors, various histopathologies, treatment forms and several immunohistochemical markers were not associated with a worse prognosis for group IIA patients. The factors that were associated with a mortality risk were the triple-negative (odds ratio (OR) = 11.8, 95% confident interval (CI) = 2.0-70.3,P =0.007) and basal (OR = 18.4, 95% CI = 1.8-184.7,P =0.013) phenotypic patterns.
CONCLUSIONS:The EMT markers and NOS-2 were not mortality risk factors. Basal and triple-negative phenotypic patterns were related to a higher mortality risk in patients with stage IIA tumors.
KEYWORDS: Breast cancer; molecular markers; staging; tissue microarray; immunohistochemistry.
Carvalho SMT, Stiepcich MA, Fregnani JH, Nonogaki S, Rocha RM, and Soares FA. Evaluation of prognostic factors in stage IIA breast tumors and their correlation with mortality risk. Clinics. 2011;66(4):607-612.
Received for publication onNovember 11, 2010;First review completed onDecember 2, 2010;Accepted for publication onJanuary 12, 2011 E-mail: [email protected]
Tel.: 55 11 55493864
INTRODUCTION
Breast cancer is the most frequent malignant neoplasm among women worldwide, and in Brazil, and it is one of the leading causes of cancer-related death.1,2 Despite the increased incidence in Brazil and other countries, large international studies show that higher-efficiency screening programs, better diagnostic image definition and the appropriate use of adjuvant drug therapies have led to improved patient survival in the last few decades.3,4A long-term survival patient is defined as one who is still living 5 years after first being diagnosed with cancer.5For breast cancer, 5- and 10-year survival rates are 88% and 77%, respectively, both of which are quite good as compared with
the 5-year survival rate of all other types of cancer combined.5,6 Breast tumors classified as stage IIA are tumors presenting with local or disseminated disease in the homolateral axillary lymph nodes. At this stage, around 80% of patients survive disease-free after 5 years;7,8the data also show that 20% will die within the same time interval despite the good prognosis associated with these cases.8
With the evolution of genomic techniques and, conse-quently, the use of molecular markers, prognostic informa-tion must be continuously refined. However, these data are still not sufficient for breast cancer specialists and clinical oncologists when compared with the standard anatomical-pathological reports used to determine the best course of action in some specific cases.
At the beginning of this century, some groups studied the molecular signature of invasive ductal carcinomas (IDCs)9,10
and showed that the phenotypic diversity in breast tumors was associated with diversity in gene expression. These gene expression profiles were called luminal (A and B), HER-2 overexpression, basal and similar to normal breast. Copyrightß2011CLINICS- This is an Open Access article distributed under
Importantly, this classification showed prognostic value and validated well-known clinical behaviors demonstrated in the literature.
Some molecular markers of epithelial-mesenchymal transi-tion (EMT) (e.g., vimentin, snail, slug and twist) are correlated with survival, and their expression may be associated with a more aggressive phenotype, more mesenchymal differentia-tion, and thus, decreased survival.11-13The IHC markers that have been studied include adhesion molecules (E-cadherin, N-cadherin and P-N-cadherin) and nitric oxide synthase 2 (NOS-2). On the basis of these observations and with the intention of improving the immunohistochemical signature of stage IIA breast tumors, we designed our study to evaluate which factors affect the mortality rate in 10 years of follow-up, taking into account the different phenotypes (luminal A, luminal B, HER-2 overexpression, basal and triple-negative), the differ-ent EMT molecular markers and adhesion molecules (E-cadherin, P-(E-cadherin, N-(E-cadherin, vimentin, twist, snail and slug) and NOS-2, in addition to clinical and demographic data, tumor characteristics and treatment types.
MATERIALS AND METHODS
Study design, patients’ characteristics and tissue samples
This study design followed the main criteria defined by REMARK.14The study population consisted of 82 patients
with IDC who were operated on at A. C. Camargo Hospital from 1980 to 1999; they were previously identified from surveys on file in the hospital’s Department of Pathology. The study protocol was approved by the Research Ethics Committee at the Center for Treatment and Research, Cancer Hospital, A. C. Camargo. The patients selected for this study were diagnosed as having clinical stage IIA breast cancer (T0N1M0, T1N1M0 and T2N0M0)15 and having a sufficient amount of representative material from the tumor for the study. In this study, we analyzed 82 cases of female patients diagnosed with stage IIA IDC.
We selected patients with a 5-year minimum follow-up period (60 months). All of the patients were alive, and those patients with less than 60 months of follow-up were excluded from the analysis. The maximum follow-up period was 10 years (120 months), and we counted mortality at any time during the follow-up. The date of the first consultation at the Department of Mastology, Cancer Hospital, A. C. Camargo, was considered as the start date for clinical follow-up, and the date of the last consultation or death was considered as the end date. We considered those cases in which the patients
did not return for consultation and did not respond to telephone calls or telegraphs as loss to follow-up.
We reviewed the clinical records, noting the relevant clinical-pathological information (clinical and demographic data, anatomopathological staging, therapeutic adjuvant, follow-up, relapse and survival) in an Excel spreadsheet.
For all of the selected cases, we recovered the original hematoxylin/eosin (H&E)-stained slides and the corre-sponding paraffin-embedded tissue blocks, from which we made new histological sections. Using conventional slides, we stained the representative areas of the invasive compo-nent to orient the puncturing and removal of small core biopsies, which were used to construct a tissue microarray (TMA). A core was removed from each original tumor block using a specially designed precision instrument for con-structing TMAs (Beecher InstrumentsH, Silver Spring, Maryland), as described previously.16The diameter of each
block core used for the TMA was 1.0 mm. The histological sections from the TMA blocks, with an average thickness of 4mm, were mounted on special electrically charged slides
(Instrumedics Inc.H, Richmond, USA) to facilitate their orientation after the microtomy and for immunohistochem-istry (IHC) analysis.
Immunohistochemistry of TMAs
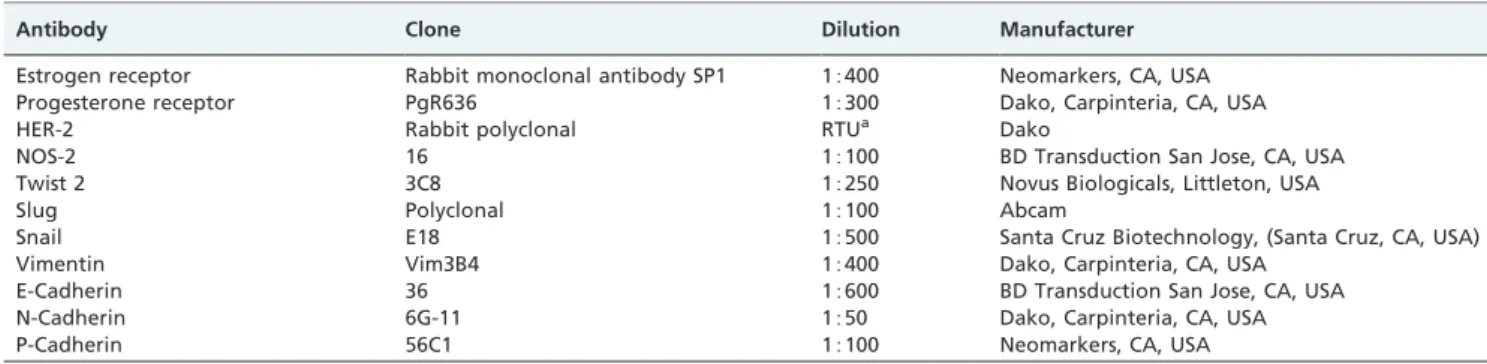
The immunohistochemistry (IHC) study was performed with antibodies that recognized the different markers used. For the IHC reactions, we followed the specific standardized protocols from the manufacturers and previous reports for each marker. All of the reactions included positive and negative controls that were stained in parallel with the slides from the study. Table 1 shows the complete list of the nine antibodies used with their respective clones, dilutions and manufacturers.
Evaluation of IHC
Immunostaining was evaluated by light microscopy. When evaluating the IHC reactions, we took into account only the percentage of stained cells and classified them according to a specific expression pattern for each antibody and the number of positive cells.17For the nuclear markers,
the cells were considered positive when the percent of stained nuclei was greater than 1% and negative when this staining was less than 1%. For cytoplasmic and membra-nous markers, we considered as positive those cases with more than 10% stained cells. Examples of positive and negative cases are shown in Figures 1 through 3.
Table 1 -Antibodies and protocols used in the reactions.
Antibody Clone Dilution Manufacturer
Estrogen receptor Rabbit monoclonal antibody SP1 15400 Neomarkers, CA, USA
Progesterone receptor PgR636 15300 Dako, Carpinteria, CA, USA
HER-2 Rabbit polyclonal RTUa Dako
NOS-2 16 15100 BD Transduction San Jose, CA, USA
Twist 2 3C8 15250 Novus Biologicals, Littleton, USA
Slug Polyclonal 15100 Abcam
Snail E18 15500 Santa Cruz Biotechnology, (Santa Cruz, CA, USA)
Vimentin Vim3B4 15400 Dako, Carpinteria, CA, USA
E-Cadherin 36 15600 BD Transduction San Jose, CA, USA
N-Cadherin 6G-11 1550 Dako, Carpinteria, CA, USA
P-Cadherin 56C1 15100 Neomarkers, CA, USA
The IHC slide readings were performed on a shared optic microscope. ER (estrogen receptor) and PR (progesterone receptor) status was determined on the basis of IHC staining. Tumors were considered HER-2-positive only if they were scored as 3+by IHC or if they wereHER-2 amplified (ratio.
or = 2.0) on the basis of fluorescence in situhybridization
(FISH). In the absence of positive FISH data, tumors with indeterminate IHC scores (2+) were considered negative.
Immunophenotypical classification
From the results of the IHC reactions, we identified five sub-groups based on the immunohistochemical expression of ER, PR, HER-2 and CK5, 6, as follows: luminal A (ER positive, PR positive and HER-2 negative), luminal B (ER positive and/or PR positive and HER-2 positive), HER-2 over-expression (ER negative, PR negative and HER-2 positive), triple-negative (ER negative, PR negative and HER-2 negative) and basal pattern (ER negative, PR negative, HER-2 negative and/or CK5 and 6 positive).
Statistical methods
The results were analyzed using SPSS v.13 (SPSS Inc., USA, 2004) and GraphPad Prism v.4.02 (GraphPad Software
Inc., USA, 2000). We characterized the sample using descriptive statistics. We performed association analysis between categorical variables using the chi-square or Fisher’s exact test, depending on the values we observed in the contingency tables. We used logistic regression to identify independent risk factors associated with mortality. The final models were adjusted for chemotherapy comple-tion, hormone therapy and age (as a continuous variable). The adjustments for age, chemotherapy completion and hormone therapy were based on a greater potential for interference with the outcome (death). In all of the models, the control variables were not significant. For the mortality analysis, we truncated the follow-up period to 120 months, and we used a cross-sectional evaluation of the data. A 5% significance level was used for all of the tests.
RESULTS
When analyzing the stage IIA patients, we observed that there were no significant associations between mortality and any of the clinical, demographic or treatment-related variables (Table 2). When we analyzed the histopathologic variables, we observed that none of them was significantly
Table 2 -Case distribution according to clinical and demographic variables, histopathologic variables, treatment forms and mortality within 120 months of follow-upaamong women with stage IIA tumors (n = 82).
Mortality within 120 months
No Yes
VARIABLES CATEGORIES n % n % P**
Clinical and DemographicaData
Age Up to 50 years 24 72.7 9 27.3 0.807
.50 years 33 70.2 14 29.8
Skin color White 44 68.8 20 31.3 0.264
Non-white 9 90.0 1 10.0
Number of pregnancies None 10 71.4 4 28.6 1.000
One or more 41 70.7 17 29.3
Hormonal status Pre-menopause 26 72.2 10 27.8 0.744
Post-menopause 31 68.9 14 31.1
Family history No 42 71.2 17 28.8 1.000
Yes 10 71.4 4 28.6
Histopathologya
Tumor size Up to 2.0 cm 14 87.5 2 12.5 0.127
2.1 - 5.0 cm 41 65.1 22 34.9
Scarff-Bloom-Richardson Degrees 1 and 2 50 73.5 18 26.5 0.332
Degree 3 8 57.1 6 42.9
Nuclear grade Degrees 1 and 2 28 87.5 4 12.5 0.008
Degree 3 30 60.0 20 40.0
Mitotic index 0 to 9 37 78.7 10 21.3 0.106
10 or more 9 56.3 7 43.8
Lymph node metastasis No 45 68.2 21 31.8 0.329
Yes 12 86.7 2 14.3
Treatmenta
Neoadjuvant chemotherapy No 49 73.1 18 26.9 0.345
Yes 3 50.0 3 50.0
Neoadjuvant radiotherapy No 50 72.5 19 27.5 0.574
Yes 2 50.0 2 50.0
Adjuvant chemotherapy No 21 70.0 9 30.0 0.846
Yes 31 72.1 12 27.9
Adjuvant radiotherapy No 15 68.2 7 31.8 0.705
Yes 37 72.5 14 27.5
Hormone therapy No 27 79.4 7 20.6 0.149
Yes 45 64.1 14 35.9
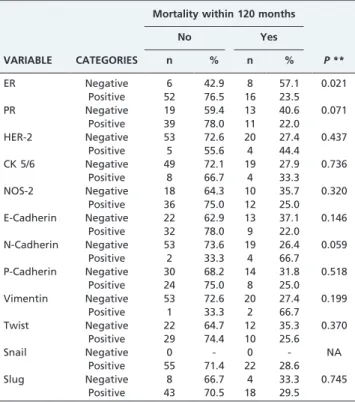
associated with mortality, except for the nuclear grade variable; the majority of patients who died had grade 3 tumors (P= 0.008) (Table 2). For the biomolecular variables
and mortality, we observed that ER expression was positive in significantly more patients who did not die than those that did die (P= 0.021) (Table 3).
When we analyzed the distribution of the cases according to their phenotypic profile, we observed a larger proportion of luminal A patients among the patients who did not die than those that did die (P= 0.006) and a larger proportion of
patients who died in the triple-negative (P= 0.016) and basal
sub-groups (P= 0.018) (Table 4).
Using logistic regression, we individually tested the luminal A, triple-negative and basal phenotype variables (models) adjusted for age, chemotherapy completion and hormone therapy, in clinical stage IIA tumors. When evaluating the mortality risk within 120 months, we observed that the patients with a phenotypic pattern other than luminal A had an increased risk of dying (Model A, OR = 6.3, 95% CI = 1.7-22.6,P= 0.005). We also observed that
patients with the triple-negative and basal patterns had an increased risk of dying, respectively (Model B, OR = 11,8, 95% CI = 2.0-70.3,P= 0.007) and (Model C, OR = 18.4, 95%
CI = 1.8-184,7, P= 0.013), independent of the effect of
hormone therapy, adjuvant chemotherapy or age (Table 5). When analyzing the mortality risk within 120 months according to luminal B and HER-2 overexpression patterns in multivariate analysis, (model adjusted for age, hormone therapy and adjuvant chemotherapy completion), we
observed that these patterns were not associated with a risk factor of mortality (luminal B, OR = 0.9, 95% CI = 0.1-12.3, P= 0.921) and (HER-2, OR = 0.4, 95% CI = 0.1-2.8, P= 0.342).
DISCUSSION
Breast cancer is one of the most common tumors in women. According to data from the Instituto Nacional de Caˆncer INCA (Brazilian National Cancer Institute), there will be an estimated 49,240 cases of breast cancer in Brazil in 2010.1
Only a few published studies have analyzed which prognostic factors influence long-term patient survival with clinical stage IIA breast cancer. This deficit was the main impetus for conducting our study.
In this study, we analyzed stage IIA breast tumors, taking into account the variables of age, race, number of
Table 3 -Case distribution according to biomolecular variables and mortality within 120 months of follow-upa among women with stage IIA tumors (n = 82).
Mortality within 120 months
No Yes
VARIABLE CATEGORIES n % n % P**
ER Negative 6 42.9 8 57.1 0.021
Positive 52 76.5 16 23.5
PR Negative 19 59.4 13 40.6 0.071
Positive 39 78.0 11 22.0 HER-2 Negative 53 72.6 20 27.4 0.437
Positive 5 55.6 4 44.4 CK 5/6 Negative 49 72.1 19 27.9 0.736
Positive 8 66.7 4 33.3 NOS-2 Negative 18 64.3 10 35.7 0.320
Positive 36 75.0 12 25.0 E-Cadherin Negative 22 62.9 13 37.1 0.146
Positive 32 78.0 9 22.0 N-Cadherin Negative 53 73.6 19 26.4 0.059
Positive 2 33.3 4 66.7 P-Cadherin Negative 30 68.2 14 31.8 0.518
Positive 24 75.0 8 25.0 Vimentin Negative 53 72.6 20 27.4 0.199
Positive 1 33.3 2 66.7 Twist Negative 22 64.7 12 35.3 0.370
Positive 29 74.4 10 25.6
Snail Negative 0 - 0 - NA
Positive 55 71.4 22 28.6
Slug Negative 8 66.7 4 33.3 0.745
Positive 43 70.5 18 29.5
aLiving patients with less than 60 months of follow-up were excluded from the analysis.
bNot available because of the reduced number of cases in one of the categories.
**Chi-square test or Fisher’s exact test.
Table 4 -Case distribution according to the phenotypic biomolecular profile and mortality within 120 months of follow-upaamong women with stage IIA tumors (n = 82).
Mortality within 120 months
No Yes
VARIABLE CATEGORIES n % n % P **
Luminal Ab No 8 44.4 10 55.6 0.006 Yes 50 78.1 14 21.9 Luminal Bb No 56 71.8 22 28.2 0.577
Yes 2 50.0 2 50.0
HER-2 over-expressionb
No 55 71.4 22 28.6 0.627
Yes 3 60.0 2 40.0
Triple-negativeb No 55 75.3 18 24.7 0.016
Yes 3 33.3 6 66.7
Basalb No 56 75.7 18 24.3 0.018
Yes 2 28.6 5 71.4
aLiving patients with less than 60 months of follow-up were excluded from the analysis.
bGroup determination:
Luminal A: (ER+or PR+) and HER-2-. Luminal B: (ER+or PR+) and HER-2+.
HER-2 overexpression: ER-and PR-and HER-2+.
Triple-negative: ER-and PR-and HER-2-.
Basal: Triple-negative and (EGFG+or CK5/6+or p63n+or P-cadherin+or
CK14+).
**Chi-square test or Fisher’s exact test.
Table 5- Evaluation of the mortality risk within
120 monthsaaccording to the luminal A, triple-negative and basal phenotypic patterns using multivariate analysis (logistic regression). Models were individually adjusted by age, hormone therapy and adjuvant chemotherapy (number of deaths considered in the model = 21).
VARIABLE CATEGORY n OR 95% CI P
Luminal A No 16 6.3 1.7-22.6 0.005 Yes 57 1.0 Reference Triple-negative No 30 1.0 Reference 0.007
Yes 43 11.8 2.0-70.3
Basal No 66 1.0 Reference 0.013
Yes 6 18.4 1.8-184.7
pregnancies, hormonal status and family history. We did not find any statistically significant correlation with mortality risk within the 120-month follow-up period.
According to the literature, one important factor in determining long-term survival is age.18,19Younger patients (30-35 years) have a worse survival rate as compared with patients aged 70 or older. In our analysis, we did not find any statistically significant correlation between age and survival during the 120 months.
Considering the histopathologic variables, we observed that the nuclear grade variable was the only one associated with mortality. For variables related to treatment and mortality within 120 months, none had a statistically significant association. Several studies have shown an association between high histological grade and reduced disease-free survival.18,20-22The histological grade also has a significant impact on the selection of patients who will undergo systemic adjuvant treatment. The histological grade takes into consideration tubular formation, nuclear grade and mitotic index.23 However, the individual prog-nostic value of each one of its components—especially the nuclear grade—has not received much attention in the literature.
The patients who were ER-positive had a reduced mortality rate within the 120-month follow-up period (P= 0.021). Previous findings have demonstrated that ER
positivity confers a better prognosis for the patients, independent of sub-group, which allows for the use of specific anti-hormonal medication.3,6
Luminal A tumors are characterized by their positive ER expression and/or positive PR expression and negative HER-2 expression profile.24 According to Zaha et al.,25 tumors in the luminal A sub-group are more often asso-ciated with ER positivity, a larger percentage of patients in stages I and II and moderately differentiated tumors. Fernandes et al.26 observed that the presence of hormone receptors defines a sub-group with more favorable mor-phological characteristics.
When analyzing the stage IIA patients in relation to the mortality risk within 120 months, the multivariate analysis showed that the patients with a phenotypic pattern other than luminal A had an increased risk of dying (6.3 times) within 120 months, independent of the effects of hormone therapy, chemotherapy and age. We also observed an increased risk in the triple-negative pattern (11.8 times) and the basal pattern (18.4 times). Even with statistical significance, it is important to emphasize that the confidence interval is very wide because there were few cases with a positive basal pattern (only six cases in the model). Although this result should be interpreted with caution, the basal pattern may nonetheless represent a risk factor for death.
In general, the literature indicates that patients with a basal or triple-negative breast tumor pattern have a worse prognosis.27-29Haupt et al.30 observed that when a tumor
belonged to the basal sub-group, it was associated with a worse prognosis in both early and advanced stages in addition to being more frequently associated with visceral dissemination. Recently, De Brot et al.31demonstrated that patients with basal sub-group tumors had an average disease-free survival of 28 months and an overall survival of 36 months, of which only 50% were disease-free. Basal sub-group tumors also appear to be more common among
young women. In our experience, more than 50% of the cases in this population have a basal phenotype.32
This association between decreased survival and non-luminal A tumors can also be analyzed in relation to the expression of EMT markers. The progression of breast cancer is a result, among others, of a process involving a loss of epithelial characteristics and the acquisition of mesenchymal properties, which results in a more aggressive tumor phenotype.33Sarrio et al.34observed a correlation between
EMT and the basal pattern. Makdissi et al.35observed that in invasive breast carcinoma, tumor E-cadherin protein expres-sion may be related to overall breast cancer survival. In our study, we did not observe a relationship between the phenotypic profiles and the expression of EMT markers in stage IIA tumors by IHC. We assume that the expression of these EMT markers in breast tumors depends on the degree of transformation of epithelial cells into mesenchymal cells and that the entire process occurs via specific and complex regulation, in which each one of these factors can act in a distinct way during tumor progression.
In conclusion, none of the EMT markers or NOS-2 was related with mortality risk for stage IIA breast cancer. The mortality risk was associated with the tumor not belonging to the luminal A sub-group but instead belonging to the basal or triple-negative subgroup.
There is still much to learn about the biology of these tumors, and certainly the variable expression of the different markers that define basal- and triple-negative-type tumors should help clarify the distinctions between subpopulations. Even so, in our study, we observed no correlations between the studied IHC markers and survival. Thus, robust population-based studies with appropriate patient popula-tions are important to define these prognostic factors.
REFERENCES
1. Ca˜ncer de mama. Ministe´rio da Sau´de. Instituto Nacional do Ca˜ncer. http:// www1.inca.gov.br/estimativa/2009/index.asp?link = mapa.asp&ID = 13. 2. Jemal A, Siegel R, Ward E, Hao Y, Xu J, Thun MJ. Cancer statistics. CA
Cancer J Clin. 2009; 59:225-249, doi: 10.3322/caac.20006.
3. Effects of chemotherapy and hormonal therapy for early breast cancer on recurrence and 15-year survival: An overview of the randomised trials. Lancet. 2005; 365: 1687-1717, doi: 10.1016/S0140-6736(05)66544-0. 4. Smigal C, Jemal A, Ward E, Cokkinides V, Smith R, Howe HL, et al.
Trends in breast cancer by race and ethnicity: Update 2006. CA Cancer J Clin. 2006; 56: 168-183, doi: 10.3322/canjclin.56.3.168. 5. American cancer society. Cancer facts and figures. American Cancer
Society. 2005. Atlanta.
6. Soerjomataram I, Louwman MW, Ribot JG, Roukema JA, Coebergh JW. An overview of prognostic factors for long-term survivors of breast cancer. Breast Cancer Res Treat. 2008; 107: 309-330, doi: 10.1007/s10549-007-9556-1.
7. Singletary SE, Connolly JL. Breast cancer staging: Working with the sixth edition of the ajcc cancer staging manual. CA Cancer J Clin. 2006; 56: 37-47, doi: 10.3322/canjclin.56.1.37.
8. Gloeckler Ries LA, Reichman ME, Lewis DR, Hankey BF, Edwards BK. Cancer survival and incidence from the surveillance, epidemiology, and end results (seer) program. Oncologist. 2003;8:541-552, doi: 10.1634/ theoncologist.8-6-541.
9. Perou CM, Sorlie T, Eisen MB, van de Rijn M, Jeffrey SS, Rees CA, et al. Molecular portraits of human breast tumours. Nature. 2000;406:747-52, doi: 10.1038/35021093.
10. Sorlie T, Perou CM, Tibshirani R, Aas T, Geisler S, Johnsen H, et al. Gene expression patterns of breast carcinomas distinguish tumor subclasses with clinical implications. Proc Natl Acad Sci U S A. 2001;98:10869-74, doi: 10.1073/pnas.191367098.
11. Thompson EW, Newgreen DF, Tarin D. Carcinoma invasion and metastasis: A role for epithelial-mesenchymal transition? Cancer Res. 2005; 65: 5991-5, doi: 10.1158/0008-5472.CAN-05-0616.
13. Thiery JP, Sleeman JP. Complex networks orchestrate epithelial-mesenchymal transitions. Nat Rev Mol Cell Biol. 2006;7:131-42, doi: 10. 1038/nrm1835.
14. McShane LM, Altman DG, Sauerbrei W, Taube SE, Gion M, Clark GM. Statistics Subcommittee of NCI-EORTC Working Group on Cancer Diagnostics. Reporting recommendations for tumor MARKer prognostic studies (REMARK). Breast Cancer Res Treat. 2006;100:229-35, doi: 10. 1007/s10549-006-9242-8.
15. Sobin LH, Wittekind C. International Union against Cancer. Tnm: Classification of malignant tumours. 6th edn. New York, Wiley-Liss, 2006.
16. Kononen J, Bubendorf L, Kallioniemi A, Barlund M, Schraml P, Leighton S, et al. Tissue microarrays for high-throughput molecular profiling of tumor specimens. Nat Med. 1998;4:844-7, doi: 10.1038/nm0798-844.
17. Allred DC, Harvey JM, Berardo M, Clark GM. Prognostic and predictive factors in breast cancer by immunohistochemical analysis. Mod Pathol. 1998;11:155-68.
18. Arriagada R, Le MG, Dunant A, Tubiana M, Contesso G. Twenty-five years of follow-up in patients with operable breast carcinoma: Correlation between clinicopathologic factors and the risk of death in each 5-year period. Cancer. 2006;106:743-50, doi: 10.1002/cncr.21659. 19. Carey LA, Perou CM, Livasy CA, Dressler LG, Cowan D, Conway K,
et al. Race, breast cancer subtypes, and survival in the carolina breast cancer study. JAMA. 2006;295:2492-502, doi: 10.1001/jama.295.21.2492. 20. Thomas JS, Kerr GR, Jack WJ, Campbell F, McKay L, Pedersen HC, et al.
Histological grading of invasive breast carcinoma--a simplification of existing methods in a large conservation series with long-term follow-up. Histopathology. 2009;55:724-31, doi: 10.1111/j.1365-2559.2009.03429.x. 21. Fisher ER, Anderson S, Tan-Chiu E, Fisher B, Eaton L, Wolmark N.
Fifteen-year prognostic discriminants for invasive breast carcinoma: National surgical adjuvant breast and bowel project protocol-06. Cancer. 2001;91: 1679-87, doi: 10.1002/1097-0142(20010415)91:8+,1679::AID-CNCR1183.3.0.CO;2-8.
22. Warwick J, Tabar L, Vitak B, Duffy SW. Time-dependent effects on survival in breast carcinoma: Results of 20 years of follow-up from the swedish two-county study. Cancer. 2004;100:1331-6, doi: 10.1002/cncr. 20140.
23. Ellis IO, Elston CW. Tumors of the breast. In: Fletcher CDMDiagnostic histopathology of tumors. Churchill Livingstone, Edinburgh; New York; 1998.p 635-89.
24. Nielsen TO, Hsu FD, Jensen K, Cheang M, Karaca G, Hu Z, et al. Immunohistochemical and clinical characterization of the basal-like
subtype of invasive breast carcinoma. Clin Cancer Res. 2004;10:5367-74, doi: 10.1158/1078-0432.CCR-04-0220.
25. Zaha DC, Lazar E, Lazureanu C. Clinicopathologic features and five years survival analysis in molecular subtypes of breast cancer. Rom J Morphol Embryol. 2010;51:85-9.
26. Fernandes RC, Bevilacqua JL, Soares IC, Siqueira SA, Pires L, Hegg R, et al. Coordinated expression of er, pr and her2 define different prognostic subtypes among poorly differentiated breast carcinomas. Histopathology. 2009;55:346-352, doi: 10.1111/j.1365-2559.2009.03380.x. 27. van de Rijn M, Perou CM, Tibshirani R, Haas P, Kallioniemi O, Kononen J,
et al. Expression of cytokeratins 17 and 5 identifies a group of breast carcinomas with poor clinical outcome. Am J Pathol. 2002;161:1991-6, doi: 10.1016/S0002-9440(10)64476-8.
28. Dent R, Trudeau M, Pritchard KI, Hanna WM, Kahn HK, Sawka CA, et al. Triple-negative breast cancer: Clinical features and patterns of recur-rence. Clin Cancer Res. 2007;13:4429-34, doi: 10.1158/1078-0432.CCR-06-3045.
29. Reis-Filho JS, Tutt AN. Triple negative tumours: A critical review. Histopathology. 2008;52:108-18, doi: 10.1111/j.1365-2559.2007.02889.x. 30. Haupt B, Ro JY, Schwartz MR. Basal-like breast carcinoma: A
phenotypically distinct entity. Arch Pathol Lab Med. 2010;134:130-3. 31. De Brot M, Soares FA, Stiepcich MM, Curcio VS, Gobbi H. Basal-like
breast cancers: Clinicopathological features and outcome. Rev Assoc Med Bras. 2009;55:529-34, doi: 10.1590/S0104-42302009000500014. 32. Dutra MC, Rezende MA, de Andrade VP, Soares FA, Ribeiro MV, de Paula
EC, et al. Immunophenotype and evolution of breast carcinomas: A comparison between very young and postmenopausal women. Rev Bras Ginecol Obstet. 2009;31:54-60, doi: 10.1590/S0100-72032009000200002. 33. Logullo AF, Nonogaki S, Pasini FS, Osorio CA, Soares FA, Brentani MM.
Concomitant expression of epithelial-mesenchymal transition biomar-kers in breast ductal carcinoma: Association with progression. Oncol Rep. 2010;23: 313-20.
34. Sarrio D, Rodriguez-Pinilla SM, Hardisson D, Cano A, Moreno-Bueno G, Palacios J. Epithelial-mesenchymal transition in breast cancer relates to the basal-like phenotype. Cancer Res. 2008;68:989-997, doi: 10.1158/0008-5472.CAN-07-2017.