Dezembro, 2015
Analissa Santos Fonseca Duarte
Licenciada em Ciências de Engenharia Biomédica
The effect of UV radiation on DNA in the presence of
1,10-phenanthroline
Dissertação para obtenção do Grau de Mestre em
Engenharia Biomédica
Orientador: Professora Doutora Maria de Fátima Guerreiro da Silva
Campos Raposo, Professora Auxiliar, FCT-UNL
Júri:
Presidente: Doutora Carla Maria Quintão Pereira
Arguente: Doutora Andrea Antunes Pereira
Vogal: Doutora Maria de Fátima Guerreiro da Silva Campos Rapo-so
iii
The effect of UV radiation on DNA in the presence of
1,10-phenanthroline
Copyright © Analissa Santos Fonseca Duarte, Faculdade de Ciências e Tecnologia,
Universidade Nova de Lisboa.
v
“Ultimately what you do is secondary. But how you do it is primary.”
vii
Acknowledgements
Firstly I would like to thank my advisor, Professora Doutora Maria Raposo for giving me the opportunity to work on this project. I am profoundly grateful for all the knowledge transmit-ted and the orientation given throughout the elaboration of this work. Her teachings, encour-agement, mindset, and genuine humane qualities guided me, showing me that there is always another way to look at things.
To all the Professors and colleagues that somehow impacted my journey throughout these past years. I have learned and most of all grown because you have crossed my path.
To CEFITEC for providing all the necessary conditions that made the realization of this project possible. To REQUIMTE/DQ for making their laboratory and spectrophotometer avail-able when needed. The obtained results were crucial for this work.
To the Aarhus University, Denmark, for proving access to the Synchrotron Radiation fa-cility ASTRID, where the VUV absorption spectra were recorded.
Special thanks to all my colleagues with whom I shared the laboratory, especially to Ivan Assunção, and Crisolita Pires, who were always available to help and to give an incentive word.
To all my family and friends who always supported me throughout this process. Even though I cannot name each one of you, you are all very uniquely special and play a very im-portant role in my life.
To my little sister, Melissa Fonseca, that even far away, remains very present in my life, always willing to listen to me and have a good laugh together. I love you!
viii
To my son Swami Duarte, who has been a part of this journey since his very first day of life. You thought me the value of time, the need to be organized, disciplined and to prioritize in order to achieve something. You have been a great master.ix
Abstract
When designing drugs to treat diseases like cancer, which is characterized by an abnor-mal cellular growth, targeting the DNA seems logical in order to regulate cell functions. One possible way is to find molecules that are able to intercalate with DNA, and that in the presence of UV radiation will induce specific DNA lesions. These lesions could affect processes such as DNA transcription and replication, contributing to the non-proliferation of cancer cells. On this dissertation the influence of the intercalator 1,10-phenanthroline (Phen) on DNA degradation
was analyzed in the presence of UV radiation, 254 nm. The damages caused by UV radiation were studied by vacuum ultraviolet (VUV), ultraviolet-visible (UV-Vis), and Fourier transform infrared (FTIR) spectroscopy. The obtained results showed that the presence of water is essen-tial in order to observe the effect of UV radiation. Both DNA and Phen were degraded when exposed to UV radiation. Through FTIR characterization it was possible to conclude that de-spite the fact that Phen had a degrading effect on some DNA components, it generally had a protective effect on most of the DNA components.
xi
Resumo
Ao desenvolver medicamentos para tratar doenças como o cancro, que é caracterizado por um crescimento celular anormal, parece lógico ter-se como alvo o ADN para que se consiga regular as funções celulares. Uma possível alternativa é encontrar moléculas que são capazes de se intercalar com o ADN e que na presença de radiação UV vão induzir lesões específicas no mesmo. Essas lesões poderão afectar processos tais como a transcrição e replicação do ADN, contribuindo para a não proliferação de células cancerígenas. Nesta dissertação analisou-se a influência do intercalante 1,10-phenanthroline em presença de radiação UV, 254 nm, na
degra-dação do ADN. Os danos causados pela radiação UV foram analisados pelas técnicas de espec-troscopia ultravioleta de vácuo (VUV), ultravioleta-visível (UV-Vis), e infravermelho por trans-formada de Fourier (FTIR). Os resultados obtidos mostraram que a presença da água é essencial para que se possa observar o efeito da radiação UV. Através da caracterização por FTIR foi pos-sível concluir que embora o intercalante tenha um efeito degradante em alguns dos componen-tes do ADN, no geral apresenta uma acção mais protectora do que destruidora do ADN.
xiii
Contents
ACKNOWLEDGEMENTS ... VII
ABSTRACT ... IX
RESUMO ... XI
CONTENTS ... XIII
FIGURE CONTENTS ... XV
TABLE CONTENTS ... XVII
ABBREVIATIONS AND SYMBOLS ... XIX
1 INTRODUCTION ... 1
2 THE EFFECT OF RADIATION ON DNA AND INTERCALATORS ... 3
2.1 DNA MOLECULE AND UV RADIATION ... 3
2.2 PHOTODYNAMIC THERAPY (PDT) ... 7
2.3 INTERCALATORS ... 8
3 MATERIALS AND METHODS ... 11
3.1 MATERIALS ... 11
3.1.1 Deoxyribonucleic acid sodium salt from calf thymus (DNA) ...11
3.1.2 1,10-Phenanthroline (Phen) ...11
3.2 SAMPLE PREPARATION ... 12
3.2.1 Solutions ...12
3.2.2 Washing and storage of the substrates ...12
3.2.3 Preparation of cast films ...13
xiv
3.4 CHARACTERIZATION TECHNIQUES ... 15
3.4.1 Ultraviolet-visible (UV-Vis) and Vacuum Ultraviolet (VUV) spectroscopy 15 3.4.2 Fourier Transform Infrared (FTIR) Spectroscopy ... 19
4 CHARACTERIZATION BY VUV SPECTROSCOPY ... 21
4.1 CHARACTERIZATION OF THE SOLUTIONS OF DNA, AND 1,10-PHENANTHROLINE 21 4.2 THE EFFECT OF UV RADIATION ... 23
4.3 CONCLUSIONS ... 24
5 EFFECT OF UV RADIATION- CHARACTERIZATION BY UV-VIS ... 25
5.1 CALCULATION OF THE ABSORPTION COEFFICIENT... 25
5.2 CHARACTERIZATION OF THE SOLUTIONS OF DNA AND 1,10-PHENANTHROLINE 27 5.3 THE EFFECT OF UV RADIATION ... 30
5.4 CONCLUSIONS ... 34
6 EFFECT OF UV RADIATION- CHARACTERIZATION BY FTIR ... 35
6.1 CHARACTERIZATION OF DNA AND PHEN... 35
6.2 CHARACTERIZATION OF THE EFFECT OF UV RADIATION... 38
6.3 CONCLUSIONS ... 51
7 CONCLUSION ... 53
7.1 CONCLUSION ... 53
7.2 FUTURE WORKS ... 54
xv
Figure Contents
FIGURE 2.1:DNA NUCLEOTIDES (ADAPTED FROM [11]). ... 4
FIGURE 2.2:MOLECULAR STRUCTURE OF DNA: A)DNA DOUBLE HELIX, B) PARTIAL CHEMICAL STRUCTURE SHOWING THE COMPLEMENTARY STRANDS OF DNA, AND C) MAJOR AND MINOR GROOVES (ADAPTED FROM [11]). ... 4
FIGURE 2.3:THE ULTRAVIOLET PORTION OF THE ELECTROMAGNETIC SPECTRUM (ADAPTED FROM [14]). .... 6
FIGURE 2.4:DIFFERENT LESIONS THAT OCCUR AT ADJACENT PYRIMIDINE RESIDUES WHEN EXPOSED TO UV LIGHT [15]. ... 6
FIGURE 2.5:SCHEMA OF A PHOTOCHEMICAL REACTION DURING A PHOTODYNAMIC THERAPY (ADAPTED FROM [6]). ... 8
FIGURE 2.6:A-GENERIC INTERCALATION REPRESENTATION;B-SCHEMATIC REPRESENTATION OF A GENERAL INTERCALATING AGENT;C-GROOVE BINDING REPRESENTATION (ADAPTED FROM [3]). ... 9
FIGURE 2.7:CHEMICAL STRUCTURE OF ORGANIC INTERCALATORS:(1) ANTHRACENES,(2) ACRIDINES,(3) ANTHRAQUINONES,(4) PHENANTHRIDINES,(5) PHENANTHROLINES, AND (6) ELLIPTICINES [5]. ... 10
FIGURE 3.1:1,10-PHENANTHROLINE (ADAPTED FROM [24]). ... 11
FIGURE 3.2:SCHEME OF THE ULTRAVIOLET SYSTEM.(ADAPTED FROM [26]). ... 14
FIGURE 3.3:MATHEMATICAL DESCRIPTION OF IRRADIANCE FOR AN IDEAL LINEAR RADIATION SOURCE. .... 15
FIGURE 3.4:SCHEMATIC REPRESENTATION OF THE TRANSITIONS FOR EACH REGION OF THE ELECTROMAGNETIC SPECTRUM (ADAPTED FROM [31]). ... 17
FIGURE 3.5:SCHEMATIC DIAGRAM OF A DOUBLE-BEAM SPECTROPHOTOMETER (ADAPTED FROM [32]). ... 17
FIGURE 3.6:SKETCH OF THE ULTRAVIOLET BEAMLINE (UV1)[34]. ... 18
FIGURE 3.7:DIAGRAM OF A FTIR SPECTROPHOTOMETER (ADAPTED FROM [36])... 19
FIGURE 3.8:VIBRATIONAL MODES OF MOLECULES. ... 20
FIGURE 4.1:VUV ABSORPTION SPECTRUM OF 1,10-PHENANTHROLINE. ... 22
FIGURE 4.2:VUV ABSORPTION SPECTRA OF CAST FILMS OF DNA+PHEN, BEFORE AND AFTER BEING IRRADIATED FOR A PERIOD OF 3 HOURS. ... 23
xvi
FIGURE 5.1:UV-VIS ABSORBANCE SPECTRA OF AQUEOUS SOLUTIONS OF PHEN WITH DIFFERENTCONCENTRATIONS. ... 26 FIGURE 5.2:REPRESENTATION OF ABSORBANCE AT DIFFERENT WAVELENGTHS AS A FUNCTION OF
CONCENTRATION OF PHEN. ... 26 FIGURE 5.3:UV-VIS ABSORPTION SPECTRA OF A)DNA, B)1,10-PHENANTHROLINE AND C)[1:1](V/V)
DNA+1,10-PHENANTHROLIN ... 28 FIGURES 5.4:ABSORBANCE SPECTRA OF A)DNA, B)1,10-PHENANTHROLINE AND C)[1:1](V/V
)DNA+1,10-PHENANTHROLINE, AS THE TIME OF EXPOSURE TO UV RADIATION INCREASES. ... 31 FIGURE 5.5:EVOLUTION OF THE NORMALIZED ABSORBANCE OF THE BAND AT 260 NM, AS THE EXPOSURE TO
UV RADIATION INCREASES FOR THE THREE DIFFERENT SOLUTIONS OD DNA,PHEN, AND [1:1](V/V)
DNA+PHEN. ... 32 FIGURE 6.1:INFRARED ABSORBANCE SPECTRUM OF A)DNA, AND B)DNA+PHEN. ... 36 FIGURE 6.2:INFRARED ABSORBANCE SPECTRA OF A)DNA AND B)DNA+PHEN CAST SAMPLES EXPOSED TO DIFFERENT INTERVALS OF IRRADIATION. ... 39 FIGURE 6.3:INFRARED ABSORBANCE SPECTRA,, FROM 900 CM-1 TO 1400 CM-1 OF A)DNA AND B)
DNA+PHEN CAST SAMPLES EXPOSED TO UV RADIATION FOR DIFFERENT PERIODS OF TIME. ... 40 FIGURE 6.4:EVOLUTION OF THE PEAK AT 965 CM-1, OF THE INFRARED ABSORBANCE SPECTRA OF
DNA+PHEN CAST FILM IRRADIATED FOR DIFFERENT TIME PERIODS. ... 41 FIGURE 6.5:EVOLUTION OF THE PEAK AT 965 CM-1, OF THE INFRARED ABSORBANCE SPECTRA OF DNA AND
DNA+PHEN CAST FILM AS THE EXPOSURE TIME TO UV RADIATION INCREASES. ... 42 FIGURE 6.6: INFRARED ABSORBANCE SPECTRA OF A)DNA, AND B)DNA+PHEN CAST FILMS IRRADIATED
FOR DIFFERENT TIME PERIODS, FROM 1000 TO 1150 CM-1. ... 43 FIGURE 6.7:EVOLUTION OF THE PEAK AT 1015 CM-1, OF THE INFRARED ABSORBANCE SPECTRA OF DNA
AND DNA+PHEN CAST FILM AS THE EXPOSURE TIME TO UV RADIATION INCREASES. ... 43 FIGURE 6.8:EVOLUTION OF THE PEAK AT 1055 CM-1, OF THE INFRARED ABSORBANCE SPECTRA OF DNA
AND DNA+PHEN CAST FILM AS THE EXPOSURE TIME TO UV RADIATION INCREASES. ... 44 FIGURE 6.9:EVOLUTION OF THE PEAK AT 1087 CM-1, OF THE INFRARED ABSORBANCE SPECTRA OF DNA
AND DNA+PHEN CAST FILM AS THE EXPOSURE TIME TO UV RADIATION INCREASES. ... 44 FIGURE 6.10:INFRARED ABSORBANCE SPECTRA OF A)DNA AND B)DNA+PHEN CAST FILMS IRRADIATED
FOR DIFFERENT TIME PERIODS, FROM 1150 TO 1300 CM-1. ... 45 FIGURE 6.11:EVOLUTION OF THE PEAK AT 1232 CM-1, OF THE INFRARED ABSORBANCE SPECTRA OF DNA
AND DNA+PHEN CAST FILM AS THE EXPOSURE TIME TO UV RADIATION INCREASES. ... 46 FIGURE 6.12:EVOLUTION OF THE PEAK AT 1280 CM-1, OF THE INFRARED ABSORBANCE SPECTRA OF DNA
AND DNA+PHEN CAST FILM AS THE EXPOSURE TIME TO UV RADIATION INCREASES. ... 46 FIGURE 6.13:EVOLUTION OF THE PEAK AT 1295 CM-1, OF THE INFRARED ABSORBANCE SPECTRA OF DNA
AND DNA+PHEN CAST FILM AS THE EXPOSURE TIME TO UV RADIATION INCREASES. ... 47 FIGURE 6.14:EVOLUTION OF THE ABSORBANCE SPECTRA OF A)DNA AND B)DNA+PHEN, FROM 1300 TO
1400 CM-1, AS THE IRRADIATION TIME INCREASES. ... 47 FIGURE 6.15:EVOLUTION OF THE ABSORBANCE SPECTRA OF A)DNA AND B)DNA+PHEN FROM 1400 TO
1800 CM-1, AS THE IRRADIATION TIME INCREASES. ... 48 FIGURE 6.16:EVOLUTION OF THE PEAK AT 1604 CM-1, OF THE INFRARED ABSORBANCE SPECTRA OF DNA
AND DNA+PHEN CAST FILM AS THE EXPOSURE TIME TO UV RADIATION INCREASES. ... 49 FIGURE 6.17:EVOLUTION OF THE PEAK AT 1653 CM-1, OF THE INFRARED ABSORBANCE SPECTRA OF DNA
xvii
Table Contents
TABLE 3.1:SOLUTIONS USED FOR THE PREPARATION OF CAST FILMS ... 13 TABLE 3.2:ELECTRONIC TRANSITIONS ASSOCIATED WITH REGIONS OF THE ELECTROMAGNETIC SPECTRUM
... 16 TABLE 4.1:PEAK PARAMETERS FOR VUV DATA OF PHEN. ... 22 TABLE 5.1:PARAMETERS OBTAINED FROM THE LINEAR FIT OF ABSORBANCE AT 229 NM, AND 262 NM,
WHERE Ε IS THE ABSORPTION COEFFICIENT OF PHEN, AND R IS THE CORRELATION COEFFICIENT. ... 27
TABLE 5.2:ABSORPTION COEFFICIENT OF DNA[41]. ... 27 TABLE 5.3:PEAK PARAMETERS OBTAINED FROM FITTING THE UV-VIS SPECTRA OF DNA AND
1,10-PHENANTROLINE. ... 29 TABLE 5.4:EXPONENTIAL TIME CONSTANT OBTAINED FROM AN EXPONENTIAL FIT TO THE EXPERIMENTAL
RESULTS OF THE SPECTRA AT 260 NM. ... 32 TABLE 5.5:CALCULATIONS OF ABS260 TAKING INTO ACCOUNT THE INITIAL CONCENTRATION OF THE
SAMPLES. ... 33 TABLE 5.6:ABS260 AFTER BEING IRRADIATED FOR 30 MINUTES. ... 33 TABLE 6.1:CHARACTERISTIC INFRARED ABSORPTIONS IN DNA CAST FILMS [47]. ... 37 TABLE 6.2:CHARACTERISTIC INFRARED ABSORPTIONS IN PHEN CAST FILMS AND THEIR ASSIGNMENT
[48][49][50]. ... 38 TABLE 6.3:CHARACTERISTIC INFRARED ABSORPTION PEAKS FOR DNA AND DNA+PHEN AND THE
CORRESPONDENT DECAYING CONSTANT AND ASSIGNMENT.THE COLUMN EFFECT OF PHEN,
xix
Abbreviations and Symbols
(6-4)PPs
1 O2
A
Pyrimidine (6-4) Pyrimidine Photoproducts
Singlet Oxygen
Adenine
Abs Absorbance
C Cytosine
CaF2 Calcium Fluoride
CAS Chemical Abstracts Service
CEFITEC
CPDs
Centre of Physics and Technological Research
Cyclobutane Pyrimidine Dimers
D Dose of Irradiation
DNA Deoxyribonucleic Acid
DQ Department of Chemistry
FTIR Fourier Transform Infrared
G Guanine
H2O2 Hydrogen Peroxide
H2SO4 Sulfuric Acid
xx
I Irradiance
IR
M
Infrared
Molar (mol/L)
MB Methylene Blue
MΩ Mega Ohm
PDT Photodynamic Therapy
Phen
R
1,10-phenanthroline
Correlation coefficient
REQUIMTE Rede de Química e Tecnologia
RNA ROS T UV UVA UVB UVC UV-Vis V VUV W α Ribonucleic Acid
Reactive Oxygen Species
Thymine Ultraviolet Ultraviolet A Ultraviolet B Ultraviolet C Ultraviolet-visible Volt Vacuum Ultraviolet Watt Alpha angle
ε Absorption coefficient
σ Sigma
τ Time constant
φ Radiation flux
1
1
Introduction
According to the National Cancer Institute [1], cancer is among the most leading causes of death worldwide. In 2012, there were 14 million new cases and 8.2 million cancer-related deaths worldwide, and the number of new cancer cases is estimated to rise to 22 million within the next two decades. When facing the statistics, the urgency to find new ways of preventing and treating cancer diseases becomes very clear.
The discovery of the double helix structure of the deoxyribonucleic acid (DNA) by Wat-son and Crick brought new light on how the genetic information is stored and transmitted from generation to generation. The information on how this genetic information is expressed and how to stimulate and prevent gene expression is crucial to finding new anticancer drugs and treat-ments [2]. The DNA molecule structure can be disrupted by the insertion of planar aromatic molecules into the DNA helix. This process is called intercalation, and results in significant conformational changes of the DNA structure which may cause functional changes. These changes may prevent the replication of DNA and therefore inhibit the growth of cancer cells or ultimately lead to cell death [3].
The process of DNA intercalation was first discovered by Lerman [4] in 1961 through his studies into the binding of acridines to DNA. Since then, a considerable number of organic, in-organic octahedral and square planar compounds have been developed as anticancer and diag-nostic agents [5].
Intercalators can then be used as anticancer drugs utilized in photodynamic therapy (PDT). In PDT the cells are targeted by a photosensitizer (intercalator). When exposed to a light source in the presence of oxygen, the photosensitizer is activated and reactive oxygen spe-cies (ROS) are formed, which result in cellular destruction [6].
2
Rocha[7] recently studied the intercalator methylene blue (MB) and found that it has a protective effect on DNA. When irradiated with ultraviolet (UV) light and in the absence of the intercalator, the adenine and thymine bases suffered damages. However, in the presence of MB there were minimal damages, which confirm the protective effect that the intercalator has on DNA. Regarding the other bases, cytosine and guanine, they were degraded both in the presence and absence of MB.Neves [8], on the other hand, studied the mechanisms of interaction between DNA and the intercalator 2,2'-bypiridil in the presence of UV radiation. The results showed that in the presence of the intercalator, there is a more rapidly DNA degradation, and therefore 2,2'-bypiridil may be a possible candidate to induce DNA lesions.
This project aims to understand the influence of the intercalator, 1-10-phenantroline (Phen), on DNA degradation. The effect of UV radiation on the intercalator-DNA mixture will be studied by ultraviolet-visible (UV-Vis) spectroscopy of aqueous solutions of the compounds; and Fourier transform infrared (FTIR), and vacuum ultraviolet (VUV) spectroscopy of cast films irradiated for different time intervals.
3
2
The effect of radiation on DNA
and Intercalators
2.1
DNA molecule and UV radiation
The discovery of the DNA structure by James Watson and Francis Crick in 1953 was responsible for significant scientific advances. The structure of DNA was crucial to unveil some fundamental information, like the mechanism whereby the hereditary information is copied for transmission from cell to cell, and how proteins are specified by the instructions in the DNA [9]
The DNA molecule is composed of two long polynucleotide strands wound into a helix. Each of these strands is composed of four types of subunits known as nucleotides. DNA nucleo-tides (Figure 2.1) are composed of a five-carbon sugar (deoxyribose), to which is attached one
or more phosphate groups and a nitrogen-containing base, that may be either adenine (A), cyto-sine (C), guanine (G), or thymine (T). A and G are purine bases while C and T are pyrimidine bases [10].
Hydrogen bonds between the base portions of nucleotides on opposite strands are what hold the two DNA chains together. The pairing of these bases does not occur at random. Ade-nine always pair with thymine, and guaAde-nine with cytosine. The nucleotides that make up one strand are covalently linked together through the sugars and phosphates. It is the way that these nucleotides are linked that gives the DNA strand its polarity, indicated by referring to one end as the 3’ end(the one with the phosphate) and the other as the 5’ end (the one with the sugar). Considering the polarity of each strand, the complementary base-pairing is only possible be-cause the two DNA strands are antiparallel (run in opposite directions) [9].
4
The surface of the double helix contains two grooves of unequal width: the major and minor groove. The major groove is narrow and deep, while the minor groove is wide and shal-low[10]. The structure of DNA is shown in Figure 2.2.Figure 2.1: DNA nucleotides (Adapted from [11]).
Figure 2.2: Molecular structure of DNA: a) DNA double helix, b) partial chemical structure
showing the complementary strands of DNA, and c) major and minor grooves (Adapted from [11]).
5
The DNA structure can be altered when exposed to mutagens, such as ultraviolet (UV) radiation, which may lead to the formation of mutagenic DNA lesions and even cell death. The UV radiation spectrum is divided into different region (Figure 2.3): ultraviolet A-UVA(320-400 nm), ultraviolet B-UVB (280-320 nm), ultraviolet C-UVC (200-280), and vacuum ultravio-let- VUV (200-100 nm). Different wavelengths of UV light have different mutagenic properties [12].
The UVC (200-280 nm) can be considered the most effective in inducing DNA lesions, the reason being that DNA has its peak of light absorption at 260 nm. For this reason, and for being the most energetic radiation, exposure to UVC should cause concern. However UVC is completely absorbed by ozone and oxygen, which prevents it from reaching the Earth’s surface [13].
The major DNA lesions caused by UVC and UVB are pyrimidine dimers, which are caused by direct excitation of the DNA molecule. These dimers can be of two types: the cyclo-butane pyrimidine dimers (CPDs) and pyrimidine (6-4) pyrimidine photoproducts [(6-4)PPs]
(Figure 2.4). However, CPDs account for the majority of mutations induced by UVB
irradia-tion. DNA can also be damaged indirectly by radicals, mainly reactive oxygen species (ROS). Oxidative DNA damage is caused primarily by UVA. Studies have shown that the genotoxicity of UV radiation is due to a great extent to the formation of pyrimidine dimers, and when con-cerning biological effects such as DNA inactivation, oxidative damages may be less significant [12][13].
Cellular processes such as transcription and DNA replication can be affected by pyrimi-dine dimer lesions causing mutations or even cell death. However, DNA has its own repair mechanisms, and in the case of pyrimidine dimer lesions, they are removed by excision repair. UV “signature” mutations are mutations caused by DNA UV-induced lesions, and are in the form of CT and CCTT transitions [14].
Pyrimidine dimers often occur in adjacent thymine, even though they may occur between cytosine and guanine. This is due to the fact that thymine-adenine double bond (T=A) requires less energy to be broken than the cytosine-guanine triple bond (C≡G). Only rarely does the DNA replication and repair processes fail and allow mutation to occur in the DNA. However if
suffi-cient pyrimidine dimers are created, the DNA is unable to replicate. DNA damage, such as
6
Figure 2.3: The ultraviolet portion of the electromagnetic spectrum (Adapted from [14]).
Figure 2.4: Different lesions that occur at adjacent pyrimidine residues when exposed to UV
7
2.2
Photodynamic Therapy (PDT)
Photodynamic therapy is a therapeutic method used to treat different types of cancer and other pathologies. Depending on the location and stage of the disease, PDT may present many advantages when compared to other interventions, such as surgery and radiotherapy: it can be targeted accurately, repeated doses can be given without the total-dose limitations associated with radiotherapy, and the healing process results in little or no scarring [16].
In PDT a light source, oxygen, and photosensitizers are combined to induce damage in the selected tissue. The idea that this combination could produce cellular damage was discov-ered accidentally by a medical student, Oscar Raab, who observed that the presence of the pho-tosensitizer acridine orange and light together had a toxic effect on Paramecium caudatum cells
[6].
PDT is based on the administration of a non-toxic dye (photosensitizer) to a specific le-sion, either systemically, locally, or topically, which is then exposed to a light source, in the presence of oxygen. Only cells targeted by the photosensitizer are destroyed, which makes PDT a specific and selective treatment. The presence of molecular oxygen plays a key factor in the success of PDT, because when the photosensitizer is activated by light, reactive oxygen species (ROS) are generated, which lead to a series of oxidative events that result in cellular destruction [17].
When the photosensitizer is exposed to light, it is activated from a ground state to an ex-cited state. Cell killing can be induced in two ways, as the photosensitizer returns to its ground state (Figure 2.6). It can react directly with a substrate such as the cell membrane or a molecule,
and produce radicals, which may further react with oxygen to produce ROS (Type I reaction). Alternatively the photosensitizer can transfer its energy directly to oxygen to form singlet oxy-gen (Type II reaction). In PDT, type II reactions are thought to occur more frequently [6].
Singlet oxygen (1O2) is very reactive and also has a short half-life, which means that only
8
Figure 2.5: Schema of a photochemical reaction during a photodynamic therapy
(Adapted from [6]).
2.3
Intercalators
Understanding the mechanisms of interaction between drug molecules and DNA, is a crucial step to develop DNA-targeted drugs that can interfere in cell functions such as transcrip-tion and replicatranscrip-tion. Anti-cancer drugs specifically may interact with DNA through control of transcription factors and polymerases, through RNA binding to DNA double helix to form nu-cleic acid triple helix structures or RNA hybridization to exposed DNA single strand forming DNA-RNA hybrids that may interfere with transcriptional activity, and through binding of small aromatic ligand molecules to DNA double helical structure. Drug-DNA binding may oc-cur covalently or non-covalently. The covalent binding of a drug molecule to DNA is irreversi-ble and leads to an inhibition of the DNA processes resulting in cell death. On the other hand non-covalent drug-DNA interaction is reversible and less cytotoxic when compared to covalent binding. Nevertheless, non-covalent interacting agents may cause significant DNA conforma-tional changes that may result in a hindered or suppressed function of DNA [19].
Small molecules may bind non-covalently to DNA by two common binding modes; in-tercalation and groove-binding (Figure 2.5). Groove-binders are usually narrow curved shaped
and fit into the DNA minor groove by van der Walls interaction and hydrogen bonding, with little distortion of the DNA structure [3].
9
Figure 2.6: A- Generic intercalation representation; B-Schematic representation of a general
intercalating agent; C-Groove binding representation (Adapted from [3]).
Upon insertion of the intercalator, DNA unfolds in order for the intercalator to fit be-tween the base pairs. The unwinding of the double strand results in distortions on the DNA structure, such as, lengthening or twisting of the base pairs of the DNA strand. DNA structural changes caused by intercalators, make them potent mutagens, since these changes may lead to functional alterations like the inhibition of transcription and replication, and DNA repair pro-cesses [3][21].
Unlike many chemotherapeutic drugs, intercalators do not bind covalently to the purine and pyrimidine bases. Consequently they can be used as photosensitizers- molecules that are activated by light- targeting only tumorous cells, while preserving the normal cells from their toxic effect[22].
Since the studies of Lerman, who reported the intercalation process through the binding of acridines to DNA, other organic intercalators have been reported. Even though the number is extensive, all of the organic intercalators have chemical structures that can be divided into six different categories: anthracenes, acridines, anthraquinones, phenanthridines, phenanthrolines, and ellipticines (Figure 2.7) [5].
10
Figure 2.7: Chemical structure of organic intercalators: (1) anthracenes, (2) acridines, (3)
anthraquinones, (4) phenanthridines, (5) phenanthrolines, and (6) ellipticines [5].
In PDT it is important to understand the mechanisms of interaction between the DNA molecule and the intercalator when subjected to radiation. The understanding of these interac-tions is crucial to optimize the destruction of the cancerous cells when exposed to UV radiation in the presence of the intercalator.
Rocha studied the effect of UV radiation on DNA, in the presence of the intercalator methylene blue (MB). The interaction of MB with the isolated DNA bases was also studied in order to comprehend how this intercalator may induce DNA lesions. MB has a protective effect on the DNA, prolonging the time necessary for its degradation when exposed to UV radiation. Regarding the bases, MB had a protective effect on adenine and thymine, but on the other hand it increased the degradation of cytosine and guanine [7].
11
3
Materials and Methods
3.1
Materials
3.1.1
Deoxyribonucleic acid sodium salt from calf thymus (DNA)
The DNA purchased from Sigma-Aldrich (CAS 73049-39-5), is prepared from calf thy-mus tissue. It contains both single and double stranded forms of DNA, but the predominant form is the double stranded form. The molecular structure of DNA is shown in Figure 2.2.
DNA in the form of sodium salt has a sodium ion as a counterion which facilitates its dis-solution in water, making it possible to prepare aqueous DNA dis-solution.
3.1.2
1,10-Phenanthroline (Phen)
1,10-Phenanthroline, obtained from Alfa Aesar (CAS 66-71-7 ) is a heterocyclic organic compound that has the appearance of a white solid at room temperature, and a molecular weight of 180.21 g/mol. It can be used as a ligand in coordination chemistry [23]. The molecular struc-ture of Phenanthroline- empirical formula C12H8N2- is represented in Figure 3.1.
Figure 3.1: 1,10- Phenanthroline (Adapted from [24]).
12
3.2
Sample Preparation
3.2.1
Solutions
Aqueous solutions were prepared by dissolving the solute in ultra-pure water, using a Millipore system, which produces standard water of the type Mili-Q, with a resistivity of 18.2 MΩ.cm, at a temperature of 25 ºC.
An aqueous solution of 1,10- Phenanthroline (Phen)- CAS 66-71-7- was prepared by dis-solving Phen in ultra-pure water to a concentration of 2 x 10⁻⁵ M. Similarly, an aqueous solution
of deoxyribonucleic acid sodium salt from calf thymus (DNA)- CAS 73049-39-5- was prepared by dissolving DNA in ultra-pure water to a concentration of 0.025 mg/mL.
The prepared solutions of DNA, Phen, and [1:1](v/v) DNA+Phen were irradiated in sealed quartz cuvettes, and characterized by UV-Vis spectroscopy. Since water was the solvent used to prepare the solutions, a quartz cuvette with water was used as reference.
3.2.2
Washing and storage of the substrates
Calcium fluoride (CaF2) substrates were used to produce cast films since calcium fluoride
is transparent to infrared in the region of 4000 cm-1 to 600 cm-1. The following steps were taken
in order to ensure that the substrates were properly cleaned:
Wash with common soap;
Wash with a solution of methanol/acetone/chloroform to remove any trace mate-rial previously deposited onto the CaF2 substrates;
Immersion in a solution of H2SO4:H2O2 in a 1:1 proportion. This solution is
called a piranha solution because it cleanses any residue of organic material off the substrates, and will also hydrolyze their surfaces;
Warning: Proper safety measurements should be taken when handling and pre-paring the piranha solution which is very corrosive and results in an exothermic reaction. The solution should be prepared in a hotte, and allowed to cool before the immersion of the substrates, to avoid possible fragmentation.
Wash with ultra-pure water;
13
3.2.3
Preparation of cast films
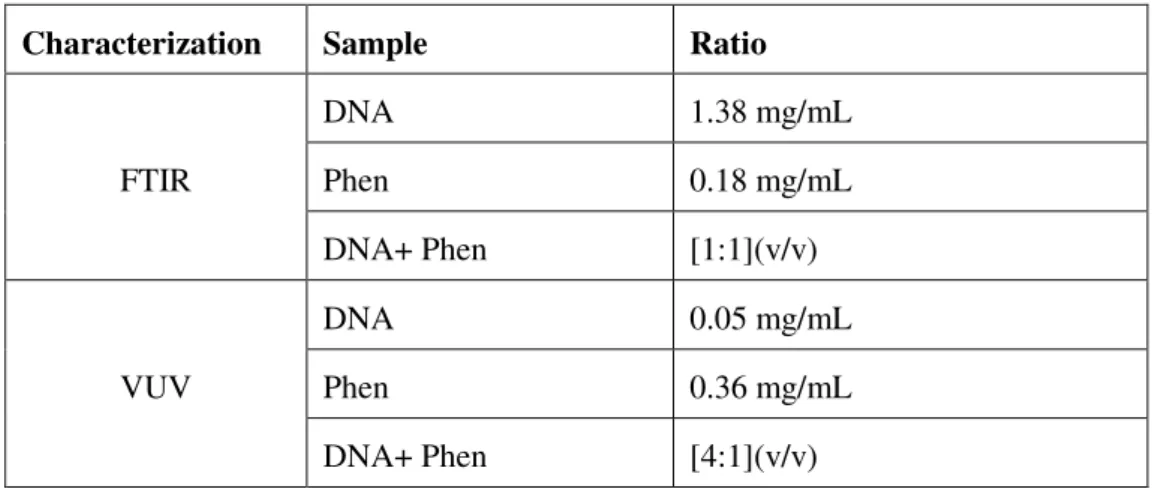
Cast films with different solutions were prepared in order to be characterized by vacuum ultraviolet (VUV) and Fourier Transform Infrared (FTIR) spectroscopy. Table 3.1 lists the
aqueous solutions that were used in the preparation of the cast films.
The solutions were deposited onto calcium fluoride substrates with the help of a pipette making sure that the dispensed amount of solution was properly distributed onto the substrate. The substrates were then left to dry in a desiccator for a period of 24h, so that the solvent could evaporate.
The cast films that were characterized by FTIR were irradiated in the presence of water, by having a recipient with water inside the UV radiation chamber increasing its moisture. The samples were characterized before and after each exposure to UV radiation.
Table 3.1: Solutions used for the preparation of cast films
Characterization Sample Ratio
FTIR
DNA 1.38 mg/mL
Phen 0.18 mg/mL
DNA+ Phen [1:1](v/v)
VUV
DNA 0.05 mg/mL
Phen 0.36 mg/mL
DNA+ Phen [4:1](v/v)
3.3
Irradiation Source
To study the effect of radiation on the prepared solutions of DNA and the intercalator 1,10- Phenanthroline, an ultraviolet system was used. The system is composed by a UVC ger-micidal lamp (Philips TUV PL-S 5W/2P 1CT). This low pressure mercury discharge lamp of
14
The system possesses a ventilation chamber for ozone removal, and a security system which only allows the lamp to be on if the door is closed. This ensures the security of the user who is not exposed to UVC radiation since the germicidal effect of UVC radiation can cause temporarily conjunctivitis (inflammation of the mucous membrane of the eye) and erythema (redness of the skin). Proper caution should be taken while handling the equipment, like the use of appropriate gloves and googles. The system also encompasses an adjustable sample holder allowing to vary the distance between the sample and the light source, and thus adjust the irra-diance to which the sample is exposed [26].The scheme of the system is shown in Figure 3.2.
Figure 3.2: Scheme of the ultraviolet system. (Adapted from [26]).
When matter is exposed to UV radiation it is subjected to a dose of radiation, D (W.s/m2),
which corresponds to a radiant flux (Irradiance), I, multiplied by the exposure time, t (s), as shown in equation 3.1:
15
Since irradiance can be defined as the radiant flux (power) received by a surface per unit area, it is expressed in W/m2. Geometrically as shown in Figure 3.3, the irradiance in a point“P” on a small surface, at a distance “a” from an ideal linear radiation source AB of length “l” is given by equation 3.2:
(3.2)
Where φ is the total radiation flux (W), and α is given in radian (rad) by equation 3.3:
(3.3)
Figure 3.3: Mathematical description of irradiance for an ideal linear radiation source.
For the irradiations that were done in the course of this project, the distance from the source to the samples was 14 cm, with an irradiance of approximately 8 W/m2.
3.4
Characterization Techniques
3.4.1
Ultraviolet-visible (UV-Vis) and Vacuum Ultraviolet (VUV)
spectros-copy
16
The electrons involved in simple chemical bonds are designated as σ electrons, while the ones involved in double bonds are called π electrons. In molecules where double bonds are pre-sent, π electrons predominate and determine the energy states of the valence electrons. The v a-lence electrons are excited by the absorption of UV or visible radiation. Non-bonding electrons are designated as n electrons [29].The spectroscopy characterization technique is based on different electronic transitions that are responsible for the spectrum. The peaks observed in the obtained spectrum (absorbance versus wavelength) are centered in the wavelength that corresponds to the necessary energy for the electronic transition to occur. The intensity of the peaks depends on the energy of the mo-lecular orbital and also on the quantic efficiency of the transitions. It is also possible to identify wavelength deviations of the observed peaks to greater or smaller wavelength (bathochromic effect and hypochromic effect respectively) [30].
The electronic transitions can be classified into three different groups, the first one being the one that encompasses transitions from an orbital in its ground state to another one of higher energy, transitions 𝜋→𝜋*, and transitions 𝜎→𝜎*. The second group corresponds to the transi-tions that occur from a non-bonding atomic orbital to a molecular orbital of higher energy, n→𝜋* and n→𝜎*. The third group includes transitions from an orbital in its ground state to a Rydberg orbital (higher energy states that converge on an ionic state with an ionization energy) [7]. These transitions and their correspondent region of occurrence in the electromagnetic spec-trum are presented in Table 3.2.
Transitions in the vacuum ultraviolet (wavelengths below 200 nm) are mainly due to 𝜎→𝜎* and to n→𝜎* (Figure 3.4). In order to obtain a VUV spectrum, the whole optical path of
the spectrometer has to be kept under vacuum [31].
Table 3.2: Electronic transitions associated with regions of the electromagnetic spectrum
Transitions Region of the electromagnetic spectrum
𝜎→𝜎* Vacuum Ultraviolet
𝜋→𝜋* Ultraviolet
n→𝜋* Near Ultraviolet
n→𝜎* Far Ultraviolet
17
Figure 3.4: Schematic representation of the transitions for each region of the electromagnetic
spectrum (Adapted from [31]).
UV-Vis spectrophotometers usually contain two light sources: a UV lamp, which emits light in the UV region and a tungsten–halogen lamp for the visible region. After passing through a monochromator (or through optical filters) the light is focused into the cuvette and the amount of light that passes through the sample is detected by a photomultiplier or a photodiode. In double-beam instruments a cuvette with buffer is placed in the reference beam, and its absorb-ance is subtracted from the absorbabsorb-ance measured for the sample. A schematic diagram of a dou-ble-beam spectrophotometer is shown in Figure 3.5.
18
Solutions of DNA, 1,10-phenanthroline (Phen), and DNA+Phen, were analyzed by UV-Visible spectroscopy, in sealed quartz cuvettes. The spectra were obtained in the interval of wavelength from 200 nm to 600 nm using the Shimadzu UV-2101PC spectrophotometer.The VUV spectra presented in this work were recorded at the ultraviolet beam line (UV1)
(Figure 3.6) in the Synchrotron Radiation facility ASTRID at Aarhus University, Denmark.The
setup consists of a sample vacuum chamber containing up to three CaF2 sample disks and one
reference disk mounted on a MDCSBLM-266-4 push-pull linear motion. The VUV beam light passed through the disks and the transmitted intensity was measured at 1.0 nm intervals using a photomultiplier detector (Electron Tubes Ltd., UK). The transmitted light intensity and the syn-chrotron beam ring current were measured at each wavelength, with a typical resolution better than 0.08 nm. The sample chamber has a LiF entrance window and a MgF2 exit window in front of the photomultiplier. The minimum wavelength is determined by the CaF2 substrates so that the lowest wavelength at which reliable data could be collected was ∼ 125 nm.In order to avoid absorption from molecular oxygen in air for wavelengths below 190 nm, the small gap between the sample chamber exit window and the photo multiplier detector was flushed with He gas. To calculate the absorbance, the light intensity spectrum of the CaF2 disc was measured
before and after measuring the spectrum of the cast film. The average of those two spectra and the spectrum of cast film were used to calculate the absorbance using the Beer-Lambert equa-tion. [33].
19
3.4.2
Fourier Transform Infrared (FTIR) Spectroscopy
Fourier Transform Infrared (FTIR) is one method of infrared spectroscopy. The FTIR spectrum is obtained in a form of an interferogram which is a plot of the sums of the cosine waves of all the frequencies present in the source of infrared radiation as modified by passage through the sample. These signals are then stored in a computer that carries out Fourier trans-formations on them, corrects for the frequencies generated by the source of the infrared radia-tion, and plots the FTIR spectrum [35]. A diagram of a typical FTIR spectrophotometer is shown in Figure 3.7.
Figure 3.7: Diagram of a FTIR spectrophotometer (Adapted from [36]).
When using infrared (IR) spectroscopy to study a sample, IR radiation passes through, some of which is absorbed by the sample and some of which passes through (is transmitted). Considering that each molecule has its own way of absorbing and transmitting radiation, the resulting spectrum can be considered a molecular fingerprint. Therefore FTIR can be used to determine the identity of unknown materials in a sample, to determine the amounts of compo-nents in a mixture, as well as the consistency of a sample [37].
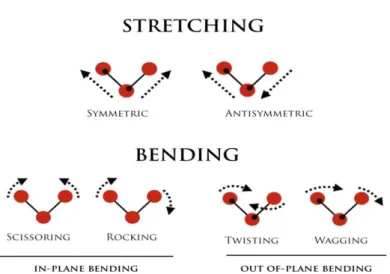
The chemical bonds in a molecule are constantly being distorted because of the motion of its atoms. These motions, designated as molecular vibrations, can be of two types [35]:
Stretching: there is variability in bond length; it can be either symmetric or antisymmet-ric.
Bending: there is variability in bond angle, it can lead to four different types of vibra-tional modes; scissoring, rocking, twisting, and wagging.
20
Figure 3.8: Vibrational modes of molecules.
21
4
Characterization by VUV spectroscopy
The characterization of the DNA lesions caused by UV radiation in the presence of 1,10-phenanthroline (Phen) is presented in this chapter. The characterization was obtained by
vacu-um ultraviolet (VUV) spectroscopy of cast films prepared with aqueous solutions of DNA, Phen, and DNA+Phen. The software OriginPro 9.0, was used for graphing and analyzing the
obtained data.
4.1
Characterization of the solutions of DNA, and
1,10-phenanthroline
VUV absorption measurements were made in order to characterize the interaction be-tween DNA and the intercalator 1,10-phenantthroline. The obtained spectra were adapted by Gaussian curves with the aim of improving the characterization of the obtained peaks.
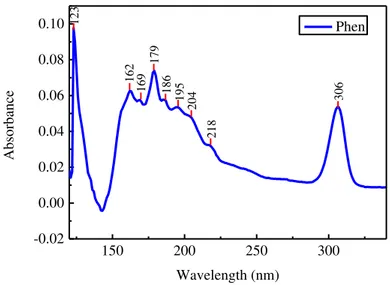
Figures 4.1 depicts the VUV absorption spectrum of 1,10-phenanthroline. In order to
at-tribute the electronic transitions to the respective band, an extensive research of the known con-stituents of Phen was made, namely pyrimidine and benzene. This information is listed in Table 4.1.
22
150 200 250 300
-0.02 0.00 0.02 0.04 0.06 0.08 0.10 306 218 204 195 186 179 169 162 Ab sorbance Wavelength (nm) Phen 123
Figure 4.1: VUV absorption spectrum of 1,10-phenanthroline.
Table 4.1: Peak parameters for VUV data of Phen.
Peak position (nm)/(eV)
Electronic Transition
Structure Functional Group
162/7.65 - Pyridine [38]
169/7.34 - Benzene Band 1E1u (7.0 eV)
[39]
179/6.93 𝜋→𝜋∗ Pyridine [38]
186/6.67 𝜋→𝜋∗ Pyridine [38]
195/6.35 𝜋→𝜋∗ Benzene Band 1B
1u (6.2eV)
[38]
205/6.08 𝜋→𝜋∗ Pyridine [38]
218/5.89 n→𝜋∗ Pyridine (1A
2) [38]
306/4.05 -
23
4.2
The effect of UV radiation
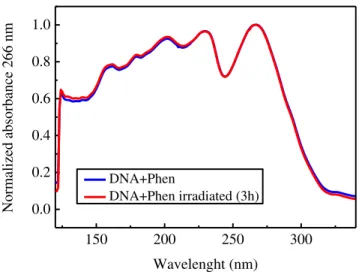
The prepared cast films were irradiated at a fixed wavelength (140 nm) for three hours under vacuum, in order to study the effect of UV radiation on the degradation of the molecules. The obtained spectra before and after irradiation, are shown in Figure 4.2 for
DNA+1,10-phenanthroline.
150 200 250 300
0.0 0.2 0.4 0.6
Abso
rb
ance
Wavelenght (nm) DNA+Phen
DNA+Phen irradided (3h)
Figure 4.2: VUV absorption spectra of cast films of DNA+Phen, before and after being
irra-diated for a period of 3 hours.
150 200 250 300
0.0 0.2 0.4 0.6 0.8 1.0
Normalized a
bs
or
bance
26
6 n
m
Wavelenght (nm) DNA+Phen
DNA+Phen irradiated (3h)
Figure 4.3: VUV normalized absorption spectra of cast films of DNA+Phen, before and after
24
Considering Figure 4.1 we can observe that there is little change in the spectrumob-tained after irradiation. The difference between the two spectra, obob-tained before and after irradi-ation, becomes less significant when the absorption spectra are normalized to the peak at 266
nm (Figure 4.2).These results corroborate the results of Gomes [40], that show that in the
ab-sence of water the samples are not affected by the exposure to UV radiation. Therefore, VUV characterization is a useful technique to characterize the materials, but we will have to resort to other characterization techniques in order to study the effect of UV radiation on DNA in the presence of the intercalator.
4.3
Conclusions
Cast films of 1,10-phenanthroline, and DNA+1,10-phenanthroline, were characterized by VUV spectroscopy, and the electronic transitions were assigned for each band present in the obtained spectra.
25
5
Effect of UV radiation- characterization
by UV-Vis
The characterization of the DNA lesions caused by UV radiation in the presence of
1,10-phenanthroline, is presented in this chapter. The characterization was obtained by UV
ab-sorption spectroscopy of aqueous solutions of DNA, 1,10-phenanthroline, and DNA + 1,10-phenanthroline. The software OriginPro 9.0, was used for graphing and analyzing the obtained
data.
5.1
Calculation of the absorption coefficient
The absorption coefficient can be determined using Lambert-Beer’s law (Equation 5.1),
which relates the attenuation of light to the properties of the material through which the light is traveling.
(5.1)
where A, the absorbance, is defined by the incident intensity I0, and the transmitted
inten-sity I.
Considering that the absorbance is directly proportional to the concentration of the solu-tion of the sample, and that it is also directly proporsolu-tional to the length of the light path (d) which is equal to the width of the cuvette
(5.2)
where Abs is absorbance at a specific wavelength, ε is the absorption coefficient, d is the thick-ness of the cuvette, and C is the concentration of the solution. Once the absorption coefficient is
26
known, the expected absorbance value for a known concentration can be calculated using equa-tion 5.1.In order to calculate the absorption coefficient of 1,10-phenanthroline (Phen), solutions with different concentrations were prepared from an inicial solution of Phen with a concentration of 20 µM. Figure 5.1 shows the UV-Vis absorbance spectra obtained.
Since Phen has two characteristic bands, one at 229 nm, and one at 262 nm aproximately, the values of absorbance at these wavelengths are represented grafically as a function of concentration in Figure 5.2. The wavelength of 260 nm was also considered since DNA absorbs
at this wavelength.
200 220 240 260 280 300 320
0.0 0.2 0.4 0.6 0.8 1.0 Absorbance Wavelength (nm) 5uM 7.5uM 10uM 15uM 20uM
Figure 5.1: UV-Vis absorbance spectra of aqueous solutions of Phen with different
concen-trations.
0.0 5.0x10⁻⁶ 1.0x10⁻⁵ 1.5x10⁻⁵ 2.0x10⁻⁵
0.0 0.2 0.4 0.6 0.8 1.0 229 nm 262 nm 260 nm
Linear fit of absorbance at 260 nm Linear fit of absorbance at 262 nm Linear fit of absorbance at 220 nm
Abso
rb
ance
Concentration (M)
Figure 5.2: Representation of absorbance at different wavelengths as a function of
27
The absorption coefficients were calculated from the slopes obtained from the straight lines which can be put in the form of equation 1, since the thickness of the cuvette is 1 cm. The re-sults for the molar attenuation coefficient at different wavelengths are shown in Table 5.1.Table 5.1: Parameters obtained from the linear fit of absorbance at 229 nm, and 262 nm, where ε is
the absorption coefficient of Phen, and R is the correlation coefficient.
Wavelength (nm) Slope (dm3/mol)
ε (m2/mol) Slope (dm3/g)
ε (m2
/g) R
229 40000±2000 4000±200 240±14 24±1.4 0.99545
262 28000±1000 2800±100 160±8 16±0.8 0.99705
Coelho [41], studied the molar attenuation coefficients for the characteristic peaks of DNA (Table 5.2).
Table 5.2: Absorption coefficient of DNA [41].
Wavelength (nm) Slope (dm3/g)
ε (m2/g) R
230 6,6 ± 0,3 0.66 0,98706
260
280
15,4 ± 0,8
8,5 ± 0,5
0.154
0.85
0,97767
0,96938
5.2
Characterization of the solutions of DNA and
1,10-phenanthroline
In order to study the interaction between DNA and 1,10-phenanthroline (Phen), firstly
the UV-Visible absorption spectra of DNA, Phen, and [1:1](v/v) DNA+Phen were obtained as shown in Figures 5.3 a), b) and c) respectively. The obtained spectra were adapted by Gaussian
28
200 220 240 260 280 300 320 0.0 0.2 0.4 0.6 0.8 DNA Fit Peak 1 Fit Peak 2 Fit Peak 3 Cumulative Fit Peak
Abso
rb
ance
Wavelength (nm)
a)
200 220 240 260 280 300 320 340 0.0 0.2 0.4 0.6 0.8 Abso rb ance Wavelength (nm) Phen Fit Peak 1 Fit Peak 2 Fit Peak 3 Fit Peak 4 Fit Peak 5 Fit Peak 6 Cumulative Fit Peak
b)
200 220 240 260 280 300 320 0.0 0.2 0.4 0.6 Absorbance Wavelength (nm) Dna+Phen Fit Peak 1 Fit Peak 2 Fit Peak 3 Cumulative Fit Peak
c)
Figure 5.3: UV-Vis absorption spectra of a) DNA, b) 1,10-phenanthroline and c) [1:1](v/v)
29
Figure 5.3 a) represents the absorption spectrum in the UV/Vis region of an aqueous
so-lution of DNA with a concentration of 0,025 mg/mL. There are two characteristic bands that can be identified in the spectrum of the DNA solution, one at 260 nm, and another at 200 nm approximately. The absorption band at 260 nm is, according to literature, attributed to all the
DNA bases [42].
The band that is centered at 200 nm can be attributed to the adenine band at 207 nm, or could also be related to the electronic transitions of guanine from 𝑛→𝜋∗ (209 nm), and of thymine from 𝜋→𝜋∗ (208 nm). The band at 280 nm is associated with 𝜋→𝜋∗ transitions of the DNA [43][44].
The bands and their respective transitions are represented in Table 5.3. The spectrum
peak structure was obtained by fitting the experimental UV-Vis sprectum with a set of Gaussians.
Table 5.3: Peak parameters obtained from fitting the UV-Vis spectra of DNA and
1,10-phenantroline.
Peak parameters for UV-Vis data of DNA solution
Peak position (nm) FWHM (nm) Assignment
200.26±0.04 35.27±0.09 𝑛→𝜋∗ guanine [43]
𝜋→𝜋∗ thymine [43]
257.8±0.1 34.7±0.2 All bases [42]
280.9±0.1 27.2±0.2 𝜋→𝜋∗ [8]
Peak parameters for UV-Vis data of Phen solution
Peak position (nm) FWHM (nm) Assignment
195±1 27±2 𝜋→𝜋∗ [45]
224.39±0.09 15.7±2 𝜋→𝜋∗ [45]
230.60±0.04 6.4±0.1 𝜋→𝜋∗ [46]
264.71±0.05 23.8±0,3 𝜋→𝜋∗ [46]
265±1 69±3 𝜋→𝜋∗ [45]
30
The absorbance spectrum of a 1,10-phenanthroline aqueous solution is shown in Figure5.3 b). The spectrum presents two main bands, one at 231 nm, and another at 264 nm
aproximetly. The results are in agreement with the literature which defines two absorbance maxima, one at 229 nm, and one at 262 nm. These absorption bands are assigned to 𝜋→𝜋∗ transitions of the aromatic ring of 1,10-phenanthroline [46]. The spectrum was devonvoluted into a set of Gaussians in order to obtain more information of each band, which is listed in
Table 5.3.
5.3
The effect of UV radiation
In order to study the effect of UV radiation, aqueous solutions of DNA, Phen and [1:1](v/v) DNA+Phen were irradiated for different time periods. Figures 5.4 a), b) and c)
repre-sent the absorption spectra obtained before and after each irradiation period for DNA, Phen, and [1:1](v/v) DNA+Phen respectively.
As the irradiation time increases there is an apparent increase of absorbance, which is due to an increase in the baseline absorption. These changes in the baseline upon fragmentation might be indicative of fragmentation [44].
From an analysis of the absorbance spectra is possible to observe the hypochromic ef-fect on the three solutions as the irradiation time period increases. There is a decrease in the in-tensity of absorbance, which indicating that the molecules in the solutions degrade as the expo-sure to UV radiation increases. Therefore, we can conclude that UV radiation is able to degrade both molecules, DNA and Phen.
200 220 240 260 280 300 320
31
200 220 240 260 280 300 320
0.0 0.2 0.4 0.6 0.8 0 min 5 min 15 min 30 min 50 min 80 min 140 min 260 min 440 min Abso rb ance Wavelength (nm) b)
200 220 240 260 280 300 320
0.0 0.2 0.4 0.6 0.8
1.0 0 min
5 min 15 min 30 min 50 min 80 min 140 min 260 min 440 min Abso rb ance Wavelength (nm) c)
Figures 5.4: Absorbance spectra of a) DNA, b) 1,10-phenanthroline and c)
[1:1](v/v)DNA+1,10-phenanthroline, as the time of exposure to UV radiation increases.
In order to analyze the damage caused by UV radiation the characteristic band of DNA, at 260 nm, which is associated with the nitrogenous bases of DNA, was studied. Figure 5.5
32
0 100 200 300 400 500
0.0 0.2 0.4 0.6 0.8
1.0 DNA DNA+Phen
Phen
ExpDec1 Fit of Phen ExpDec1 Fit of DNA ExpDec1 Fit of DNA+Phen
Normalized a
bs
or
bance
26
0 n
m
Exposure time (min)
Figure 5.5: Evolution of the normalized absorbance of the band at 260 nm, as the exposure
to UV radiation increases for the three different solutions od DNA, Phen, and [1:1](v/v)
DNA+Phen.
The exponential time constants for each of the solutions are obtained by doing an expo-nential fit to the results presented in Figures 5.4, in order to analyze the decay for the band at
260 nm. Table 5.4 shows the data obtained from the fitting.
Table 5.4: Exponential time constant obtained from an exponential fit to the experimental
results of the spectra at 260 nm.
Τ260 nm (min)
DNA 140±30
DNA+Phen 180±80
Phen 37±2
Analyzing the results listed in Table 5.4, we can observe that the DNA solution decays
33
The characteristic bands of Phen (Figure 5.4 b)) goes through a much accentuatedde-crease in absorbance at 230 nm, and 264 nm, which indicates that UV radiation has a significant effect on the degradation of this molecule. It is also possible to observe the bathochromic shift
on Figure 5.4 c) which confirms the intercalation between DNA and Phen.
In order to analyze the process of degradation of DNA, Phen, and DNA+Phen, some calculations were made, and the results are presented in Table 5.5 and 5.6. From these results it
is possible to observe that the expected absorbance for the three solutions has approximately the same value as the obtained absorbance, after being irradiated for 30 minutes. This information shows us that these processes of degradation are independent of one another, meaning that what happens in one molecule does not affect what happens in the other molecule.
Table 5.5: Calculations of Abs260 taking into account the initial concentration of the samples.
Solutions DNA
concentration (mg/mL) Expected DNA Abs260 [41] Phen concentration (M) Expected Phen Abs260a
Expected
Abs260
Obtained Abs260
DNA 0.025 0.385 0 0 0.385 0,485
Phen 0 0 2*10-5 0.53606 0.53606 0,4919
DNA+Phen 0.0125 0.1925 1*10-5 0.26803 0.46053 0.4254
aFrom Figure 5.2
Table 5.6: Abs260 after being irradiated for 30 minutes.
Solutions Abs260 (t= 0 mn) Calculated Abs260
(t= 30 mn)a
Obtained Abs260
(t= 30 mn)
DNA 1 0.8937 0.8688
Phen 1 0.6537 0.6419
DNA+Phen 1 0.8977 0.8977
34
5.4
Conclusions
35
6
Effect of UV radiation- c
haracterization
by FTIR
In this chapter the damage caused by UV radiation on DNA in the presence of the inter-calator 1,10-phenanthroline, is characterized by Fourier transform infrared spectroscopy (FTIR). Cast films were prepared with solutions of DNA, Phen, and DNA+Phen, which were irradiated for different time intervals. The software OriginPro 9.0, was used for graphing and analyzing
the obtained data.
6.1
Characterization of DNA and Phen
Cast films of the solutions of DNA, and DNA+Phen, were characterized by FTIR.
Figures 6.1 a) and b) represent the obtained absorbance spectra for DNA, Phen and
DNA+Phen respectively, from 900 to 1800 cm-1.
The main components of DNA, namely, sugars, bases and phosphates, can be identified
in Figure 6.1 a). Tables 6.1 and 6.2 list the spectral assignments of DNA and Phen
respective-ly.
36
1000 1200 1400 1600 1800
0.0 0.1
0.2 DNA
Abso
rb
ance
Wavenumber (cm-1)
a)
1000 1200 1400 1600 1800
0.00 0.04 0.08 0.12 0.16
Abso
rb
ance
Wavenumber (cm-1)
DNA+Phen
b)
37
Table 6.1: Characteristic infrared absorptions in DNA cast films [47].
Wavenumber (cm-1)
Literature wavenumber (cm-1)
Assignment
965 950-970 CC stretch of the backbone
1015 1010-1020 Furanose Vibrations
1055 1044-1069 CO stretch of the furanose backbone
1087 1085-1090 Symmetric PO2- stretching of the backbone
1232 1235-1245 Antisymmetric PO2-stretch in A-form
1280 1281
1275
C5=C6 vibration of cytidine
CN3H bend of deoxyribose thymine
1295 1285-1297 C4-NH2 strength of cytosine
1393 1374-1389
1369-1381
CH3 Symmetric deformation of deoxyribose thymine
Cytidine and guanosine in anti-conformation
1575 1575-1590 C=N ring vibration of Guanine single stranded or double stranded
1604 1601 C=N ring vibration of guanine
1657 1655-1657 C2=O2 strength of cytosine single stranded or double stranded
1701 1691-1698 C2=O2 strength of thymine single stranded or double stranded
1716 1712
1715
Stretching of thymines involved in reverse Hoogsteen third strand binding.
38
Table 6.2: Characteristic infrared absorptions in Phen cast films and their assignment [48][49][50].
Wavenumber (cm-1) Assignment
854 Benzene ring bending
988 Ring breathing
1092 CCC bending in-plane
1139 CCC bending in-lane and HCC bending in-plane
1217 HCC bending in-plane
1344 CN stretching, CC stretching, and HCC bending in-plane
1421 CC stretching, and HCC bending in-plane
1505 HCC bending in-plane
1588 CC stretching, and HCC bending in-plane
1643 CC stretching
6.2
Characterization of the effect of UV radiation
The evolution of the infrared absorption spectra of DNA, and [1:1](v/v) DNA+Phen is represented in Figures 6.2 a), and b) respectively, from 900 to 1800 cm-1. The cast films were
39
1000 1200 1400 1600 1800
0.00 0.05 0.10 0.15 0.20 0.25
Abso
rb
ance
Wavenumber (cm-1)
DNA DNA-22h DNA-46h DNA-72h DNA-142h
a)
1000 1200 1400 1600 1800
0.00 0.05 0.10 0.15
Abso
rb
ance
Wavenumber
(
cm-1)
DNA+Phen DNA+Phen-22h DNA+Phen-46h DNA+Phen-72h DNA+Phen-142h
b)
Figure 6.2: Infrared absorbance spectra of a) DNA and b) DNA+Phen cast samples exposed
to different intervals of irradiation.
In order to analyze the obtained results, the baseline was subtracted from the spectra. To simplify the analysis, the spectra were divided into different regions, from 900 to 1400 cm-1 and
40
The evolution of the infrared absorbance spectra of DNA and [1:1](v/v) DNA+Phen, in the first interval, from 900 to 1400 cm-1, is represented in Figures 6.3 a) and b) respectively.1000 1200 1400
0.00 0.05 0.10 0.15 0.20 0.25
Absorbance
Wavenumber (cm-1)
DNA DNA-22h DNA-46h DNA-72h DNA-142h
a)
1000 1200 1400
0.00 0.05 0.10
Absorbance
Wavenumber (cm-1)
DNA+Phen DNA+Phen-22h DNA+Phen-46h DNA+Phen-72h DNA+Phen-142h
b)
Figure 6.3: Infrared absorbance spectra, , from 900 cm-1 to 1400 cm-1 of a) DNA and b)
DNA+Phen cast samples exposed to UV radiation for different periods of time.
Figures 6.3 a) and b) show that the damage caused on the DNA molecule, occurs at the
41
Figures 6.4 a) and b) represent the evolution of the peak at 965 cm-1 for DNA and
[1:1](v/v) DNA+Phen respectively. These figures show that the absorbance decreases as the time that the cast film is exposed to UV radiation increases. Since the peak at 965 cm-1, is
iden-tified in the literature as being associated with the CC stretch of the backbone [44], and there-fore related to the vibration of the sugar ring, it can be concluded that the wavelength of 254 nm is enough to break the sugar ring.
940 950 960 970 980 990
-0.02 0.00 0.02 0.04 0.06 0.08 0.10 Abso rb ance Wavenumber (cm-1) DNA DNA-22h DNA-46h DNA-72h DNA-142h a)
940 950 960 970 980 990
0.00 0.02 0.04 0.06 Abso rb ance
Wavenumber
(
cm-1)
DNA+Phen DNA+Phen-22h DNA+Phen-46h DNA+Phen-72h DNA+Phen-142h b)
Figure 6.4: Evolution of the peak at 965 cm-1, of the infrared absorbance spectra of
42
The exponential time constants for each of the solutions are obtained by doing an expo-nential fit (Figure 6.5) to the results presented in Figures 6.4 a), and b) in order to analyze theevolution of this peak (965 cm-1).
The presence of the intercalator Phen has a protective effect on the degradation of the DNA molecule for this particular peak. The DNA molecule decays in 137±27 hours, while in the presence of Phen the decaying constant is 175±43 hours.
0 30 60 90 120 150
0.5 0.6 0.7 0.8 0.9
1.0 DNA
DNA+Phen ExpDec1 Fit of DNA ExpDec1 Fit of DNA+Phen
Normalizedd absorba
nce 965
cm
-1
Exposure time (hours)
Figure 6.5: Evolution of the peak at 965 cm-1, of the infrared absorbance spectra of DNA and
DNA+Phen cast film as the exposure time to UV radiation increases.
Figures 6.6 a) and b) represent the infrared absorbance spectra of DNA and
DNA+Phen respectively, from 1000 to 1150 cm-1. From Figure 6.6 a) it is possible to observe
that the peak at approximately 1015 cm-1, which is assigned to furanose vibrations, does not go
through a significant absorbance variation as the sample is exposed to UV radiation, which makes it possible to infer that UV radiation does not lead to alterations on this DNA component. However, in the presence of Phen (Figure 6.6 b)) there is a decrease of absorbance as the
irra-diation time increases. Table 6.3 lists the results of an exponential fitting (Figure 6.7) of the
43
1000 1050 1100 1150 0.0
0.1 0.2
Absorbance
Wavenumber (cm-1
) DNA DNA-22h DNA-46h DNA-72h DNA-142h a)
1000 1050 1100 1150
0.00 0.02 0.04 0.06 0.08 0.10 0.12 Abso rb ance
Wavenumber (cm-1)
DNA+Phen DNA+Phen-22h DNA+Phen-46h DNA+Phen-72h DNA+Phen-142h b)
Figure 6.6: Infrared absorbance spectra of a) DNA, and b) DNA+Phen cast films irradiated
for different time periods, from 1000 to 1150 cm-1.
-20 0 20 40 60 80 100 120 140 160 0.7 0.8 0.9 1.0 1.1 DNA DNA+Phen ExpDec1 Fit of DNA ExpDec1 Fit of DNA+Phen
Normalized absorba
nce 1015
cm
-1
Exposure time (hours)
Figure 6.7: Evolution of the peak at 1015 cm-1, of the infrared absorbance spectra of DNA
![Figure 2.1: DNA nucleotides (Adapted from [11]).](https://thumb-eu.123doks.com/thumbv2/123dok_br/16542544.736802/24.892.277.618.244.571/figure-dna-nucleotides-adapted.webp)
![Figure 2.4: Different lesions that occur at adjacent pyrimidine residues when exposed to UV light [15]](https://thumb-eu.123doks.com/thumbv2/123dok_br/16542544.736802/26.892.280.684.522.926/figure-different-lesions-occur-adjacent-pyrimidine-residues-exposed.webp)
![Figure 2.6: A- Generic intercalation representation; B-Schematic representation of a general intercalating agent; C-Groove binding representation (Adapted from [3])](https://thumb-eu.123doks.com/thumbv2/123dok_br/16542544.736802/29.892.276.760.135.440/generic-intercalation-representation-schematic-representation-intercalating-representation-adapted.webp)
![Figure 3.2: Scheme of the ultraviolet system. (Adapted from [26] ).](https://thumb-eu.123doks.com/thumbv2/123dok_br/16542544.736802/34.892.315.645.424.800/figure-scheme-ultraviolet-adapted.webp)
![Figure 3.4: Schematic representation of the transitions for each region of the electromagnetic spectrum (Adapted from [31])](https://thumb-eu.123doks.com/thumbv2/123dok_br/16542544.736802/37.892.197.643.127.393/figure-schematic-representation-transitions-region-electromagnetic-spectrum-adapted.webp)
![Figure 3.7: Diagram of a FTIR spectrophotometer (Adapted from [36]).](https://thumb-eu.123doks.com/thumbv2/123dok_br/16542544.736802/39.892.290.696.377.638/figure-diagram-ftir-spectrophotometer-adapted.webp)