ISSN 0104-6632 Printed in Brazil
www.abeq.org.br/bjche
Vol. 22, No. 04, pp. 557 - 563, October - December, 2005
Brazilian Journal
of Chemical
Engineering
A STUDY ON CLAVULANIC ACID PRODUCTION
BY
Streptomyces clavuligerus
IN BATCH,
FED-BATCH AND CONTINUOUS PROCESSES
A. B. Neto
*, D. B. Hirata, L. C. M. Cassiano Filho, C. Bellão,
A. C. Badino Júnior and C. O. Hokka
Federal University of São Carlos, Department of Chemical Engineering, P. O. Box, 676, Zip Code 13565-905, Rod Washington Luiz 235, São Carlos - SP, Brazil.
E-mail: [email protected]*,
E-mail: [email protected]
(Received: October 20, 2004 ; Accepted: June 7, 2005)
Abstract - Clavulanic acid (CA) is a potent inhibitor of β-lactamases, enzymes that are responsible for the hydrolysis of β-lactam antibiotics. It is a secondary metabolite produced by the filamentous aerobic bacterium Streptomyces clavuligerus in submerged cultivations. In the present work clavulanic acid production in batch, fed-batch and continuous bioreactors was studied with the objective of increasing productivity. The operating conditions: temperature, aeration and agitation, were the same in all cases, 28º C, 0.5 vvm and 800 rpm, respectively. The CA concentration obtained in the fed-batch culture, 404 mg L-1, was ca twice the value obtained in the batch culture, 194 mg L-1, while 293 mg L-1 was obtained in the continuous culture. The highest productivity was obtained in the continuous cultivation, 10.6 mg L-1 h-1, as compared with 8.8 mg L-1 h-1 in the fed-batch process and 3.5 mg L-1h-1 in the batch process, suggesting that continuous culture of Streptomyces clavuligerus is a promising strategy for clavulanic acid production.
Keywords: Clavulanic acid; Bioreactors; Enzymes.
INTRODUCTION
Many pathogenic bacteria produce β-lactamases, enzymes able to catalyze the hydrolysis of molecules containing a β-lactam ring, such as those of penicillins and cephalosporins, thereby blocking their antibacterial property and giving rise to the problem of resistance to antibiotics in the treatment of infectious diseases. Brown et al.(1976), observed that the cell-free broth of Streptomyces clavuligerus
NRRL 3585 (ATCC 27064) inhibited the growth of
Klebsiella aerogenes, a β-lactamase-producing
organism, when cultivated in agar containing benzylpenicillin. Although the chemical structure of the active component obtained from the filtered culture was some what similar to that of cephalosporins and the component had a low level of
antibacterial activity, the mode of action was significantly different. This new substance was designated clavulanic acid (CA) and is a potent inhibitor of β-lactamase.
Currently CA is used together with amoxycillin or ticarcillin, which are β-lactam antibiotics with high levels of antibacterial activity (Baggaley et al., 1997). In Brazil medicines, containing amoxycillin and potassium clavulanate are mainly produced by Glaxo-SmithKline Beecham Farmacêutica laboratories under the name of Clavulin .
Clavulanic acid can be produced industrially from cultivations of several species of Streptomyces, of
which Streptomyces clavuligerus stands out
fermentor at a pilot plant. Several types of bioreactor operation are being applied in the production of secondary metabolite; the fed-batch method is more frequently used due to its higher productivity and easy operation. In the literature several studies report on utilization of fed-batch cultivation to study the fermentation process in antibiotic production. For CA production, the effect of stirring conditions and oxygen transfer (Rosa, 2002) and dissolved oxygen concentration (Yegneswaran et al., 1991) are studied in fed-batch cultivations. Rosa (2002) utilized a medium containing glycerol and malt extract as the source of carbon and Samprosoy 90 NB as the source of nitrogen. Using an air flow rate of 0.5 vvm and 800 rpm the authors, obtained a productivity of 5 mg L-1 h-1, much lower than the value obtained when working with an airflow rate of 0.5 vvm and 1000 rpm (11.5 mg L-1 h-1).
The fed-batch processes may be used to maintain the microorganism in the stationary phase longer as well as to increase the total mass of cells. Mention should be made that the highest rate of production of secondary metabolites is found for the stationary phase. Therefore production is increased, keeping the cultivation in this phase longer.
There are few accounts in the literature of studies on fed-batch processes that address the increase in CA productivity. Mayer and Deckwer (1996) carried out fed-batch experiments for CA production from
Streptomyces clavuligerus DSM 738. The authors
used glycerol as the source of carbon and energy and soy flour or soy flour extract as the main source of nitrogen. In this work, the authors tried to keep the glycerol concentration between 1 and 4 g L-1 by control of the feed flow of rate additional media as a strategy to obtain higher CA productivity. In that way, the authors obtained CA concentrations of 400 to 500 mg L-1 in 90 h cultivations.
In a recent patent, Nabais and Fonseca (2000) proposed CA production by Streptomyces clavuligerus ATCC 27064 in fed-batch cultivation
utilizing a bioreactor with a 8 L capacity and medium containing glycerol or glycerol plus dextrin as the source of carbon and soy flour as the sole source of nitrogen. Different flow rates for addition culture media with different amounts of glycerol or maltose and soy flour were adjusted in order to keep the protein concentration in the broth between 0.4 and 1.5 g L-1 throughout the cultivation. The maximum CA concentration obtained was around 1.6 g L-1; thus higher concentrations could probably be obtained by minimizing the repression effect on the enzyme system related to CA production.
Repression by easily consumed sources of carbon is often described in the literature (Demain, 1971).
Continuous operation is more efficient than batch or fed-batch operation in terms of processing time since dead time, due to charge and discharge operations, bioreactor preparation and sterilization, is avoided. However productivity is often lowered by genetic variations liable to occur when operation continues over a long time. Also, the probability of contamination is much higher than in batch or fed-batch systems.
The only study on continuous cultivation of
Streptomyces clavuligerus reported in the literature is
the work of Kirk et al. (2000). The authors studied the metabolic flux of Streptomyces clavuligerus to
understand the process of clavulanic acid production by this microorganism. For this purpose the authors conducted continuous cultivations with limited sources of carbon, nitrogen and phosphorus and obtained specific productivities of 0, 0.32 and 3.65 mg of CA per g of cells per hour, respectively.
Mention should be made that there are no accounts in the literature aiming at comparing the effects of bioreactor operating conditions on CA production. Therefore, the objective of the present work was to compare clavulanic acid productivity in batch, fed-batch and continuous fermentors by cultivating Streptomyces clavuligerus in a complex
medium.
MATERIALS AND METHODS
Microorganism
Vegetative cells of Streptomyces clavuligerus
ATCC 27064, stored in cryotubes (glycerol 10% v/v) at -70°C, were used throughout this work
Culture Media
In this work reactivation medium for reactivation of the microorganism from the cryotubes and production medium for the preparation of inoculum and fermentation steps were used.
The reactivation medium was composed of the following (g L-1): glycerol, 10; bacto peptone, 10; malt extract, 10; yeast extract, 1.0; K2HPO4, 2.5; MgSO4.7H2O, 0.75; MnCl2.4H2O, 0.001; FeSO4.7H2O, 0.001 and ZnSO4.7H2O, 0.001
MnCl2.4H2O, 0.001; FeSO4.7H2O, 0.001 and ZnSO4.7H2O, 0.001.
The pH value was maintained at 6.8 in the reactivation and preparation of inoculum with a100 mM of MOPS buffer (3-[N-Morpholino]-propanesulfonic acid).
In the bioreactor runs, 0.1 g L-1 of silicone antifoam was added.
Fermentation Equipment and Cultivation Procedure
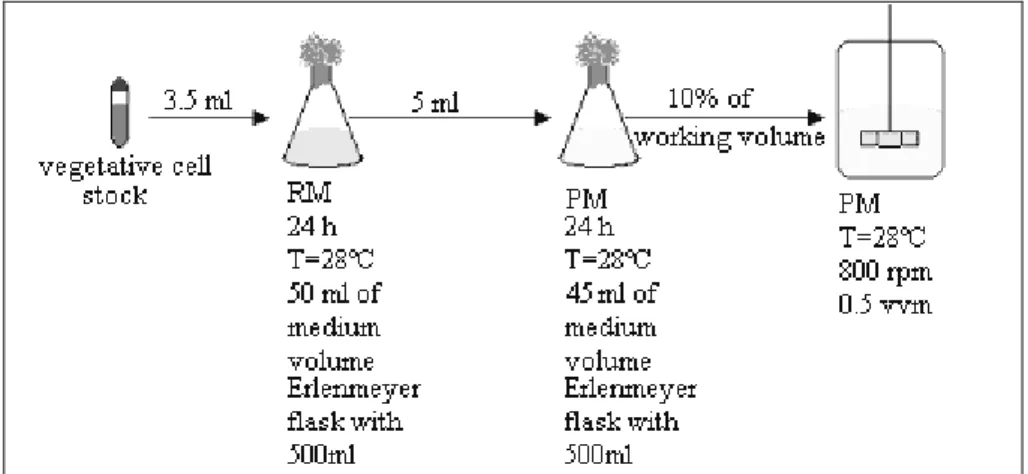
Cell suspension from cryotubes (3.5 mL), with a cell concentration of ca 5 g L-1, were added to 50 mL reactivation medium in a 500 mL Erlenmeyer flask
and incubated in a rotary shaker (New Brunswick Sci.) at 28°C and 250 rpm for 24 h. Erlenmeyer flasks of 500 mL with 45 mL of production medium were inoculated with 5mL of the cultivation above and incubated in a rotary shaker at 28°C and 250 rpm for 24 h. The entire content of the flasks was transferred to the fermentor containing the production medium, making up 10% of the inoculum volume. All cultivations were conducted at 28ºC and the pH was automatically maintained at 6.8 (+ 0.1) by adding 4 M HCl or 1 M NaOH solution. Stirrer speed was kept constant at 800 rpm and the specific air flow rate, at 0.5 vvm. The procedure described above is illustrated in Figure 1.
Figure 1: Schematic flowsheet of the experimental procedure
In batch cultivations, the initial volume was 4 L. Samples of about 20 mL were taken approximately every three hours during the first 24 hours and every four hours afterwards. Some of the samples were used for determination of rheological parameters, i.e., consistency index (K) and behavior index (n) from the power law model. The remainder of the samples were centrifuged at 3720 g and 5ºC for 20 min and the supernatants were utilized to determine clavulanic acid and glycerol concentrations.
In the fed-batch cultivation, the initial working volume was 2.5 L. Additional medium was added after 24 hours of cultivation at a constant flow rate (0.08 L h-1). Samples were taken approximately every three hours during the first 24 hours and every six hours afterwards. The same analyses as those made in the batch cultivations were carried out. The additional medium had the same composition as that of the production medium except for the glycerol concentration used, which was 10 g L-1.
The working volume in the continuous cultivation reactor was 3 L. The continuous culture was
operated at six different dilution rates (D) between 0.036 and 0.18 h-1, corresponding to a range of residence time from 5.5 to 27.8 h.
Analytical Methods
Clavulanic acid concentration was determined by the HPLC method using a reversed-phase column (C-18 µ-bondapack, Waters Co.) and prederivatization with imidazole solution, as described by Foulstone and Reading (1982). The eluent was composed of 100 mM KH2PO4 at pH 3.2 with a buffer-to-methanol ratio of 94:6 and the flow rate was 2.5 mL min-1.
Glycerol concentration was determined by HPLC. NaOH (1 mM) solution was used as the mobile phase. The equipment was operated at 34ºC with a flow rate of 1 mL min-1. A Shodex 802 column (Lonpak, division of Millipore) was utilized.
The cell concentrations were determined by a correlation of rheological parameter and cell concentration obtained by assuming a cell-to-substrate yield coefficient. The correlation, eq. 1, was described by Rosa (2002).
0.333 0.079
Cx 3.76K= n− (1)
Where K is the consistency index, n is the flow behavior index and Cx is the cell concentration The values for volumetric productivity of the clavulanic acid for batch and fed-batch cultivations were calculated with eq. 2 below. The values for volumetric productivity of clavulanic acid in continuous cultivation were calculated with eq. 3.
Cp Pp
t
= (2)
Pp CpD= (3)
Where Pp is the volumetric productivity of clavulanic acid (mg L-1 h-1), t is the cultivation time (h), Cp is the clavulanic acid concentration (mg L-1) and D is the dilution rate (h-1).
RESULTS AND DISCUSSION
The time courses of the batch, fed-batch and continuous cultivations are presented in Figures 2, 3 and 4, respectively.
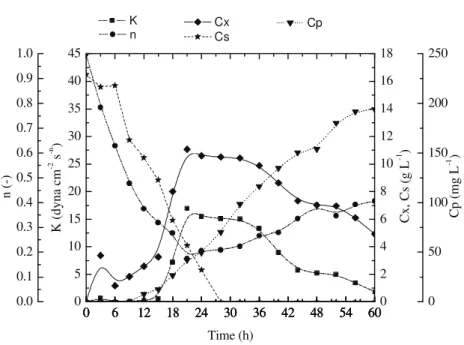
In the batch cultivation production of clavulanic acid started at between 12 and 18 h of cultivation, still during the growth phase; however most of the production occurred later, after the glycerol had been consumed (ca 27 h). The production rate remained almost constant up to 60 h, ca 32 h after glycerol consumption had been completed. Also cell growth occurred in approximately 27 h. This fact indicates that production of clavulanic acid is not associated with microorganism growth, in agreement with the results obtained by Baptista Neto et al. (2000). The same behavior was observed in the fed-batch cultivation; however the results show that the rate of clavulanic acid production decreased after 42 hours of cultivation. This fact indicates that a product of the metabolism of the microorganism may be acting as a repressor or inhibitor in the metabolic pathway of CA production.
In the three operation modes studied, production started whenever the glycerol concentration reached values below ca 11.0 g L-1, in agreement with the results obtained by Baptista Neto et al. (2000).
0 6 12 18 24 30 36 42 48 54 600 2 4 6 8 10 12 14 16 18
0 6 12 18 24 30 36 42 48 54 60 0 50 100 150 200 250
0 6 12 18 24 30 36 42 48 54 60 0
5 10 15 20 25 30 35 40 45
0 6 12 18 24 30 36 42 48 54 60 0.0
0.1 0.2 0.3 0.4 0.5 0.6 0.7 0.8 0.9 1.0
Cx, Cs (g L
-1 )
Cx Cs
Cp (mg L
-1 )
Cp
K (dyna cm
-2 s -n )
K
n (-)
Time (h)
n
Figure 2: Biomass concentration (Cx), glycerol concentration (Cs), consistency index (K), flow
0 6 12 18 24 30 36 42 48 54 60 66 72 78 84 90 960 2 4 6 8 10 12 14 16 18
0 6 12 18 24 30 36 42 48 54 60 66 72 78 84 90 96 0 50 100 150 200 250 300 350 400 450
0 6 12 18 24 30 36 42 48 54 60 66 72 78 84 90 96 0
5 10 15 20 25 30 35 40 45
0 6 12 18 24 30 36 42 48 54 60 66 72 78 84 90 96 0.0
0.2 0.4 0.6 0.8 1.0 1.2 1.4 1.6
Cx, Cs (g L
-1 )
Cx Cs
Cp (mg L
-1 )
Cp
K (dyna cm
-2 s -n )
K
n (-)
Time (h)
n
Figure 3: Biomass concentration (Cx), glycerol concentration (Cs), consistency index (K), flow
behavior index (n) and clavulanic acid concentration (Cp) in the fed-batch cultivation overtime
0.00 0.04 0.08 0.12 0.16 0.20 0
2 4 6 8 10 12 14 16 18
0.00 0.04 0.08 0.12 0.16 0.20 0.00
0.05 0.10 0.15 0.20 0.25 0.30 0.35 0.40 0.45 0.50
0.00 0.04 0.08 0.12 0.16 0.200 3 6 9 12 15
0.00 0.04 0.08 0.12 0.16 0.20 0 50 100 150 200 250 300
K (dyna cm
-2 s -n )
K
n (-)
n
Cx, Cs (g L
-1 )
Diluition rate (h-1)
Cx Cs
Cp (mg L
-1 )
Cp
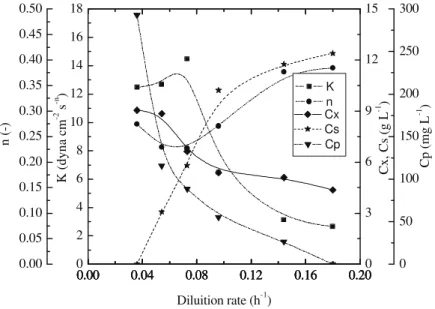
Figure 4: Variation in biomass concentration (Cx), glycerol concentration (Cs), consistency index (K), flow
behavior index (n) and clavulanic acid concentration (Cp) with dilution rate in the continuous cultivation
Table 1: Maximum clavulanic acid concentration (Cpmax) and maximum volumetric productivity of
clavulanic acid (Ppmax) obtained in the batch, fed-batch and continuous cultivations.
Experiment Cpmax (g L-1) Ppmax (g L-1 h-1)
batch cultivation 194 3.5
fed-batch cultivation 404 8.8
A comparison of the maximum value of concentration of clavulanic acid (Cpmax) and the maximum value of volumetric productivity of clavulanic acid (Ppmax) obtained in the three modes of operation is in Table 1.
The results in Table 1 show that the highest maximum concentration of clavulanic acid was obtained in the fed-batch cultivation and the highest volumetric productivity of clavulanic acid was obtained in the continuous cultivation.
The highest maximum concentration of clavulanic acid obtained in the fed-batch cultivation is a typical result; since this mode of operation favors production of secondary metabolites such as CA, which occurs mostly during the stationary phase. The glycerol feed increased the stationary phase, characterized by high cell concentration and an increased and steady rate of secondary metabolite production.
In the fed-batch cultivation, a decrease in the rate of CA production was observed after 42 hours. At this time the cell concentration was still high and the glycerol concentration was lower than the value that causes repression or inhibition of CA production. This indicates that, in this process, the decrease in production rate is associated with the biosynthesis of metabolic byproducts that repress or inhibit the metabolic pathway to clavulanic acid.
This repression or inhibition was not observed in the continuous process. In this process the continuous feed of fresh medium and the continuous removal of spent medium allowed for a lower concentration of the CA pathway repressor or inhibitor.
Based on the results obtained above, studies on the process of CA production in a system with cell recycle equipment allowing for a high cell concentration, are underway in our laboratories.
CONCLUSIONS
The results obtained in this work showed that clavulanic acid is partially associated with growth; however most of the production phase occurs with no association with the growth phase. The highest CA productivity was obtained in the continuous cultivation, while the fed-batch culture attained the highest CA concentration. Batch cultivation was shown to be the least efficient mode of operation since both CA productivity and maximum CA concentration were the lowest in this mode of operation. In conclusion, it can be said that the continuous culture of Streptomyces
clavuligerus is a very promising strategy for
production of clavulanic acid.
ACKNOWLEDGEMENTS
The authors acknowledge the financial support and scholarship received from FAPESP (Proc.99/03279-7, 00/10054-0) and CNPq.
NOMENCLATURE
Cp clavulanic acid concentration
(mg L-1) Cpmax maximum value of
clavulanic acid concentration
(mg L-1)
Cs glycerol concentration (g L-1) Cx cell concentration (g L-1)
D dilution rate (h-1)
K consistency index (dyna cm-2 s-n) n behavior index
Pp volumetric productivity of clavulanic acid
(mg L-1 h-1) Ppmax maximum volumetric
productivity of clavulanic acid
(mg L-1 h-1)
t cultivation time (h)
REFERENCES
Baggaley, K.H., Brown, A.G. and Schofield, C.J., Chemistry and Biosynthesis of Clavulanic Acid and Another Clavans. Natural Product Report, vol. 57, pp. 309-333, 1997.
Baptista-Neto, A., Gouveia, E.R., Badino-Jr, A.C. and Hokka, C.O., Phenomenological Model of the Clavulanic Acid Production Process Utilizing
Streptomyces clavuligerus, Brazilian Journal of
Chemical Engineering, vol. 17, n. 04-07, pp.809-818, 2000.
Battaglia-Hirata, D., Produção de Ácido Clavulânico por Streptomyces clavuligerus e Extração em
Sistema de Duas Fases Aquosas, São Carlos-SP, University Federal of São Carlos, (Master’s thesis), 2003.
Butterworth, D., Clavulanic acid: Properties Biosynthesis, and Fermentation. In: Vandamme, E.J. Biotechnology of Industrial Antibiotics, New York, Marcel Dekker, vol.22, pp.225-235, 1984. Demain, A.L, Overproduction of Microbial
Metabolites and Enzymes due to Alteration of Regulation, Advances in Biotechnological Engineering, vol. 1, 113 p., (1971)
Foulstone, M. and Reading, C., Assay of Amoxillin and Clavulanic Acid, the Components of Augmentin, in Biological Fluids With HPLC, Ant. Ag. Chem., vol.22, pp.753-762, 1982. Kirk S, Avignone-Rossa C.A. and Bushell M.E.,
Growth Limiting Substrate Affects Antibiotic Production and Associated Metabolic Fluxes in
Streptomyces clavuligerus, Biotechnology
Letters; vol. 22; n. 22, pp. 1803-1809; 2000.
Mayer, A.F. and Deckwer, W.-D. Simultaneous Production and Decomposition of Clavulanic Acid During Streptomyces clavuligerus Cultivations. Appl.
Microbiol. Biotechnol., vol.45, pp. 41-46, 1996. Nabais, A.M.A. and Fonseca, M.M.R. Improved
Process for Clavulanic Acid Production, Patent Number WO0005397, 2000.
Rosa, J.C., Influência das Condições de Transferência de O2 na Produção de Ácido Clavulânico por Streptomyces clavuligerus, São
Carlos-SP, University Federal of São Carlos, (Master’s thesis), 2002.
Yegneswaran, P.K., Gray, M.R. and Thompson, B.G., Experimental Simulation of Dissolved Oxigen Flutuations in Large Fermentors: Effect on Streptomyces clavuligerus, Biotech. Bio.,