ABSTRACT: Human Machine Interface (HMI) design is a critical ield of work because no general guidelines or rules have been assessed. In order to aid practitioners to design effective HMIs, different methodologies have been studied. To understand task objectives and plan goal-oriented actions, human operators exploit speciic cognitive processes that have to be supported with advanced interfaces. Including cognitive aspects in HMI design allows generating an information low that reduces user mental workload, increasing his/her situation awareness. This paper focuses on design and test of a Graphical User Interface (GUI) for the telenavigation of a space rover that makes the cognitive process of the user a priority in relation to the other development guidelines. To achieve this, a Cognitive Task Analysis (CTA) technique, known as Applied Cognitive Work Analysis (ACWA), is combined with a multi-agent empirical test to ensure the GUI effectiveness. The ACWA allows evaluating mission scenarios, i.e. piloting the rover on the Mars surface, in order to obtain a model of the human cognitive demands that arise in these complex work domains. These demands can be used to obtain an effective information low between the GUI and the operator. The multi-agent empirical test, on the other hand, allows an early feedback on the user mental workload aiming to validate the GUI. The result of the methodology is a GUI that eases the information low through the interface, enhancing operator’s performance.
KEYWORDS: Cognitive engineering, Human machine interface, Space robotics, Space exploration, Graphical User Interface.
Cognitive Based Design of a Human Machine
Interface for Telenavigation of a Space Rover
Luca De Filippis1, Enrico Gaia2, Giorgio Guglieri1, Marco Re1, Claudia Ricco3INTRODUCTION
In today’s world, many systems are remotely operated or supervised by individuals who are decision makers. The planning, monitoring and controling of many of these systems are supported via visual display units. Applications that heavily depend on teleoperation and telenavigation are space exploration missions. Complex and dangerous conditions — deriving from environmental hazards — may occur to humans involved in these missions usually performed with supervised systems. As an example, Biesiadecki et al.
(2007) state that “successful operation of the Mars Exploration Rover (MER) vehicles has depended on both manually-directed and autonomous driving. The two methods are complementary and careful selection of the right technique leads to better overall performance”. The Graphical User Interface (GUI) design becomes a critical task in mission accomplishment, enhancing operator’s Situation Awareness (SA) and control capabilities.
Existing design approaches cover only speciic aspects of HMI design (Störrle, 2010), bringing to application-oriented solutions which limit the development of complex architectures. Many approaches and tools to tackle individual problems in the interface design have been developed by Hashimoto et al. (2011), but any integrated solution addressing the whole design process has been deined. A big efort has been spent to design and implement displays and interfaces to operate rovers in space: as NASA Visual Environment for Remote and Virtual Exploration (VERVE), Predictive and Interactive Graphical Interface (PIGI) (Pedersen et al., 2010, 2012; Burridge and Hambuchen, 2009) or ClifBot Maestro (Norris et al., 2009).
1.Politecnico di Torino – Torino – Italy 2.Thales Alenia Space Italia S.p.A – Torino – Italy 3.Università degli Studi di Torino – Torino – Italy
Author for correspondence: Giorgio Guglieri | Department of Mechanical and Aerospace Engineering, Politecnico di Torino | C.so Duca degli Abruzzi 24, Torino – 10129 – Italy | Email: [email protected]
Assessed modeling approaches are:
• Operator Function Model (OFM) (Chu et al., 1995), used in supervising, monitoring and controling of Unmanned Combat Aerial Vehicles (UCAVs) (Narayanan et al., 2000);
• Direct Manipulation Interfaces (DMI) proposed by
Hutchins et al. (1985) with the aim of reducing gaps between the user’s goals and their knowledge of the system;
• Ecological Interface Design (EID) (Rasmussen and
Vicente, 1989), a theoretical framework for designing interfaces in complex human-machine systems based on skills, rules, knowledge (SRK) taxonomy (Rasmussen, 1983) and the abstraction hierarchy (AH);
• Goals, Operators, Methods, and Selection Rules (GOMS) (Card et al., 1983) a formal predictive modeling technique for interface design based on cognitive problem solving behavior (Eberts, 1994);
• Cognitive Task Analysis (CTA) (Gordon and Gill, 1997).
Direct correlation between user’s SA and overall performance of the supervised system (Endsley, 2003) make the information low through the GUI an essential feature in the designing process (Baxter, 2013). his paper proposes an integrated methodology in which SA requirements form the basis of the design phase. his integrated solution is achieved using a CTA approach — Applied Cognitive Work Analysis (ACWA) proposed by Elm (2003)—, coupled with direct testing methodology which involves user’s performance assessment (Endsley, 2000) as a feedback on design. his leads to the deinition of an integrated approach able to obtain graphical interfaces for space applications that can ensure high standards in terms of users’ performance and SA. CTA methodology can capture expert’s knowledge in managing complex, dynamic and changing environments (Mast, 2014). Redding (1992) deines CTA “as an approach in determining the mental processes and skills required in performing a task and the changes that occur as the skill develops”. Many of the above-mentioned approaches cannot lead to an explicit representation of the operator goals (Okura
et al., 2013) which is one of the major limitations of the OFM, or they are not efective in complex human-machine systems (Corujeira, 2013).
he paper introduces a methodology to design GUI with small, manageable, engineering transformations, each requiring the skilled application of the methodology’s principles rather than requiring a design revelation at any point in the process. he design progress, therefore, occurs by generating artifacts
that capture the results of each of these intermediate stages. Each of these artifacts also provides an opportunity to evaluate completeness and quality of the analysis and design efort. he design process is then associated with an empirical test (Nielsen, 1994), designed to obtain information about user performance and SA. A comparative analysis is conducted introducing support of experts, in order to extract information about the user’s SA and Mental Workload (MW), obtaining a complete methodology that allows the practitioner to be supported from the design phase to tests and analysis.
The remainder of this paper is organized as follows: next section presents an in-depth analysis of the ACWA methodology and covers all the design phases in which it is divided. Further sections describe the testing procedure to obtain all the information needed to correctly assess the GUI. Subsequently, the results of the testing phase is evaluated and further analysis on user perception and performance is made. he paper concludes with a discussion on the overall design approach.
DESIGN METHODOLOGY
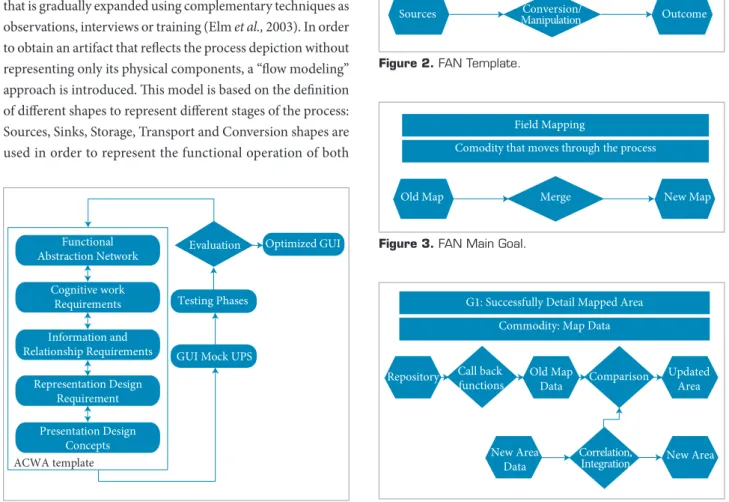
An in depth analysis of each step of the methodology is made in the remainder of this chapter. However, it must be stressed that all the steps of the process are “open” in parallel, so as design thoughts for CWRs, IRRs, or PDCs occur, they can be recorded and aid in the deinition of the FAN itself. Figure 1 represents the complete methodology lowchart, where ACWA steps are related to mockup generation and testing in a recursive process.
FUNCTIONAL ABSTRACTION NETWORK
FAN is a function-based goal-means decomposition of the domain. his step has its roots in the formal, analytic goal-means decomposition method pioneered by Rasmussen (1986) for representing cognitive work domains as an AH. he FAN is a structured representation of the functional concepts and their relationship used as the context for the information system to be designed. his produces a multilevel recursive means-ends representation of the work domain structure.
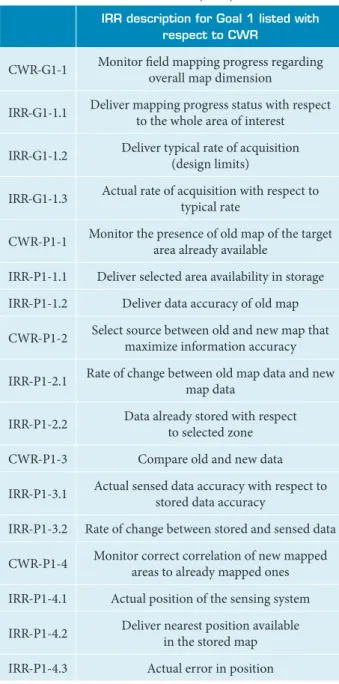
In practice, building a FAN is an iterative process: the FAN starts from an initial base of knowledge regarding the domain that is gradually expanded using complementary techniques as observations, interviews or training (Elm et al., 2003). In order to obtain an artifact that relects the process depiction without representing only its physical components, a “low modeling” approach is introduced. his model is based on the deinition of diferent shapes to represent diferent stages of the process: Sources, Sinks, Storage, Transport and Conversion shapes are used in order to represent the functional operation of both
abstract and relatively physical processes (Fig. 2). Figure 3 represents the primary goal formulated in the application here described, to start the development of the FAN.
hen, complementary techniques, as face-to-face interview or verbal protocol techniques are used in order to expand and enrich the domain understanding and to evolve a function-based model. Figure 4 shows the evolution of the FAN from goal 1 to goal 2. It expands the concept of map updating that is necessary to obtain a new map from the old one, merging new environment data obtained during the ield-mapping process. he FAN obtained in this paper starts from a ield mapping overall mission objective: this main goal is subsequently expanded through the deinition of system deployment functions and the analysis of rover motion functionality. At the very low level of abstraction, the FAN leads to deine the functions of gathering
Information and Relationship Requirements
ACWA template
Functional Abstraction Network
Cognitive work Requirements
Representation Design Requirement
Presentation Design Concepts
GUI Mock UPS
Optimized GUI
Testing Phases Evaluation
Figure 1. Design methodology.
Goal Desired objective of the process function
Commodity that moves through the process
Conversion/ Manipulation
Sources Outcome
Figure 2. FAN Template.
G0 :
Field Mapping
Comodity that moves through the process
Merge
Old Map New Map
Figure 3. FAN Main Goal.
G1: Successfully Detail Mapped Area
Commodity: Map Data
Call back functions
Repository Old Map
Data Comparison
Updated Area
New Area Data
Correlation,
Integration New Area
environment data, successfully recovering command information and evaluating operative mode constrains.
As stated above, the scenario of the project is a ield mapping oriented mission, all the other features and mission possibilities will be dropped to simplify the case of study. his assumption is needed to deine a work domain not as complex as a whole mission deinition, which allows researchers to describe it in minute details. For this reason, only the rover functions directly coupled with its motion capabilities and its deployment abilities are taken into account and investigated during this work. Furthermore, to ease the FAN depiction, the mission is intended to be in nominal mode; failure management will be only expected but it will be not investigated.
he FAN representation of the work domain’s concept brings us to the second step of the ACWA process: deriving the CWR.
COGNITIVE WORK REQUIREMENTS
CWR represent the cognitive demands for each part of the domain model, i.e., all type of recognition, decision-making and problem-solving activities.
In the methodology, the addition of CWRs to the design repository is described as “thickening” the analysis (Elm et al.,
2003): in fact, each CWR is attached to a node of the FAN as an enrichment of the domain concept understanding. Based on the underlying premises of the CTA, these CWR center around either goal or functional process, monitoring for goal satisfaction and resource availability, planning or selecting among alternative options to achieve goals, and controlling the functional process. By organizing the speciication of operator’s cognitive requirements around nodes in the FAN rather than organizing requirements around predeined task sequences, the representation helps to ensure a consistent, decision-centered perspective (Table 1).
his perspective implies that the FAN nodes can be associated with diferent kind of CWRs: some of them can be found across a variety of domains, so a “template” of generic CWR can be tested for each node of the FAN, while others are uniquely coupled with the scenario features and demands. Thus, the FAN forms the basis for the structure of the cognitive demands relected in the CWRs. For example, every goal node in the FAN has associated “goal monitoring” decisions; likewise, processes have associated “process monitoring” decisions and, similarly, there will always be some “feedback monitoring” decisions related to assessing whether actions are achieving the desired result.
In many ways, this step is where the decision support system requirements are shaped: hence, good CWRs depiction
is essential to the inal resulting GUI. A portion of the CWR obtained from the FAN are listed below:
• Monitoring ield-mapping progress regarding overall map dimension;
• Monitoring successful positioning of the sensor for data acquisition;
• Selecting the optimal motion of the rover to maximize sensor potential;
• Choosing the best command sequence to move the rover to the acquisition site;
• Monitoring current command input to avoid limit
crossing;
• Selecting the best navigation option to maximize rover response during mission;
• Monitoring actual rover movement capabilities to
maximize its potential;
• Monitoring actual rover movement possibilities to
perform deined action;
• Monitoring rover system behavior to obtain information about its actual status;
• Monitoring correct acquisition of sensed commands.
INFORMATION AND RELATIONSHIP REQUIREMENTS
While mental demands of every FAN node are gathered through CWRs deinition, the information required for each decision to be made is still unidentiied. IRRs are deined as the set of informative elements necessary to successfully resolve the associated CWRs. hus, the focus of this step in the methodology is to identify the ideal and complete set of information for the
CWR description
CWR-G1-1 Monitor ield mapping progress with
respect to the overall map dimension
CWR-P1-1 Monitor the presence of old map of
the target area already available
CWR-P1-2
Select source between old and new map that maximize information
accuracy
CWR-P1-3 Compare old and new data
CWR-P1-4
Monitor correct correlation of new mapped areas to already
mapped ones
associated decision-making process. herefore, IRR forms the basis for the visualization support to be designed in the next phase. However, information is not data: data can require complex transformations to become information. hus, IRRs have a much deeper impact on the entire system architecture than merely the “look and feel” of the inal GUI (Elm et al., 2003).
It is important to note that IRRs are strongly related to mental demands fulillment (CWRs) and are not limited by data availability in the current system. If the required data is not directly available, ACWA provides a logical basis to obtain that data (e.g. pulling data from a variety of databases, adding additional sensors, creating “synthetic” values); this leads to one of the assumptions of the project: some of the information obtained from IRR requires data not available with current state of the art sensors, but strongly needed for a successful space telenavigated mission.
his approach is diferent in relation to the one that human-factor engineers have had in the past (designing an interface ater the system equipment has been speciied). he standard approach, in fact, cannot give any proit in terms of understanding the user’s MW involved in the process of acquiring the correct SA.
Consequently, “the ACWA approach is fundamentally broader in scope than other approaches to interface design that do not consider the impact of IRRs on system architecture speciications” (Vicente et al., 1996).
It is easy to notice that a lot of information can be needed by a single CWR to be completely deined. Furthermore, high-level goals — as the ones in Table 2 — are dependent upon supporting information, successfully developed in lower level goals.
A summary table was created to correctly evaluate all the information needed to satisfy the mental demands of our domain. In this table, the information are correlated to the supporting function, in order to deine a hierarchy between them. Table 3 collects all the information which need to be provided to the user in order to trigger the cognitive processes related to each functional process. his information is, in many cases, the same for diferent cognitive processes — as it is shown on the second column of the table, where each number corresponds to a speciic cognitive process. he table allows correlating each piece of information to the number of cognitive processes in which it is involved. Information involved in many cognitive processes need to have priority on the GUI, because the user will need them all the time to maintain its SA.
Upon obtaining IRRs, the ensemble containing the FAN, the CWRs and their associated IRRs represent a solid basis for the development of the decision-making graphical support.
However, to obtain a Graphical Interface that communicates with operators without efort, the IRRs have to be converted into visual widgets. he last two steps of the ACWA, which are the RDRs and the PDCs, allow the methodology to bridge this gap.
REPRESENTATION DESIGN REQUIREMENTS AND PRESENTATION DESIGN CONCEPTS
RDRs define the goals and scope of the information representation, in terms of cognitive tasks it is intended to support. It also provides a description of the supporting
IRR description for Goal 1 listed with respect to CWR
CWR-G1-1 Monitor ield mapping progress regarding
overall map dimension
IRR-G1-1.1 Deliver mapping progress status with respect to the whole area of interest
IRR-G1-1.2 Deliver typical rate of acquisition
(design limits)
IRR-G1-1.3 Actual rate of acquisition with respect to typical rate
CWR-P1-1 Monitor the presence of old map of the target
area already available
IRR-P1-1.1 Deliver selected area availability in storage
IRR-P1-1.2 Deliver data accuracy of old map
CWR-P1-2 Select source between old and new map that
maximize information accuracy
IRR-P1-2.1 Rate of change between old map data and new
map data
IRR-P1-2.2 Data already stored with respect
to selected zone
CWR-P1-3 Compare old and new data
IRR-P1-3.1 Actual sensed data accuracy with respect to
stored data accuracy
IRR-P1-3.2 Rate of change between stored and sensed data
CWR-P1-4 Monitor correct correlation of new mapped
areas to already mapped ones
IRR-P1-4.1 Actual position of the sensing system
IRR-P1-4.2 Deliver nearest position available
in the stored map
IRR-P1-4.3 Actual error in position
information required to sustain the cognitive tasks. Furthermore, this step in the process begins shiting the attention from “what” is to be displayed (deined by FAN, CWRs and IRRs) to “how” to display it. It adds a more complete description of the behaviors and features needed to communicate the information efectively, as well as an allocation of the Information/Relationship Resources across the entire set of displays within the workspace.
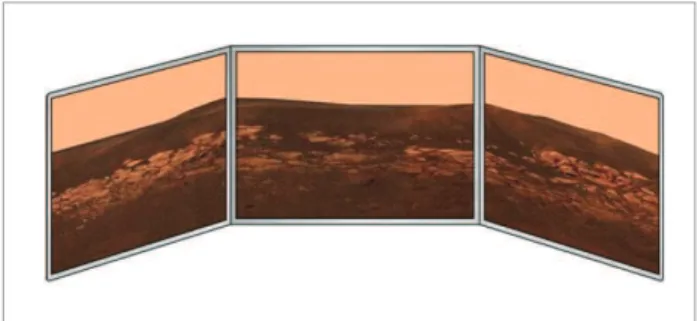
he visual framework of a Rover Simulation has been taken into account to obtain the RDRs and the PDCs.
A software framework able to create 3D immersive virtual simulations has been used in order to develop a particular Rover Simulation application. he sotware was developed inside a Piedmont regional funded project, ended in May 2012, called STEPS (Sistemi e Tecnologie per l’EsPlorazione Spaziale). STEPS was a project supported by Regione Piemonte and carried out by hales
AleniaSpace Italia, Small and Medium Enterprises, Universities and public Research Centres belonging to the network “Comitato Distretto Aerospaziale del Piemonte”. he project objective was to develop hardware and sotware demonstrators for descent, sot landing and surface mobility of robotic and manned equipment during Moon and Mars exploration. he demonstrator was created in the Collaborative System Engineering (COSE) Centre, a hales AleniaSpace Italia facility in Torino which operates within the Engineering & Advanced Studies Directorate of the Domain Exploration and Science Italy. he Centre main mission is to research, develop, integrate and propose new methodologies and tools to enhance the system engineering capabilities and the multidisciplinary collaboration.
Using the Virtual Rover Demonstrator it is possible to simulate a rover motion on a planetary surface.
Table 3. Portion of Information and Relationship Requirement list.
IRR Goal supported by IRR
Command information: acceleration (actual and maximum) 4-5-6-7.5-8.2
Command information: acquisition sensor check up 7.5-8.2
Command information: command history 7.5-8.2
Command information: command veriication 8.2
Command information: commanded torque 4-7.5-8.2
Command information: communication bandwidth 8.2
Command information: communication coverage 8.2
Command information: communication windows 8.2
Command information: electric current needed 4-5-6-7.5-8.2
Command information: maximum torque available 4-5-6-7.5-8.2
Command information: Power available to engines (actual and typical) 4-5-6-7.5-8.2
Command information: speed (actual and maximum) 4-5-6-7.1–7.2–7.5-8.2
Command information: Wheels Diferential torque 4-7.5-8.2
Environment data: acquisition data rate (actual and typical) 8.1
Environment data: memory space available 8.1
Environment data: sensor status 7.3-8.1
Environment data: sun exposure (actual and typical) 8.1
Environment data: temperature (actual and typical) 8.1
Environment data: wind speed (actual and typical) 8.1
hree visual displays are used to obtain a wide screen virtual experience of the rover and the terrain (Fig. 5).
Another benefit provided by RDRs is that, as long as the domain remains unchanged, the RDR serves as an explicit documentation of the presentation concept purpose, despite of the technologies available and used to implement it. As newer technologies become available, and as their interaction with human perception becomes better understood, the technologies used to implement the RDR can evolve.
he RDRs are obtained splitting the IRRs into:
• Essential information: it represents vital information, which needs to be on the central screen. It gathers information which have to be easily accessed by users;
• Detailed information: represents information which may improve user’s awareness with an increase in their workload. his information is more accurate and detailed and can be used to improve awareness on a selected feature.
he following data have been evaluated as part of essential information: user commands, speed, rover heading and “out of range” alert of these parameters. Other “alert signals” have to be it into costless information: proximity hazard, pitch acceleration and roll acceleration. These alerts are needed because the rover stability can be heavily compromised if these parameters exceed their thresholds. his information represents the one related to a greater number of IRRs.
On the other hand, in the detailed information, there are included the pitch and roll, angular velocity and speed of the wheels. It is easy to notice that the user may perform a proper telenavigation task by focusing attention on the central screen. he information on lateral screens plays a detailing role: if the user understands that something is not working as intended (e.g. from no-cost information) he/she will focus on lateral screens in order to obtain more detailed information. he set of information used on the lateral screen are obtained from the one that will afect a smaller number of functional processes.
Ater the development of the RDRs, the last step in the methodology is obtaining explicit PDCs for the Interface (as GUI mock-ups). This final step requires the knowledge of the human perception and its interaction with the various presentation techniques and attributes. With the RDR as a guide, the sketches, drawings, and brainstorming concepts can all be resolved against the display’s intent and requirements. he issues of how it is perceived can best be done with empirical testing of prototypes and oten requires considerable tuning and
adjustment to achieve the representation capabilities speciied in the RDRs.
During this phase, researchers found, for example, that the information panels couldn’t be put on the further edge (in relation to the central screen position) of both the side screens due to their dimensions. In fact, if positioned on the further edge, information becomes accessible only with a larger motion of the head, with a consequent degradation in driving performance. To avoid this issue, while maintaining a good distinction between essential and detailed information, researchers choose to insert the information panel on the nearest edge of the lateral screens.
he availability of two diferent panels (both the side screens are used to represent detailed information) allows a further classiication to aid users in the rationalizing process of the interface. Thus, researchers try to collect on the left screen the detailed information related to kinematic data and system parameters, while on the right screen were implemented navigation information. he inal mock-up of the GUI obtained using this methodology is shown below (Figs. 6, 7 and 8):
The availability of an older interface (Fig. 9) with the same purpose of the one created using the ACWA approach, allows researchers to enhance it, decreasing the time spent for this last step.
All the improvements done on the interface are listed in Table 4.
TEST DESCRIPTION
An empirical test was developed in order to obtain information both on the user SA and on their performance in task fulillment.
Several methods of testing SA have been documented (Endsley
et al., 2000; Endsley, 1995a; Endsley, 1995b), usually divided into:
• Knowledge-based measurement techniques; and
• Performance-based measurement techniques.
he knowledge-based measurement techniques are founded on either simulations or real trials. he task is selected according to the level or type of SA being addressed by the experiments. he method identiies independent variables (i.e., the type of display for a GUI, the type of interaction device used to pilot a remote vehicle) and dependent variables, such as objective and subjective measures of testeing knowledge (i.e., understanding) and performances.
Furthermore, there are several complex techniques which attempt to determine or model the subject’s knowledge of the situation at diferent times throughout simulation runs.
Figure 6. Left screen Graphical User Interface.
Figure 7. Central screen Graphical User Interface.
Figure 8. Right screen Graphical User Interface.
Screen Improvement
Lateral-let Battery status bar added
Lateral-let Wheel slip indicator added
Lateral-let Artiicial horizon added
Lateral-let Angular velocity display added
Central Directional compass added
Central Ghosting function improved
Central Torque-related color function added
Central Rover speed indicator added
Lateral-right Hexagon position modiied
Lateral-right Map position modiied
Lateral-right Rover heading function added in the map
Table 4. Graphical User Interface improvements.
For example, the Situation Awareness Global Assessment Technique (SAGAT) freezes the simulator screens at random times during the runs, and queries the subjects about their knowledge of the environment. his knowledge can be at several levels of cognition, from the most basic of facts to complicated predictions of future states.
The performance-based measurement of SA has taken several forms. Some techniques measure the overall final performance of the human-in-the-loop system in any or all of its tasks. Alternatively, Testable Responses can be used in order to evaluate SA: the subjects will face predetermined situations during the simulation that require decisive and identifiable actions, if the subjects have the correct level of SA, they can correctly perform the required actions while, with low awareness, they cannot perform it.
As a general comment, to provide a detailed assessment of the subject’s SA, the knowledge-based techniques are more accurate, as they measure these variables directly. Performance-based measurement can only make inferences based upon the particular information the subject acted upon, and how it was interpreted, thus these techniques are very useful when well-determined performance are assessed, while the knowledge-based techniques can be more accurate when a lot of different aspects are observed together, and multiple performance assessments can be made.
Self-rating techniques are used in order to gain a subjective assessment of participant’s SA. Typically administered post-trial, self-rating techniques involve participants providing a subjective rating of their perceived SA via an SA related rating scale. As an example, the Situation Awareness Rating Technique (SART) is a subjective rating technique developed for the assessment of the pilot’s SA.
The primary advantages of self-rating techniques are their ease of application (easy, quick and of low cost) and their non-intrusive nature (since they are administered post-trial) very useful for the early assessment in the design process. However, subjective self-rating techniques are heavily criticized for several reasons, including the various problems associated with the collection of SA data post-trial (correlation of SA with performance, poor recall) and also issues regarding their sensitivity.
Another method used in order to estimate SA is based on observer’s ratings during or at the end of the trial. Observer rating techniques typically involve a Subject Matter Expert
(SME) observing participants performing the task under analysis and then providing an assessment or rating of each participant’s SA. The SA ratings are based upon observable SA related behavior exhibited by the participants during task performance. The main advantages associated to the use of observer rating scales to measure SA are their non-intrusive nature and their ability to be applied ‘in-the-field’. However, the extent to which observers can accurately rate participant SA is questionable, and also multiple SMEs may be required. A five points rating scale (1 = very poor, 5 = very good) and an additional ‘not applicable’ category can be used for each observable SA related behavior of the tester.
he objectives of the testing phase are diferent: on one hand a irst evaluation of the ACWA have to be made in order to assess its impact on the user perception, on the other hand the GUI itself has to be tested to verify its usability. To obtain a feasible and light testing methodology that can inspect these features, a brand new approach to the testing phase is developed. A performance-basedconcept is used in order to investigate the GUI usability while self-rating questionnaires are defined to obtain information about operator’s SA. hese early tests in the overall design phase of the simulator cannot take advantage of the knowledge-based techniques: the overall behavior of the system is still undeined, thus it is impossible to deine independent variable to be observed.
While the self-rating questionnaires are administered post-trial in order not to influence the performance, the SMEs will focus their attention on the operator’s behavior during the trials and on their accord with the GUI.
The coupling of the self-rating techniques with the observer rating techniques allows practitioners to enhance the testing phase thanks to the ease of application of these methodologies without incurring in the subjective limitations of the user self-assessment. Furthermore, this mixed technique offers the best tradeoff between result’s significance and test costs.
TEST PROCEDURE
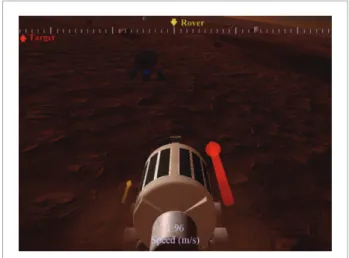
The testing procedure is hereafter shortly described. A number of selected users were expected to drive the rover in remote manual control (i.e., using the joystick) along an assigned path (defined by 6 waypoints, in alphabetical order from A to F, distributed on the map). Each test is completed when the rover reaches the final waypoint F, orwhen the battery completely discharges. Together with this main task, a second — and less important — goal has been defined to increase the user MW. This second objective referred to a completely different mental process regarding the one involved in the fulfillment of the main goal. To accomplish this, the users were asked to count the number of “skid events” — i.e., to count the number of bars which turn red, Fig. 10 — while performing the main task (to reach the final waypoint F).
The SA assessment is based on expert observer’s ratings (during the test) and user’s self-ratings (at the end of the test). Prior to testing, a further questionnaire was given to the user: the aim of this “Relationship Questionnaire” (RQ) (Bartholomew & Horowitz, 1991) was to evaluate the attachment style of every participant.
The RQ is a self-report utility which allows investigating the general orientation of our adult intimate relationships, regarding psychological and emotional intimacy. The test is arranged in four short self-descriptions, each of which summarizes the basic aspects of one of the four main patterns of attachment. This classification system allows the subject to be identified, as a prototype, within one of the four attachment styles: secure attachment style, dismissive- avoidant, preoccupied and fearful-avoidant.
During the test, subjects have to choose the most representative prototype of themselves, furthermore they also have to assess the extent to which each of the four prototypes represents them, using a 1 (strongly disagreement) to 7 (total agreement) scale. This allows us to assess both the image that the subjects have of themselves and the image that they have of the others: obtaining, by the intersection of the data, a “model of self ” and a “model of others”, which may be positive or negative. In this way, the RQ investigates the hypothesis of Bowlby (1973), that attachment styles reflect the internal working models of self and others, which can be both positive and negative. It follows that the secure attachment, in which subjects are characterized by coherence, autonomy and self-confidence is derived from
the combination of a positive model of self and a positive model of others. The dismissive-avoidant attachment results from a positive self-evaluation associated to a negative representation of others: subjects tend not to be coherent, they sacrifice the intimacy and deny the importance of relationships, in “a kind of self-sufficiency affective and existential” (Bruni, 2004). The combination of a negative model of self and a positive model of the other develops instead a preoccupied attachment, in which the subjects, which are distinguished by their relentless pursuit and apprehension about the relations, safeguard their low self-esteem exposing the incoherence and idealization of their own relationships. Finally, fearful-avoidant attachment is derived from the combination of a negative model of self and a negative model of the other; fearful individuals avoid involvement with others for fear of being rejected, even though they wish it fervently, since, because of their low self-esteem, they do not feel worthy and expect others to be ill-disposed, unreliable and rejecting. Attachment styles highlighted by the RQ test also adapt, to some extent, to the relationship of “trust” that is established between the pilot and the interface of the vehicle driven.
In addition to that, researches have extensively demonstrated that the diferent attachment styles are related to the ability to handle, emotionally and cognitively, diferent situations and stress that they can generate (Ricco, 2009). he attachment style will directly afect perception and, also, cognitive processes that can be used: consequently it has a key role in the eforts to improve the GUIs.
Thus the RQ could give information about the attachment style required to improve the teleoperation: in fact, shifting from the concept of pilots to the idea of supervisors could change the desired psychological profile of the user. For example, pilots, most of the time, are very self-confident and self-centered people: this could lead to a difficult interaction with automated systems which require the confidence of the pilot to operate, exactly as it happens between people that need mutual trust in order to collaborate on a project. The tester experience started in a room next to the simulator where he has to fill the RQ isolated from the other users to avoid suggestions; the anonymous questionnaire, sealed inside a blank envelope, were collected by a dedicated practitioner. After the RQ collection, the tester could perform the driving session: in this phase three observers must fill out their questionnaire, looking at the user’s behaviors and at their performance (i.e., eyes motion, head motion or collecting defined data during the attempt) while maintaining absolute silence to avoid tester’s distraction. The last phase consists of the self-rating questionnaire: the tester answers the questions alone in the adjacent room then the anonymous questionnaires were collected by a dedicated practitioner. These questionnaires will explore the perception of the GUI from the operator point of view: some questions are related to parameter controlled by the observers (e.g., rover speed) in order to have a feedback on performance, while other are related to the cognitive processes that the operator have to exploit to correctly maneuver the rover. These questions can be used as a direct investigation on the ACWA effectiveness: if the operator cannot understand the GUI elements, it means that the process that he exploits is different from the one obtained from the ACWA that defines the GUI shape.
Within three months, two different sessions of tests were scheduled. Both the sessions involved same users and same observers in order to avoid erroneous comparison. In the last test, the GUI was not modified, but a time restriction was given to the testers in order to increase their MW(Paas
et al., 2004). The main task (to reach the final point “F”) and the secondary objective (to count the skid-events) were maintained, while the execution time was diminished by 20% in relation to the execution time measured during the first test. The aim of this second test was to increase the performance-based knowledge of the user’s understanding
process in a more dynamic and strained environment, and to verify the evaluations obtained in the previous test.
TEST
he user should demonstrate their ability to detect, understand and respond to events while maintaining a good performance in both assigned tasks. To do this, they have to maneuver the rover through six waypoints positioned on Mars’ surface in order to reach the inal waypoint F. While the user is performing the test, three observers will judge their behavior without interference. he observer’s ratings are divided into knowledge-based (e.g., distance and speed, randomly collected by the observer) and performance-based (e.g. time required to complete the path, number of collisions, average cross-track error in forward drive or the ability to drive straight, response to the presence of a random obstacle).
When the driving test is completed, the user has to ill a self-rating questionnaire. he self-ratings give the assessment of the overall performance according to user’s opinion.
General open comments are collected from both observers and testers, mainly related to the user’s SA and the HMI performance. In order to allow comparison within tests, the same questions made in the irst test were used in this self-rating questionnaire. Furthermore, the same users were engaged for testing the new GUI.
he number of users involved in the tests is limited (N = 7): this is acceptable because the number of operators is very limited in space applications. Space agencies invest many resources in training operators in order to employ highly specialized professionals. his leads to a deep knowledge of the system on which they are operating: therefore diferent applications employ users who possess a slightly diferent training. hus, statistical survey cannot show direct correlation or general behavior because each system requires diferent skills and training. For this reason, the results of the tests performed to evaluate the developed GUI will not be statistically useful.
EVALUATION
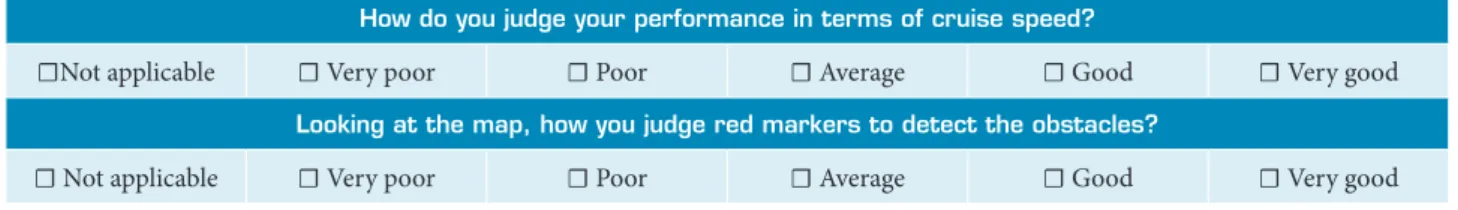
observers. However, to avoid erroneous or misleading behavior, the observer could not interfere with the user during the tests. he self-rating questionnaire consisted in diferent questions about user’s perception of the overall test: they are asked to remember detailed parameters (e.g., the average speed maintained during the test or battery level at the end of the test) and to give feedback about their perception (judging several features of the GUI as the directional compass or the proximity hazard feature). The majority of the questions consisted in a multiple-choice answer to ease the user’s fulfillment possibility: an example is shown below (Table 5).
The observer questionnaire tracked down the same parameters, e.g. rover speed, together with indicators that can help understanding user’s SA, such as coherence between user’s eyes motion and their task or their execution time (Table 6).
he self-rating questionnaire and the observer questionnaire were then compared to obtain information about the overall SA of the user. he answer of observers can be used as neutral criteria to evaluate the personal, thus subjective, ratings of the users.
In this way, pratictioners gathered information about performace, obtained from the observers annotations during the testers trial (e.g. average speed and execution time), and about interface effectiveness (thus the effectiveness of the cognitive approach was used to deine the interface itself), obtained comparing the observer’s annotation and the subjective rating of the user.
For example, the tester has to remember the level of charge of the battery at the end of their trial: the comparison between their answer and the actual data gathered by the observers allows obtaining information about the information transfer through the interface.
On the other hand, the comparison between the irst test and the second one, which has an increased tester’s MW, may improve the knowledge about the cognitive process of testers. he increase in MW means a lowering in SA: this will afect tester capability of acquiring information from the system. his could highlight the cognitive processes of the tester: if the operator cognitive process and the cognitive approach used in the interface design exploits the same process this leads to a natural acquisition of the information by the operator (i.e. the tester has not to process the information to understand it). In this way, the test could also verify the results of the previous test about interface efectiveness.
On the other hand, the RQ has been used to deepen the attachment style of the tester in order to obtain information about the tester’s individual difference that can significantly affect their performance. The RQ was submitted to the user beforethe start of the test and consists in four brief descriptions which summarize each of the main patterns of a different attachment style, from secure to fearful.
TEST RESULTS
In this section, the results of the two tests performed on the diferent GUIs have been reported. he following tables present the attachment style, the personal evaluation and the evaluation of the observer, for each of the seven users. In the second test (that was carried out with an increase MW), only two of the testers reach the inal point F within the time restriction. Furthermore, both of them possess a secure attachment style (Table 7).
his means that the secure attachment style, in which subjects are characterized by consistency, autonomy and self-conidence, may have a positive impact on the relationship of “trust” that is
How do you judge your performance in terms of cruise speed?
☐Not applicable ☐ Very poor ☐ Poor ☐ Average ☐ Good ☐ Very good
Looking at the map, how you judge red markers to detect the obstacles?
☐ Not applicable ☐ Very poor ☐ Poor ☐ Average ☐ Good ☐ Very good
Table 5. Self-rating questionnaire.
User eyes motion and coherence between current task and attention appointment.
☐ Not applicable ☐ Very poor ☐ Poor ☐ Average ☐ Good ☐ Very good
Covered distance (number of waypoints)
established between the pilot and the interface of the vehicle driven. However, there are also other two secure testers that have not completed the task in the given time: this means that a further investigation has to be conducted in order to assess the real correlation between pilots’ attachment style and their performance. On the other hand, the results can give information about the overall efectiveness of the design methodology in terms of users’ performance and SA.
Comparing testers’ answers given in the two tests with the data collected by observers, it is possible to understand if the tester’s perception of the GUI was coherent.
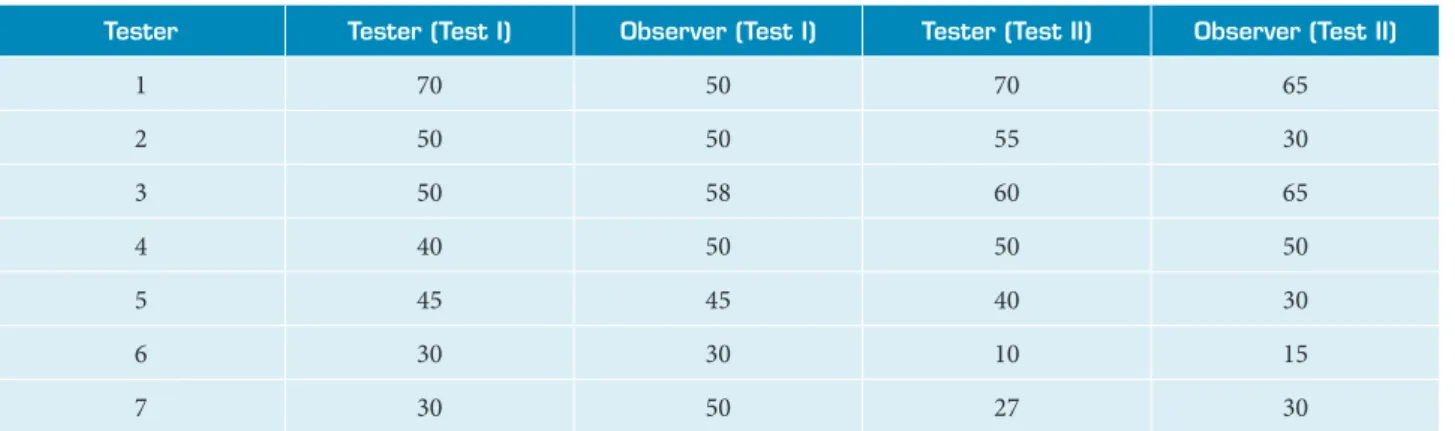
Table 8 shows that users can evaluate and remember correctly the remaining battery level of charge at the end of the test. his means that also in a high MW environment (i.e. the second test), this feature enhance pilot’s SA and satisfy the pilot’s mental demands.
Also, the future-position indicator (that was improved because of the IRR deinition) was perceived correctly by the testers (Table 9).
From this comparison, it appears that the tester perception of the future position indication was better in the second test: this could be derived from the increase in their mental demands, thus the elements of the GUI that reduce their workload are more evident.
Another element that has been evaluated is the map: in Table 10, the testers’ subjective assessment of the red marker used for obstacle detection is given. he results highlight a slightly increase in testers usage and perception of these elements in the second test. his leads toward two diferent assumptions: the irst one is that, with an increase in the MW, testers have to improve their perception using the map elements more frequently, while the second one is that, during the irst test, the performance pressure on testers was too low to force them to actively use the GUI at its maximum.
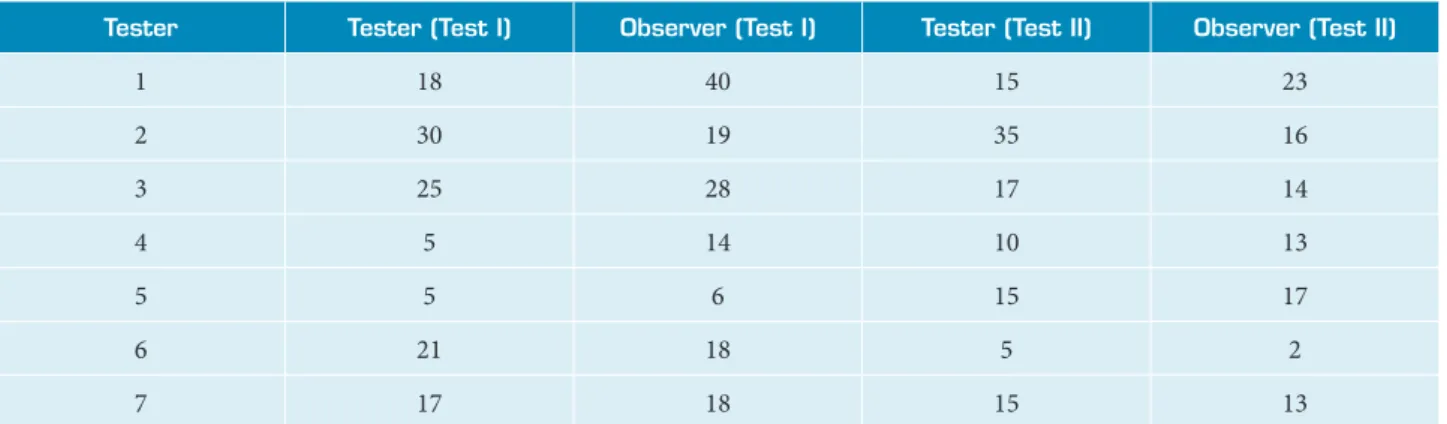
In Table 11, the wheel skid counter has been reported: this was the secondary objective of the test to increase the MW of testers without conditioning their performance. If we compared this table to the observed eye motion coherence (Table 12), it is
Tester Attachment Collision (Test I) Collision (Test II) Time restriction
1 Secure Yes No Yes
2 Reserved No No No
3 Secure Yes No Yes
4 Secure No No No
5 Troubled No No No
6 Reserved No Yes No
7 Secure No No No
Table 7. Task performance test number 2.
Table 8. Battery level, test number 1 and 2.
Tester Tester (Test I) Observer (Test I) Tester (Test II) Observer (Test II)
1 70 50 70 65
2 50 50 55 30
3 50 58 60 65
4 40 50 50 50
5 45 45 40 30
6 30 30 10 15
noticeable how testers with a poor coherence (i.e., tester 1 in test I, tester 2 in test II) cannot tell the right number of skid events.
On the other hand, most of the participants have performed the secondary objective with a good level of accuracy: this means that the overall complexity of this task was correctly tuned in both of the tests.
In addition to that, the MW perceived by testers were paired with their eyes movement coherence as detected by
Table 10. Red marker obstacle detection on map.
Tester Test I Test II
1 Poor Good
2 Good Good
3 Good Good
4 Good Average
5 Average Average
6 Good Good
7 Good Good
Tester Tester (Test I) Observer (Test I) Tester (Test II) Observer (Test II)
1 18 40 15 23
2 30 19 35 16
3 25 28 17 14
4 5 14 10 13
5 5 6 15 17
6 21 18 5 2
7 17 18 15 13
Table 11. Wheel Skid counter.
Tester Tester (Test I) Observer (Test I) Tester (Test II) Observer (Test II)
1 Average Poor Average Average
2 High Very Poor Low Very Poor
3 Average Very Good Average Average
4 Low Good Low Average
5 High Very Good High Poor
6 High Good High Very Poor
7 Average Average Average Average
Table 12. Mental Workload and tester coherence.
observers (Table 12): it is easy to notice that testers subjected to high MW (average/high in the tester charts) most of the time have a low eyes motion coherence, which implies an overall diiculty in gaining the correct SA with regard to the current task. Furthermore, it seems that the time restriction has not inluenced the perceived MW of the testers: most of the testers found the irst test demanding, thus a further increase in their workload could have not been correctly perceived.
Tester Test I Test II
1 Good Good
2 Poor Average
3 Average Average
4 Good Good
5 Good Good
6 Poor Good
7 Average Good
CONCLUSION AND FUTURE
IMPLEMENTATION
his paper presents the development of a GUI for remote control of a rover in a planetary environment and the following testing phase to evaluate its performance regarding users’ SA and MW. he methodology used in order to deine the GUI stands out against the other approaches, because it makes the cognitive process of the user a priority in relation to the other development guidelines. Furthermore, it allows, through an iterative process, to update the HMI based on the test results. his can be done because there is a strong interconnection between the physical architecture of the system and the HMI: if tests point out that something has to be modiied, researchers can easily understand which information has to be changed and where this information is used. On the other hand, the multi-agent tests allow researchers to understand the lacks in the interface using few testers and link these results to a well-deined psychological proile. Furthermore the testing technique has proved as a feasible methodology to obtain information on the GUI efectiveness and on the operator performance in early phase design, while more complex and expensive techniques, as knowledge-based ones, cannot be used.
As research perspective:
• he information which cannot be correctly understood by testers will be revised to improve the GUI during a second and more detailed design overview;
• Involving observers is a useful improvement of test evaluation though it is important that parameters collected during tests are as objective as possible, precisely to prevent them from being distorted by factors purely individual. his will lead to the use of automatic functions that support observer rating (e.g. autonomous eyes motion capture or tracking of commands given by the pilot) in future testing phases;
• A further and more complex (i.e. using intrusive testing methodologies) research about the connection between user’s attachment style and their ability to successfully teleoperate a system has to be made.
ACKNOWLEDGEMENT
The authors would like to thank the management, the researchers and the engineering staf of hales Alenia Space Italia (COSE-Center) for the essential technical support during implementation and testing of the HMI concept.
REFERENCES
Bartholomew, K. and Horowitz, L.M., 1991, “Attachment styles among young adults: A test of a four-category model”. Journal of Personality and Social Psychology, Vol. 61, No. 2, pp. 226-244. doi:10.1037/0022-3514.61.2.226.
Biesiadecki, J.J., Leger, P.C. and Maimone, M.W., 2007, “Tradeoffs Between Directed and Autonomous Driving on the Mars Exploration Rovers”. International Journal Of Robotic Research, Vol. 26, No. 1, pp. 91-104. doi: 10.1177/0278364907073777.
Bowlby, J., 1973, Attachment and loss. Vol. 2, Separation. New York.
Bruni, R., 2004, “Nuovi scenari della genitorialità: la famiglia tra affetti e legami”. Istituto Italiano di Medicina Sociale-Azioni di sostegno alla genitorialità, pp. 145-184.
Burridge, R.R. and Hambuchen, K.A., 2009, “Using prediction to enhance remote robot supervision across time delay”. IEEE/RSJ International Conference on Intelligent Robots and Systems (IROS). doi: 10.1109/IROS.2009.5354233.
Card, S.K., Moran, T.P. and Newell, A., 1983. The psychology of human-computer interaction. Lawrence Erlbaum Associates Inc. NJ.
Chu, R.W., Mitchell, C.M. and Jones, P.M., 1995 “Using the operator function model and OFMspert as the basis for an intelligent tutoring system: towards a tutor/aid paradigm for operators of supervisory control systems”. IEEE Transactions on Systems, Man and Cybernetics, Vol. 25, No. 7, pp. 1054-1074. doi: 10.1109/21.391287.
Corujeira, J., 2013, “A situation awareness interface for a bi-wheeled industrial hovercraft: design, development and evaluation”. Master Thesis, Universidade de Madeira, Funchal, Portugal.
Eberts, R.E., 1994, “User Interface Design”. Engelwood Cliffs. Prentice Hall, NJ.
Elm, W.C., Potter, S.S., Gualtieri, J.W., Easter, J.R. and Roth, E.M., 2003. “Applied Cognitive Work Analysis: A Pragmatic Methodology for Designing Revolutionary Cognitive Affordances”, In: Hollnagel, E. (Ed.), Handbook for Cognitive Task Design, Lawrence Erlbaum Associates, London, pp. 357-382.
Endsley, M.R., 1995a, “Measurement of SA in dynamic systems”. Human Factors: The Journal of the Human Factors and Ergonomics Society, Vol. 37, No. 1, pp. 65–84. doi: 10.1518/001872095779049499.
Endsley, M.R., Sollenberger, R. and Stein, E., 2000, “Situation Awareness: a Comparison of Measures”. Proceedings of the Human Performance, Situation Awareness and Automation: User-Centered Design for the New Millennium.
Gordon, S.E. and Gill, R.T., 1997, “Cognitive Task Analysis”, In: Zsambok, C.E., Klein, G. (Eds.), Naturalistic Decision Making, pp. 131-140.
Hashimoto, S., Ishida, A., Inami, M. and Igarashi, T., 2011, “TouchMe:
An Augmented Reality Based Remote Robot Manipulation”. The 21st International Conference on Artiicial Reality and Telexistence, Proceedings of ICAT2011, Osaka.
Hutchins, E.L., Hollan, J.D. and Norman, D.A., 1985, “Direct manipulation interfaces”. Human Computer Interaction, Vol. 1, No. 4, pp. 311-338. doi: 10.1207/s15327051hci0104_2.
Narayanan, S., Ruff, H.A., Edala, N.R., Geist, J.A, Patchigolla, K.K, Draper, M. and Haass, M., 2000, “Human-integrated supervisory control of uninhabited combat aerial vehicles”. Journal of Robotics and Mechatronics, Vol. 12, No. 6, pp. 628-639.
Nielsen, J., 1994, “Usability Inspection Methods”. Conference Companion on Human Factors in Computing Systems, pp. 413-414. doi: 10.1145/259963.260531.
Norris, J.S., Powell, M.W., Fox, J.M., Crockett, T.M. and Joswig,
J.C., 2009, Cliffbot Maestro, NASA Tech Briefs.
Okura, F., Ueda, Y., Sato, T. And Yokoya, N., 2013, “Teleoperation of mobile robots by generating augmented free-viewpoint images”. IEEE/RSJ International Conference on Intelligent Robots and Systems (IROS), pp. 665-671. doi: 10.1109/IROS.2013.6696422.
Paas, F., Renkl, A. and Sweller, J., 2004, “Cognitive Load Theory: Instructional Implications of the Interaction between Information Structures and Cognitive Architecture”. Instructional Science, Vol. 32, No. 1-2, pp. 1-8. doi: 10.1023/B:TRUC.0000021806.17516.d0.
Rasmussen, J., 1983, “Skills, rules, and knowledge; Signals, signs, and symbols, and other distinctions”.IEEE Transactions on Systems, Man and Cybernetics, Vol. 13, No. 3, pp 257-266. doi: 10.1109/ TSMC.1983.6313160.
Rasmussen, J., 1986, “Information Processing and Human-machine Interaction: An Approach to Cognitive Engineering”. System Science
and Engineering, Elsevier Science, New York.
Rasmussen, J. and Vicente, J.K., 1989, “Coping with human error through system design: Implications for ecological interface design”. International Journal of Man-Machine Studies, Vol. 31, No. 5, pp. 517-534. doi:10.1016/0020-7373(89)90014-X.
Ricco, C., 2009, “La matrice relazionale del sé: fallimento genitoriale e trauma evolutivo nei igli”. In: Borgogno, F., Vigna Taglianti, M. (a cura di), Identiicazione e trasmissione psichica fra gli adulti e il bambino. Quaderni di Psicoterapia Infantile, Borla, Roma.
Störrle, H., 2010, “Model Driven Development of User Interface Prototypes: An Integrated Approach”. Technical University of Denmark, Copenhagen, Denmark.