*e-mail: [email protected]
1. Introduction
Metallic foams are being studied as prospective materials with signiicant potential due to its favourable strength-density ratio which presents advantages for the development of components for the transportation industry. Such features as high energy absorption capacity combined with low density are interesting for use in stiffness related parts and passive safety structures1.
Weight reduction in the transportation industry is currently a major force driving for material and manufacturing developments. Weight reduction in vehicles cannot reduce passenger safety therefore meaning that the materials used cannot compromise stiffness and strength. Thus, it is important to correctly determine the behaviour and properties of new materials to be used in vehicles2.
Low density, high strength and excellent energy absorption in compression are favourable characteristics of metal foams that are important for the development of impact-related parts and maintaining or improving passive safety. Due to this excellent performance, there is a need for continuous improvement and to reine their manufacturing processes and production3.
Metal foams show a dependency of mechanical behaviour on factors such as structure of cells, density and properties of the base material and thickness of intricate internal walls. The eficiency obtained in the use of metallic foams in structural applications requires a detailed characterization of its deformation behaviour for different loads and different geometries. The size and shape of the cells or pores determines their properties, namely their behaviour depends on how the solid is distributed in the porous structure4,5. The manufacturing of components with precise tolerances and fracture behaviour of thin-walled parts are challenging with the currently available processes
for production of metal foams and cellular materials6. The production of a foam with controlled hole geometry, size and distribution is, therefore, an important challenge and allows the possibility to adapt the material properties to the in service speciic solicitations.
This paper presents a study on the development of a manufacturing process suitable for the production of aluminium metal foams with controlled geometry and properties. The foams are of open cell type and manufactured using a process of lost wax casting while recurring to 3D printing for the internal geometry deinition. With development and validation of process parameters this method has proven usefull for manufacturing cellular structures with precisely deined geometry7,8 eventually allowing further optimization of geometrical structure for mechanical loading.
2. Materials and Experimental Methods
2.1. Materials
In this study, a commercial AlSi12 alloy (A413.1) was used for the trial manufacturing process development and metal foam prototypes. The composition of the alloy is presented in Table 1. This alloy was chosen based on previous experience with casting having shown good properties for ine tuning of the manufacturing process.
The resin used in the rapid prototype (RP) machine was a photosensitive resin, DC 500 [DWS S.r.l., Zané, Italy], that is speciically designed to allow the production of high-deinition, detailed parts and smooth surfaces. The composition of the resin can be found in Table 2.
A commercial gypsum [Ranson& Randolph, Ultra-Vest, Maumee, OH, USA] was used in the lost wax casting as investing material. The composition of the gypsum is presented in Table 3.
Process Development for Manufacturing of Cellular Structures
with Controlled Geometry and Properties
Paulo Pintoa, Nuno Peixinhoa*, Delim Soaresa, Filipe Silvaa
aCentre for Mechanical and Materials Technologies – CT2M, Universidade do Minho, Azurém, 4800-058 Guimarães, Portugal
Received: April 2, 2014; Revised: April 5, 2015
This study presents experimental results on the behaviour of aluminium alloy metal structures and foams manufactured by lost-wax casting and using 3D printed components for internal structure deinition. Results for tensile tests, metallurgical properties, surface quality and geometry tolerances were obtained and discussed. The analysis focused on development geometries, used for adjusting manufacturing parameters and prototype geometries intended for geometrical and mechanical validation. The results are indicative of the viability of the method for producing foam structures suitable for mechanical loading.
geometry (Figure 1) the useful area considered (22.5mm in length and 16.7mm width) comprises cells with quadrangular shape and with walls of three different circular sections –1.0, 0.7 and 0.4 mm in diameters (Figure 1a, Figure 1b and Figure 1c, respectively). It was also designed a spiral model with 8mm in height and 4 revolutions in order to analyze the luidity of the metal. The section of the spiral’s model has 0.5mmdiameter (Figure 2).A three-dimensional model was, also, developed as shown in Figure 3. This sample is based in a base geometry of stacking of spheres with a diameter of 4 mm. This sample was used to study the effect of each process step on sample size and geometry.
2.2.2. Resin specimens
The obtained models in CAD software were exported to a stereolithography (STL) machine [Digital Wax 008, DWS S.r.l., Zané, Italy]. Standard build parameters were
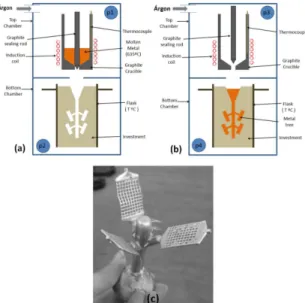
in a graphite crucible at 635 °C on the top chamber under argon atmosphere (p1 = patm) while the lask was placed in the bottom chamber under vacuum (p2=0,1mbar) at different temperatures – T1=300 °C, T2=350 °C and T3=400 °C (Figure 4a).After the alloy’s melting, an over pressure of 0.75bar (p3) was added to the top chamber followed by the pouring of the metal at 635 °C (Figure 4b) into the mold cavity (p4=0,1mbar), thus recreating the original wax/resin tree with a metal replica (Figure 4c).
2.2.4. Investment removal
After each casting process, when the mold reached 500 °C was inserted into a water container at room temperature that caused the disintegration of the investment. The residual investment in the metal tree was removed in an ultrasonic water cleaner for 10 minutes.
2.2.5. Tensile tests
In order to analyze mechanical properties, the development geometry specimens were submitted to uniaxial tensile tests using a displacement rate of 0.5 mm/min. Tests were performed in a universal testing machine (Tinius Olsen, Model H100KS, USA) at room temperature and ambient air. The load information was obtained from the calibrated load cells on the tensile machine.
2.2.6. Metallurgical properties
Metallurgical properties were analyzed in all processing conditions and in three different zones [Zone 1 - Z1; Zone 2 - Z2; Zone 3 - Z3 identiied in Figure 5] of the developed geometry specimens (Figure 5) using an optical microscope [Axiotech, Carl Zeiss, USA].The images were analyzed using image analysis software (Image J).
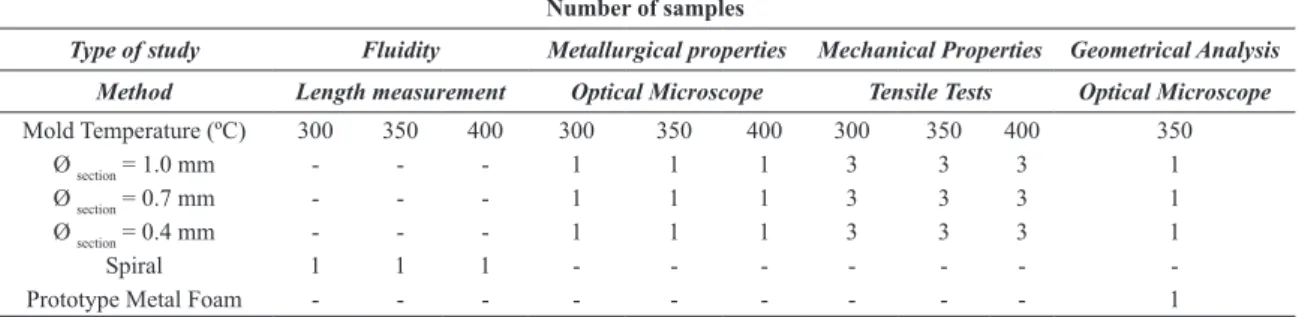
Table 4 shows the number of specimens used in each type of study and method. For the luidity analysis one Spiral specimen was used for each mold temperature. For the development geometry, metallurgical properties were performed in three different section diameters in each mold temperature and for the tensile tests three specimens were
Table 1. Composition of the A413.1 aluminium alloy (wt.%)
(according to the manufacturer).
Element Si Cu Fe Mg Mn Zn Ni Al
Wt. % 11.0-13.0 1.0 1.0 0.10 0.35 0.40 0.50 balance
Table 2. Composition of the DC 500 resin (wt.%) (according to
the manufacturer).
Element Multi-functional
acrylic monomers
Crystalline Silica Cristobalite
Radical
photoinitiator
wt.% 70-90 10-30 0.5-3
Table 3. Composition of the R&R Ultra-Vest gypsum (wt.%)
(according to the manufacturer).
Element Silica QuartzCrystalline High molecular polyol Calcium SulfateHemihydrate
wt.% < 50 > 30 < 40
Table 4. Number of samples used in each type of study.
Number of samples
Type of study Fluidity Metallurgical properties Mechanical Properties Geometrical Analysis
Method Length measurement Optical Microscope Tensile Tests Optical Microscope
Mold Temperature (ºC) 300 350 400 300 350 400 300 350 400 350
Ø section = 1.0 mm - - - 1 1 1 3 3 3 1
Ø section = 0.7 mm - - - 1 1 1 3 3 3 1
Ø section = 0.4 mm - - - 1 1 1 3 3 3 1
Spiral 1 1 1 - - -
used for each type of different section diameter and mold temperatures. For both the development geometry and one metal foam prototype a geometrical analysis was carried out using an optical microscope [Axiotech, Carl Zeiss, USA] to obtain micrographs at different zones of the specimens.
3. Results and Discussion
3.1. Geometrical analysis of the developed
geometry
In order to evaluate the surface quality of the processed samples, at the different process stages, thickness and cellular perimeter measurements were obtained from CAD, resin and metal samples.
Table 5 presents the sample size evolution from CAD to the prototype model and the results exhibit an oversizing in this process stage. It also shows, for this kind of geometry, the accuracy loss of the prototype machine with the section wall diameter increasing. Therefore, this process stage affects resin prototypes models and consequently the inal metal sample.
In Figure 6 and Figure 7a comparison is presented between the obtained cells type in different zones of the sample, in the prototyping process and in the casted samples, respectively. Figure 6 highlights that prototyping process may reveal some imperfections such as surface roughness and Figure 7 reveals some castings defects. There is no geometry variation when different zones of the specimens were analyzed.
In order to evaluate surface inishing, several measurements were made in the internal cells perimeter of the resin and casted samples. The results of these measurements are presented in Figure 8. As expected, when the section diameter is higher, the cellular perimeter is smaller for all resin and metal samples. By analyzing cellular perimeter of the resin samples it was
Figure 1. Developed geometries used in this study.
Figure 2. Spiral model (H=8.0mm; Revolutions=4; Øsection=0.5mm).
Figure 3. Prototype metal foam structure and inal dimensions.
Figure 4. Shematic of lost wax casting procedure [(a) and (b)] used
to obtain the metallic specimens of the development geometry and the metal foam prototype (c).
Figure 5. Detail of metallurgical analysis zones in sample according
veriied a higher standard deviation which may be related with the supericial roughness caused by the prototyping process. Regarding the cellular perimeter obtained for the metal samples at different mold temperatures, it was observed that the perimeter decrease in comparison with the resin samples, which may be related with the material contraction on solidiication and surface roughness attenuation caused by the liquid viscosity on casting. For each section diameter the change on the mold temperature doesn’t signiicantly changes
the cellular perimeter. Therefore, for the tested pre-heating temperatures, the initial mold temperature does not appear to be a relevant variable for the inal surface quality.
The luidity of the used alloy was evaluated by length measurement of the casted spiral in the three different mold temperature conditions being the results presented in Table 6. As expected, at a lower initial mold temperature (300 °C) was obtained the shorter spiral length illing (23,56mm), which is caused by the faster liquid metal cooling. Thus, the metal illing capability will increase if the mold temperature rises as shown by the results on Table 6.
3.2. Geometrical analysis of the
three-dimensional metal foam prototype
In order to analyze the geometry changes occurring in the manufacturing steps of the metal foam prototype, starting from the CAD models (Figure 9a), to resin models (Figure 9b) and inally the casted sample (Figure 9c), a dimensional inspection was performed to the cross sectioned structures. The measurement data presented resulted from the average of six measurements.
Table 7 presents measurements for the diameters d1, d2 (Figure 9a) and theirvariation percentage for the various productions steps, i.e. from the CAD model to resin model and from resin model to the metal sample. Results showed that the holes with smaller diameter (d1) displayed shrinkage percentages in the range of ~5,7% in CAD-resin transition and expansion percentage in the range of ~9,1% in resin-metal transition.On the other hand, holes with larger diameters (d2) displayed ~8,9% of shrinkage percentage in CAD-resin transition. The differences displayed in resin to metal transitionmay be related to the geometric complexity and to the prototyping machine accuracy. It is worth to
Table 5. Prototype oversizing percentage resulted from the prototype
process comparing with the CAD models.
Prototype internal perimeter cell oversizing [%]
Øsection = 0.4 mm Øsection = 0.7 mm Øsection = 1.0 mm
+8.5 +17.1 +24.4
Figure 6. Prototyped model cells in deined sample zone 1 a), zone 2 b) and zone 3 c) for the wall section diameter of 0.4 mm. The arrow
shows the pouring direction.
Figure 7. Metal sample cell in deined zone 1 a), zone 2 b) and zone 3 c) for the wall section diameter of 0.4 mm and pouring temperature
of 635 °C. The arrow shows the pouring direction.
Figure 8. Average cellular perimeter of resin samples and metallic
mention that the resin model undergoes two solidiication processes: irst, at the time of the construction of the model in the LASER rapid prototyping machine; and second, at the curing stage in the ultraviolet curing unit.Regarding the resin model-metal model transition, the hole expansion was ~4,6%. Data showed that the prototyping stage leads to a sample oversizing and the solidiication process (metal shrinkage) during the casting leads to a hole expansion.
From the data of Table 1 it was possible to illustrate the geometrical behaviour (Figure 10) of the smaller holes [d1 variation – (a)] and larger holes [d2 variation (b]) on the cellular structure. Regarding CAD model-Metal model transition, holes with smaller diameter (d1) displayed an expansion percentage in the range of ~2,9% and holes with larger diameters displayed shrinkage percentages in the range of 4,7%.
3.3. Metallurgical properties
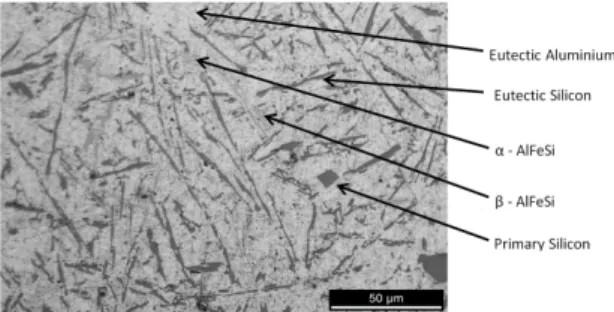
Figure 11 shows a microstructure of a sample having a section diameter of 1mm, poured at a temperature of 635 °C in a mold at 350 °C, in which are indicated the alloy phases present: the (Al) solid solution phase; eutectic silicon and intermetallic precipitates (compounds of aluminum, iron and silicon) which are presented in classic α phase form or
needles (β phase).Some primary silicon particles are, also, detected, so this commercial alloy is slightly hypereutectic (>12% Silicon). These blocks of primary silicon could be detrimental to the mechanical properties especially in small diameter samples, where the presence of larger blocks combined with poor dispersion along the structure can cause a local weakening.
3.3.1 Evaluation of the eutectic silicon size with the section diameter variation
When making a comparison between the samples processed under the same conditions but having different section diameters (Figure 12) it can be seen that the sample
Table 6. Spiral length metal illing with different initial mold
temperatures.
Mold Temperature (ºC) 300 350 400
Spiral length [mm] 23.56 31.41 62.83
Figure 9. Production steps of the three-dimensional metal foam prototype started with the CAD model design (a); was followed by the
production of the resin model in a stereolitography laser machine (b); and ended with the casted sample (c).
Table 7. Measurements for the diameters d1, d2 and their variation
percentage for the various productions steps.
d1 d2
CAD Model 1.74 mm 4.00 mm
Resin Model 1.64 mm 3.65 mm
Metal Model 1.79 mm 3.81 mm
CAD-Resindiameter variation -5.7% -8.9%
Resin-Metaldiameter variation +9.1% +4.6%
CAD-Metaldiameter variation +2.9% -4.7%
Figure 10. Geometry changes occurring in the manufacturing steps
(CAD-Resin-Metal)of the smaller holes [d1 variation – (a)] and larger holes [d2 variation (b]) in the cellular structure.
Figure 11. Microstructure of a sample with a wall section diameter
with the smaller wall section diameter (0.4mm) display a iner microstructure.
Thus, it is observed that when the section diameter decreases the grain reinement is more visible. This occurs because thinner parts take less time to solidify, leading to iner structures. In these cases the alloy’s components have smaller dimensions because of the faster solidiication rate (with an increase of the nucleation rate). This is evidenced by the data shown in Table 8where it can be observed that the average length of the eutectic silicon lamella decreases with decreasing of the section diameter of the samples. Moreover this decrease occurs in an accentuated way from the 0.7 mm to the 0.4mm wall section diameter sample, but less signiicantly between from sample of 0.7 mm to 1mm wall section diameter, with no considerable reinement of the structure. Obtaining a iner structure generally leads to an improvement of the mechanical properties of the material by ductility increasing. Thus, it is expected an improvement of mechanical properties with the decrease of the nominal section diameter of the samples.
As an extension of Table 8, Figure 13 shows the eutectic silicon length dispersion on the three different section diameter samples. It is observed that smaller samples (section diameter 0.4mm) display smaller eutectic silicon lengths below 20 µm. In the samples with higher section diameters (0.7 and 1.0 mm) the eutectic silicon dimensions have higher variation.
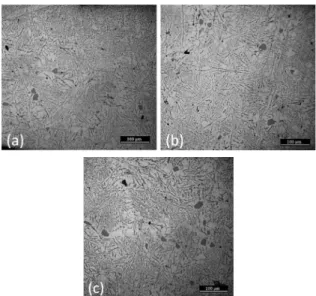
3.3.2. Evaluation of the eutectic silicon size with mold temperature variation
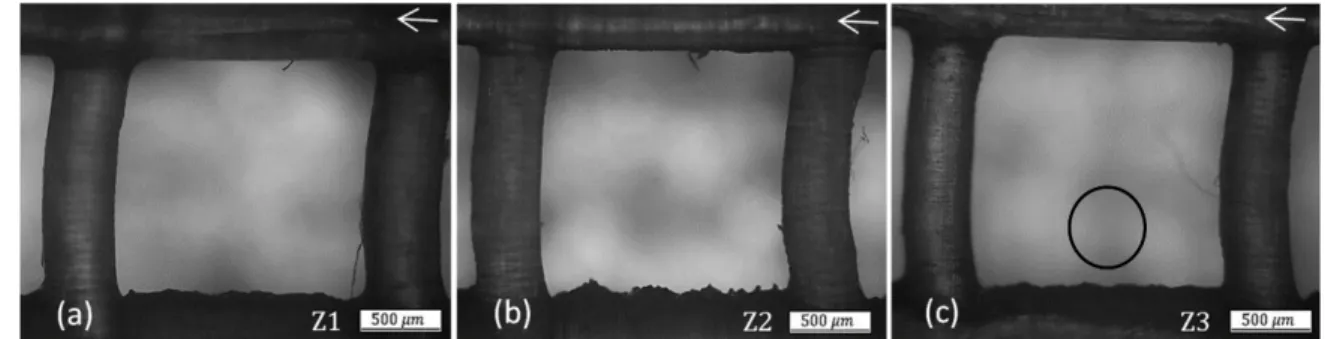
Figure 14 shows the samples microstructures poured at 635ºC with a section diameter of 0.7mm for different mold temperatures: (a) 300 °C, (b) 350 °C and (c) 400 °C, on Zone 2. Comparing the pictures from Figure 14 it can be observed that the lower mold temperature (Figure 14a) leads to a grain reinement. This grain reinement is due to the fact that when the molten metal is poured into a mold at a speciic
temperature there will be heat transfer from the metal to the mold. Thus, the greater the temperature difference between the molten metal and mold, the greater the energy transfer between them, therefore the greater the solidiication rate of the metal leading to a iner structure. It is also observed the presence of dendrites in the sample whose mold temperature was 300 and 350 °C (Figure 14.a and Figure 14.b). The formation of dendrites in the structure occurred when there was a higher temperature difference between metal and mold, i.e. when the solidiication rate is higher. This phenomenon is explained by the fact that for high super cooling levels the dendritic structures rate formation is higher than the rate formation of the eutectic silicon phase, which results in the appearance of dendrites in the structure9. As
Figure 12. Microstructures of samples poured at 635 °C in a mold
at 350 °C for different wall section diameters: (a) 0.4 mm, (b) 0.7
mm and (c) 1mm - [Zone 2].
Figure 13. Eutectic silicon numeric fraction variation of samples
poured at 635 °C in a mold at 350 °C for different sample wall
section diameters: 0.4 mm, 0.7 mm and 1.0 mm - [Zone 2].
Figure 14. Microstructures of samples poured at 635 °C with a
section diameter of 0.7mm for different mold temperatures: (a)
the eutectic silicon has worst mechanical properties than the modiied silicon structures, it is expected that dendritic structures get more ductility leading to an improvement in mechanical properties.
Analyzing eutectic silicon average length values in Table 9, it is possible to conirm that there was grain reinement with the decrease of mold temperature. The results presented in Figure 15 also conirm grain reinement with the mold temperature decrease and furthermore show the eutectic silicon length luctuation on the different processed samples. It is observed that at 400ºC of mold temperature the eutectic silicon length luctuation is higher leading to a coarse structure due to a slower solidiication rate of the molten metal.
3.3.3. Evaluation of the eutectic silicon size with sample zone variation
Figure 16 shows the microstructure for the sample with a section diameter of 0.7 mm, poured at 635 °C, in a mold temperature of 350 °C assessed in different zones: (a) Zone 1; (b) Zone 2 (c) Zone 3, in order to evaluate the variation of the microstructure along the sample. Thus, as shown in Figure 16, there are no signiicant differences in the different sample’s zones.
In general, all the results show grain reinement with the mold temperature and section diameter decrease leading to a smaller dimension of the alloy’s components, although in the different zones of the sample the dimensions of the components are the same. The dendrites appearance occurs only when the difference between molten metal and mold temperature is higher (mold at 300 °C and 350 °C) and is expected an improvement in mechanical properties. It’s pertinent to refer the presence of casting defects, such as sink marks and microporosity, in all processed samples, which are expected to negatively affect the mechanical properties.
3.4. Tensile tests
The development geometry prototypes (Figures 1 and 5) were submitted to tensile tests through established procedures. From the tensile tests it was possible to obtain stress-strain curves that allow the observation of the sample behaviour and the tensile strength determination. This tensile strength can be regarded as the maximum stress that the sample can withstand without rupture.
Observing the broken specimens (Figure 17) and stress-strain curves in Figure 18 (representative for all process conditions) it is veriied that the samples had essentially brittle behaviour. It is noted at the beginning of the test, a region where deformation is linear, corresponding to the region of elastic behaviour of the material and inally reaches to a maximum stress, being also considered as the tensile
Table 9. Eutectic silicon average length of samples poured at 635 °C
with a section diameter of 0.7mm for different mold temperatures:
300 °C, 350 °C and 400 °C - [Zone 2].
Mold Temperature
[ºC] 300 350 400
Average length of
eutectic silicon [µm] 16.20±7.06 18.23±6.95 24.89±11.57
Figure 15. Eutectic silicon numeric fraction variation of samples
poured at 635 °C with a section diameter of 0.7mm for different
mold temperatures: 300 °C, 350 °C and 400 °C - [Zone 2].
Figure 16. Microstructures of a sample with a section diameter of
0.7 mm, poured at 635 °C, in a mold temperature of 350 °C assessed
in different zones: (a) Zone 1; (b) Zone 2 (c) Zone 3.
Figure 17. Representative igure of broken sample with 0.7mm
section diameter.
Figure 18. Stress-Strain curve of samples poured at 625 °C into a
strength of the sample. The absence of necking zone reveals a non-ductile behaviour of the samples.
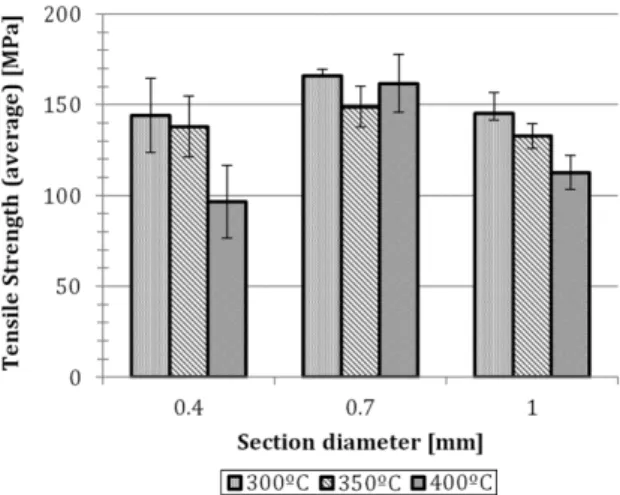
Figure 19 shows the average tensile strength for different section diameters (0.4mm, 0.7mm and 1.0mm) and different mold temperatures (300 °C, 350 °C and 400 °C) and reveals the 0.7 mm samples as the ones with better mechanical behaviour. As expected, the mechanical properties have improved with the section diameter reduction from 1.0mm to 0.7 mm in all mold temperatures used. This improvement is related with the grain reinement that the 0.7 mm sample is subject to. It is noted that the samples with section diameter of 0.4mm had the worst mechanical behaviour in spite of showing the inest microstructure. This may be related to casting defects found, such as sink marks and microporosity, which have a higher contribution for mechanical properties degradation while comparing to samples with higher diameter. Considering a Yield Strength of 140 MPa for A413.1 bulk alloy (2.61 g/cm3) and a mean value of 125 MPa for the produced cellular foam (1,49 g/cm3) there is an increase of speciic strength of 54,5%/g for the cellular material.
4. Conclusions
This study presents the development of a manufacturing process suitable for the production of aluminium metal foams with controlled geometry and properties. The foams are of open cell type and manufactured using a process of lost wax casting while recurring to 3D printing for the internal geometry deinition. Besides material and process description, results for geometrical, metallurgical and tensile test analysis are
The metallurgical analysis highlighted that when the section diameter decreases grain reinement is more visible. Grain reinement also occurs with mold temperature decrease. It was also shown that eutectic silicon length dispersion on smaller samples (section diameter 0.4mm) is smaller (lengths below 20 µm) while in the samples with higher section diameters (0.7 and 1.0 mm) the eutectic silicon dimensions have higher variation. Furthermore, eutectic silicon length luctuation was observed with different mold temperatures. It was noted that at 400 °C of mold temperature the eutectic silicon length luctuation is higher leading to a coarser structure due to a slower solidiication rate of the molten metal. It is pertinent to refer the presence of casting defects, such as sink marks and micro porosity, in all processed samples, which are expected to negatively affect the mechanical properties.
Tensile properties were analyzed for different section diameters (0.4mm, 0.7mm and 1.0mm) and different mold temperatures (300 °C, 350 °C and 400 °C) and revealed the 0.7 mm samples as the ones with better mechanical behaviour. Samples with section diameter of 0.4mm had the worst mechanical behaviour in spite of showing the inest microstructure which was related to casting defects found, such as sink marks and micro porosity that can have a higher contribution for mechanical properties degradation while comparing to samples with higher diameter.
The development and validation of process parameters by the presented method was analyzed in view of geometrical, metallurgical and strength properties. The results are indicative of the viability of the method for producing foam structures suitable for mechanical loading. It can also be used for manufacturing cellular structures with precisely deined geometry eventually allowing further optimization of geometrical structure for mechanical loading.
Acknowledgements
The authors are grateful to the Portuguese Foundation for Science and Technology (FCT) who inancially supported this work, through the project PTDC/EME-PME/115668/2009.
References
1. Banhart J. Manufacture, characterisation and application of cellular metals and metal foams. Progress in Materials Science. 2001; 46(6):559-632. http://dx.doi.org/10.1016/
S0079-6425(00)00002-5.
2. Song H, Fan Z, Yu G, Wang Q and Tobota A. Partition energy absorption of axially crushed aluminum foam-filled hat sections.
International Journal of Solids and Structures. 2005; 42(9– 10):2575-2600. http://dx.doi.org/10.1016/j.ijsolstr.2004.09.050.
Figure 19. Average tensile strength for different section diameters
(0.4mm, 0.7mm and 1.0mm) and different mold temperatures (300 °C, 350 °C and 400 °C).
3. Banhart J. Metallic foams: challenges and opportunities. In: Zitha P, Banhart J and Verbist G, editors. Proceedings Eurofoam2000.
Bremen: MIT-Verlag; 2000. p. 13-20.
4. Olurin O, Fleck N and Ashby M. Deformation and fracture
of aluminium foams. Materials Science and Engineering A. 2000; 291(1-2):136-146. http://dx.doi.org/10.1016/S0921-5093(00)00954-0.
modified cellular geometry. Journal of Materials Processing Technology. 2014; 214(3):571-577. http://dx.doi.org/10.1016/j.
jmatprotec.2013.11.011.
6. Smith B, Szyniszewski S, Hajjar J, Schafer B and Arwade S. Steel
foam for structures: a review of applications, manufacturing and material properties. Journal of Constructional Steel Research. 2012; 71:1-10. http://dx.doi.org/10.1016/j.jcsr.2011.10.028.
7. Matz A, Mocker B, Muller D, Jost N and Eggeler G. Mesostructural design and manufacturing of open-pore metal foams by investment
casting. Advances in Materials Science and Engineering. 2014; 2014:421729. http://dx.doi.org/10.1155/2014/421729.
8. Cingi C, Niini E and Orkas J. Foamed aluminum parts by
investment casting. Colloids and Surfaces. A, Physicochemical and Engineering Aspects. 2009; 344(1-3):113-117. http://dx.doi.
org/10.1016/j.colsurfa.2009.01.006.
![Figure 14. Microstructures of samples poured at 635 °C with a section diameter of 0.7mm for different mold temperatures: (a) 300 °C, (b) 350 °C and (c) 400 °C - [Zone 2].](https://thumb-eu.123doks.com/thumbv2/123dok_br/18882175.422911/6.765.397.715.464.773/figure-microstructures-samples-poured-section-diameter-different-temperatures.webp)