*e-mail: [email protected]
1. Introduction
The surface tension measurement following the maximum pressure bubble method (MPBM) is based on the determination of the pressure difference inside and outside of an air bubble at the moment the bubble is detached from the immersed end of a capillary, as shown in Figure 1. This method has been known for more than 160 years. Simon1 began to use it around 1851, and it is a practical
method which allows to achieve very good results with low dificulty.
The expression which relates the liquid surface tension with the pressure difference is obtained by performing an analysis of the work done by the air pressure to increase the volume and the surface area of the bubble while it expands into the sample liquid Equation 1.
g =dV× ∆P
dA (1)
Where dV is the change in the volume of the bubble, dA the surface area change and ΔP the pressure difference between both sides of the interface around the bubble. In the case of a bubble forming at the end of a capillary immersed in the sample liquid, by replacing in Equation 1 the geometrical characteristics of a sphere (dV and dA), one can arrive to Equation 2
2
g = × ∆R P (2)
Where γ is the surface tension and R is the sphere radius. At the moment when the hemispheric bubble is detached from the capillary its radius is equal to capillary radius. Thus, the capillary´s radius is used as value of “R”. Equation 2 is known as Young-Laplace2 equation and is
developed for completely spherical bubbles. Bubbles with some deformation require the use of a generalized Young’s equation using the radius of curvature at each point around the bubble.
Under these experimental conditions the bubble formed at the end of a capillary is only half a bubble. Moreover, there are other experimental facts that cause deviations from the theoretical situation depicted by Equation 2 such as the effect of gravity, bubble adhesion to the capillary, particles of moisture carried by the air and turbulence generated by the growth of the bubble itself, among others. As described above, in the MPBM there is a tendency for the bubble to be deformed causing erroneous determination of the surface tension values. Bashforth and Adams2 irst and Sugden3,4
after, created a table with correction factors for small capillary radius depending on the capillary’s immersion depth and its radius. Likewise approaches have also been made to correct numerical mathematics and calculation of surface tension for large capillary radius5-7.
In this work we use the Young’s theoretical model8
and perform an experimental correction (method I). It is achieved through a calibration that results from bubble maximum pressure measurements as a function of the capillary depth and using a sample with known surface tension. As a difference with existent procedures for surface
Critical Assessment of the Surface Tension Determined by the Maximum
Pressure Bubble Method
Franco Emmanuel Benedettoa*, Hector Zolotuchob, Miguel Oscar Pradoa,b,c
aCentro Atómico Bariloche, Departamento Materiales Nucleares, Comisión Nacional de Energía Atómica,
San Carlos de Bariloche, Río Negro, Argentina
bConsejo Nacional de Investigaciones Cientíicas y Técnicas, San Carlos de Bariloche,
Río Negro, Argentina
cInstituto Balseiro, Universidad Nacional de Cuyo, Comisión Nacional de Energía Atómica,
Avda. Ezequiel Bustillo, Km 9,5, CP8400, San Carlos de Bariloche, Pcia. Río Negro, Argentina
Received: December 19, 2013; Revised: January 16, 2015
The main factors that inluence the value of surface tension of a liquid measured with the Maximum Pressure Bubble Method are critically evaluated. We present experimental results showing the effect of capillary diameter, capillary depth, bubble spheroidicity and liquid density at room temperature. We show that the decrease of bubble spheroidicity due to increase of capillary immersion depth is not suficient to explain the deviations found in the measured surface tension values. Thus, we propose a simple experimental procedure that allows determining the surface tension of a liquid without any previous knowledge of its density. This procedure is especially useful when the liquid of interest exhibits variations of surface tension and density with time, as for example during condensation reactions to obtain SiO2 sols from a tetraethyl ortosilicate (TEOS) solutions during their aging process.
2. Experimental Methods
For the measurement of the surface tension we made a device (Figure 3) that allows us in a controlled manner: a) Generate an air bubble inside the liquid whose γ we are interested to measure (this bubble is located at one extreme of a capillary immersed in the liquid sample) b) increase the bubble inside gas pressure c) measure ΔP between both sides of the interface around the bubble. Using a differential water manometer to measure internal bubble pressure (hm.ρm.g) and a micrometer to measure the immersion capillary depth (l) allows to calculated external bubble pressure (ρo.g.l) and
substituting in Equation 2 we get:
(
)
2
g = × m⋅ρ ⋅ − ⋅ρ ⋅m l
R
h g l g (3)
Where “hm” is the liquid manometric height, ρm is the density of manometric luid, ”l” is the depth of immersion of the capillary in the luid to be measured, ρl the density of the
liquid and g is the acceleration of gravity.
2.1. Method I
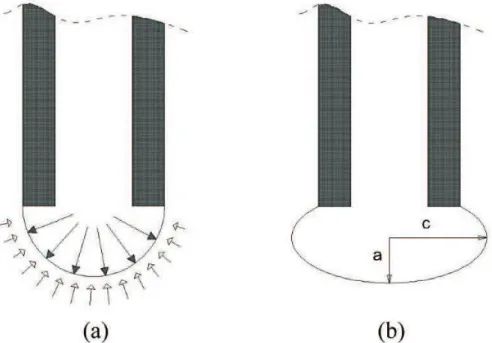
In Equation 3 we introduced a correction factor “β” to account for the bubble´s lack of spheroidicity as explained in Figure 2:
Figure 1. Diagram of the maximum pressure bubble method. Pi = internal bubble pressure and Pe = external bubble pressure.
(
)
2
g = × m⋅ρ ⋅ −β⋅ ⋅ρ ⋅m l
R
h g l g (4)
To obtain the calibration factor “β” we can rearrange Equation 4 as the linear equation:
2. . .
. .
ρ g
=
β + ρ ρ
l m
m m
h l
R g (5)
The value of β can be obtained from the slope of the straight line (Equation 5 and Figure 4),
ρ
β = × ρ
m
l
slope (6)
2.2. Method II
We also analyzed the possibility of considering the bubble as a revolution ellipsoid analytically. Then:
2 4
. . . 3 = π
V a c (7)
Replacing, c=k a. (8)
2 4. . . = π
dV k a da (9)
For the ellipsoid surface area, as a function of the radii, we used the Knud-Thomsen9 approximation:
1
. . .
4. .
3
+ +
= π
p p p p p p p
a b a c b c
A (10)
a = b (11)
1
2 2. .
4. . 3
+
= π
p p p p
a a c
A (12)
c = k.a
(
)
12 . 1 2. 4. .
3
+
= π
p
p p
a k
A (13)
(
)
(
)
11
8. . . 3 1 2. =
π + p p
dA a k da (14)
Where “p” is the constant of Knud-Thomsen, p=1.6075. Substituting Equation 9 and Equation 14 in Equation 1 we obtain:
(
)
(
)
1(
. . . .)
1 2. 31 2.
g = × ρ − ρ
+
m m l
p p
a
h g l g k
(15)
The information required for the calculations was obtained from the individual photos at the bubble detachment moment taken from the process movie recording (Figure 5a and 5b).For all the experiments described above we used distilled water, ethanol 96% v/v, acetone 99,5%, anhydrous gliceryn 99,5% and ethylenglicol pro-analysis (Glycol - 1,2-Etanodiol) for the method I and ethanol 96% v/v for method II.
The capillary radii used were 0.13 mm, 0.44 mm, 0.82 mm and 1.25 mm for the method I and 1.25 mm for method II.
The manometric luid used in all experiments was distilled water.
3. Results and Discussion
3.1. Method I: surface tension obtained by
MPBM with β correction factor
For the experiments conducted with water and ethanol, the experimental results found with and without the calibration factor “β” are shown in Table1.
The errors on the measured surface tension values increase with the increase of the capillary immersion depth and capillary diameter (see Figure 6)
The larger the radius of the capillary, the greater the bubble deformation and greater the error. The calibration factor produces a great improvement in the measurements, mainly for the capillary of 1.25 mm radius.
Figure 3. Device for measurement of surface tension.
Furthermore with the highest surface tension liquid (water) less error occurs than with the lowest surface tension (ethanol). It is expected that the higher the surface tension of the liquid, the more resistant to deformation is the bubble.
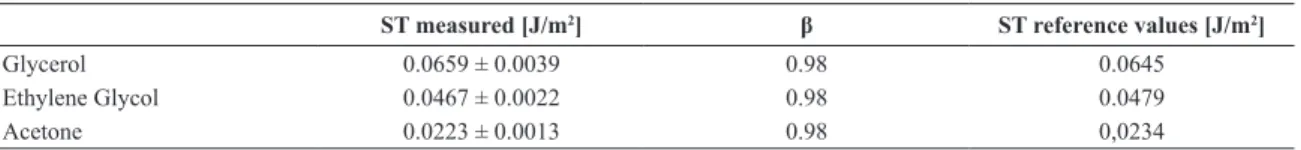
Using the proposed method, measurements of the surface tension on glycerol, ethylene glycol and acetone were also performed, using a capillary of radius 0.3 mm and a correction factor β=0.98 for all this liquid samples (Table 2). For this measurements, β was previously obtained by a calibration experiment carried out on distilled water as was described above. In Table 2 we also show experimental reference values of surface tension of these liquids found in the bibliography10. One useful result of this work is that
from the results obtained for different liquids (Table 2), we observe that the β value obtained with a distillated water calibration is the same that the β value obtained with other liquids. Except in the case when we use a 0.82 mm radius capillary, it is possible to calculate the approximate density of an unknown sample by using the value of β obtained with distillated water. Following on, from Equation 6:
ρ ρ = β× m
l
slope (16)
Figure 5. Pictures of the video recording of the experimental measurement. (a) Maximum pressure instant and (b) ellipsoidal bubble.
Table 1. Experimental values obtained for surface tension (ST) with and without correction factor “β” for different capillary diameters and relative errors (ERR%).
Capillary Sample β factor [constant]
Theoretical ST (*) [J/m2]
ST measured
without β
[J/m2]
ERR%(**)
without β ST measured using β
[J/m2]
ERR%(**)
using β
r = 1.25 mm distilled water 0.91 0.07296 0.06409 12.1 0.07169 1.7
r = 1.25 mm ethanol 96% 0.90 0.02532 0.01593 37.1 0.02487 1.8
r = 0.82 mm distilled water 0.92 0.07310 0.06819 6.7 0.07233 1.1
r = 0.82 mm ethanol 96% 0.84 0.02534 0.02109 16.8 0.02538 0.2
r = 0.44 mm distilled water 0.9 0.07306 0.07084 3.0 0.07355 0.7
r = 0.13mm distilled water 0.99 0.07327 0.07181 2.0 0.07189 1.9
(*) Calculated using Equation 18, Equation 19 and Equation 20.(**) ERR% =ST measured ST theorical − .100
ST theorical
When we obtain the “slope” by plotting the maximum gauge pressure at different depths of immersion of the capillary in the sample of unknown density, after itting a linear function, the value of the intercept (OO) allows us to calculate the surface tension value (Equation 5).
2 × ×ρ ×
g =OO R m g (17)
By the method described above we measured the change in density and surface tension of TEOS during the gelation process (Table 3). The density of a TEOS sol-gel solution prepared in this work showed a growth about 41% from its initial value. The surface tension increased about 18% (see Table 3) after the same time.
For TEOS solution preparation we used tetraethyl ortosilicate (Si(OC2H5)4) 98%, ethanol absolute (C2H5OH) 99,8% and distillated water (H2O). The solution was prepared at 40 °C. The molar relation of solution was Si(OC2H5)4/C2H5OH/ H2O = 1/6,4/1.
3.2. Method II: surface tension obtained by
MPBM with the ellipsoid bubble shape
approximation
The experimental results obtained using Equation 15 approximating the bubble shape to an ellipsoid (without using the β correction factor) and by measuring the bubble dimensions obtained in the videos recording of experiments with ethanol 96% v/v and a capillary’s radius of 1.25 mm could be divided into two groups for its analysis:
#1 - Average surface tension, for depths of capillary up to 30 mm.
#2 - Average surface tension, for depths of capillary up to 4 mm.
The relative errors (Table 4) for spherical and ellipsoidal bubble shapes were taken with respect to the theoretical value of ethanol 96% surface tension 0.254 [J/m2], which
was calculated11 at the temperature of the experiment (20°C)
with the following expressions:
. gmix=∑igi
i
x (18)
Where gmix is the surface tension of 96% ethanol-water mix and xi and gi are the fractional composition and surface tension of each component in the solution.
The surface tension of pure ethanol, between 273-373 °K can be adjusted with Equation 19 and the surface tension of water between 273-403 °K by Equation 20.
0,0046 0, 0244. −
g = T
et e (19)
3 0, 0761 0,1754.10 .−
g =w − T (20)
Where get and gw are surface tension of pure ethanol and water respectively, and T the temperature in Kelvin degrees.
4. Conclusions
According to the experimental evidence:
The error in the surface tension values measured with the described device (Figure 3) increases with the increasing of the capillary immersion depth (l).
For a ixed capillary immersion depth the error in the surface tension values measured increases with increasing capillary diameter.
4.1. Method I
The use of the proposed experimental factor (β) causes improvement substantial error decrease in the measured surface tension values. For example, the percent relative errors (Table 1) in the best case are reduced from about 37% to 2%.
Moreover the calibration obtained in this paper allows surface tension measurements with capillaries of any diameter and immersion capillary depth. This is an advantage whit respect to previously published procedures.
4.2. Method II
The use of a bubble ellipsoidal geometry in the mathematical model does improve the error obtained in measurement of surface tension using our device only for immersion capillary immersion depths up to 4 mm. (Table 4). For larger depths errors up to 30% are obtained even after applying this correction showing that other physical phenomena are taking place besides the deformation.
For both methods, the calibration constant “β” method or the bubble approximation to an ellipsoid, the error in the Table 2. Experimental results with β=0.98, for glycerol, ethylene glycol and acetona.
ST measured [J/m2] β ST reference values [J/m2]
Glycerol 0.0659 ± 0.0039 0.98 0.0645
Ethylene Glycol 0.0467 ± 0.0022 0.98 0.0479
Acetone 0.0223 ± 0.0013 0.98 0,0234
Table 3. Experimental results from gelation process of TEOS sol-gel.
Time [h] Density [Kg/m3] TS [N/m]
0 675.45 0.0231 ± 0.0003
1 871.01 0.0243 ± 0.0006
2 951.86 0.0273 ± 0.0005
Table 4. Experimental results for ethanol 96% v/v with ellipsoid geometrical approach for #1 immersion depth until 30 mm and #2 immersion depth until 4 mm.
Sample ERR% sphere ERR% ellipsoid
#1 37.1 31.7
References
1. Simon M. Recherches Sur La Capillarité. Annales de Chimie
et de Physique. 1851; 32:5.
2. Bashforth F. and Adams J. An attempt to test the Theory of Capillary Action. Cambridge University Press; 1883. 3. Sugden S. Determination of surface tension from the
maximum pressure in bubbles. Journal of the Chemical
Society. 1922; 121:858-866. http://dx.doi.org/10.1039/ ct9222100858.
4. Fainerman VB, Mys VD, Makievski AV and Miller R. Application of the maximum bubble pressure technique for dynamic surface tension studies of surfactant solutions using the Sugden two-capillary method. Journal of Colloid and Interface Science. 2006; 304(1):222-225. http://dx.doi. org/10.1016/j.jcis.2006.08.023. PMid:16978639
5. Lane JE. Correction terms for calculating surface tension from capillary rise. Journal of Colloid and Interface Science.
1973; 42(1):145-149. http://dx.doi.org/10.1016/0021-9797(73)90017-9.
6. Johnson CHJ, Lane JE. Surface shape and the calculation of surface tension from maximum bubble pressure. Journal of Colloid and Interface Science. 1974; 47(1):117-121.
7. Mysels K. The maximum bubble pressure method of measuring surface tension, revisited. Colloids and Surfaces. 1990; 43(2):241-262. http://dx.doi.org/10.1016/0166-6622(90)80291-B.
8. Adamson A and Gast A. Physical chemistry of surfaces. 6th ed. Wiley Interscience; 1997.
9. Numericana. Available from: <http://www.numericana.com/ answer/ellipsoid.htm>.
10. Lide DR. CRC Handbook of Chemistry and Physics. 90th ed. CRC Press; 2009.