Article
https://doi.org/10.1038/s41586-019-1545-0Mapping 123 million neonatal, infant and
child deaths between 2000 and 2017
Since 2000, many countries have achieved considerable success in improving child survival, but localized progress
remains unclear. To inform efforts towards United Nations Sustainable Development Goal 3.2—to end preventable child
deaths by 2030—we need consistently estimated data at the subnational level regarding child mortality rates and trends.
Here we quantified, for the period 2000–2017, the subnational variation in mortality rates and number of deaths of
neonates, infants and children under 5 years of age within 99 low- and middle-income countries using a geostatistical
survival model. We estimated that 32% of children under 5 in these countries lived in districts that had attained rates of 25
or fewer child deaths per 1,000 live births by 2017, and that 58% of child deaths between 2000 and 2017 in these countries
could have been averted in the absence of geographical inequality. This study enables the identification of high-mortality
clusters, patterns of progress and geographical inequalities to inform appropriate investments and implementations that
will help to improve the health of all populations.
Gains in child survival have long served as an important proxy
meas-ure for improvements in overall population health and development
1,2.
Global progress in reducing child deaths has been heralded as one of
the greatest success stories of global health
3. The annual global
num-ber of deaths of children under 5 years of age (under 5)
4has declined
from 19.6 million in 1950 to 5.4 million in 2017. Nevertheless, these
advances in child survival have been far from universally achieved,
particularly in low- and middle-income countries (LMICs)
4. Previous
subnational child mortality assessments at the first (that is, states or
provinces) or second (that is, districts or counties) administrative level
indicate that extensive geographical inequalities persist
5–7.
Progress in child survival also diverges across age groups
4. Global
reductions in mortality rates of children under 5—that is, the under-5
mortality rate (U5MR)—among post-neonatal age groups are greater
than those for mortality of neonates (0–28 days)
4,8. It is relatively
unclear how these age patterns are shifting at a more local scale,
pos-ing challenges to ensurpos-ing child survival. To pursue the ambitious
Sustainable Development Goal (SDG) of the United Nations
9to “end
preventable deaths of newborns and children under 5” by 2030, it is
vital for decision-makers at all levels to better understand where, and
at what ages, child survival remains most tenuous.
Precision public health and child mortality
Country-level estimates facilitate international comparisons but mask
important geographical heterogeneity. Previous assessments of
mortal-ity of children under 5 have noted significant within-country
heteroge-neity, particularly in sub-Saharan Africa
5,7,10–14, as well as in Brazil
15,
Iran
16and China
17. Understanding public health risks at more granular
subpopulation levels is central to the emerging concept of precision
public health
18, which uses “the best available data to target more
effec-tively and efficiently interventions…to those most in need”
18. Efforts
to produce high-resolution estimates of mortality of children under 5,
determinants at scales that cover the multiple countries are emerging,
including for vaccine coverage
19,20, malaria
21, diarrhoea
22and child
growth failure
23,24. In a previous study, we produced comprehensive
estimates of African child mortality rates at a 5 × 5-km scale for 5-year
intervals
5. For areas outside of Africa, in which 72% of the world’s
chil-dren live and 46% of global child deaths occurred in 2017
4, subnational
heterogeneity remains mostly undescribed
25.
Here we produce estimates of death counts and mortality rates of
chil-dren under 5, infants (under 1 years of age) and neonates (0–28 days)
in 99 countries at policy-relevant subnational scales (first and second
administrative levels) for each year from 2000 to 2017. We fit a
geo-statistical discrete hazards model to a large dataset that is composed
of 467 geo-referenced household surveys and censuses, representing
approximately 15.9 million births and 1.1 million deaths of children
from 2000 to 2017. Our model includes socioeconomic, environmental
and health-related spatial covariates with known associations to child
mortality and uses a Gaussian process random effect to exploit the
correlation between data points near each other across dimensions of
space, time and age group, which helps to mitigate the limitations
asso-ciated with data sparsity in our estimations. For this study, we report
U5MR as the expected number of deaths per 1,000 live births, reflecting
the probability of dying before the age of 5 for a given location and year.
Unequal rates of child mortality
The risk of a newborn dying before their fifth birthday varies
tremen-dously based on where in the world, and within their country, they are
born. Across the 99 countries in this study, we estimate that U5MR
varied as much as 24-fold at the national level in 2017, with the highest
rate in the Central African Republic of 123.9 deaths (95% uncertainty
interval, 104.9–148.2) per 1,000 live births, and the lowest rate in Cuba
of 5.1 deaths (4.4–6.0)
4. We observed large subnational variation within
countries in which overall U5MR was either high or comparatively
low. For example, in Vietnam, rates across second administrative units
(henceforth referred to as ‘units’) varied 5.7-fold, from 6.9 (4.6–9.8) in
the Tenth District in Hồ Chí Minh City to 39.7 (28.1–55.6) in Mường
Tè District in the Northwest region (Figs. 1b, 2).
Decreases in U5MR between 2000 and 2017 were evident to some
extent throughout all units (Figs. 1a, b, 2). No unit showed a significant
increase in U5MR in this period, and in most units U5MR decreased
greatly, even in units in which the mortality risk was the highest. Out
of 17,554 units, 60.3% (10,585 units) showed a significant (defined
as 95% uncertainty intervals that did not overlap) decrease in U5MR
between 2000 and 2017. Across units in 2000, U5MR ranged from 7.5
(5.0–10.6) in Santa Clara district, Villa Clara province, Cuba, to 308.4
(274.9–348.4) in the Sabon Birni Local Government Area of Sokoto
State, Nigeria. By 2017, the unit with the highest estimated U5MR
across all 99 countries was Garki Local Government Area, Jigawa state,
Nigeria, at 195.1 (158.6–230.9). Overall, the total percentage of units
with a U5MR higher than 80 deaths per 1,000 live births decreased from
28.9% (5,070) of units in 2000 to 7.0% (1,236) in 2017. Furthermore,
OPEN
A list of authors and their affiliations appears in the online version of the paper.
32% of units, representing 11.9% of the under-5 population in the 99
countries, had already met SDG 3.2 for U5MR with a 90% certainty
threshold (Fig. 1c). For neonatal mortality, 34% of units met the target
of ≤12 deaths per 1,000 live births (Extended Data Fig. 1). Within
countries, successes were mixed in some cases. For example, Colombia,
Guatemala, Libya, Panama, Peru and Vietnam had all achieved SDG
3.2 for U5MR at the national level by 2017, but each country had units
that did not achieve the goal with 90% certainty (Fig. 1c).
Successful reductions in child mortality were also observed
through-out entire countries. For example, in 43 LMICs across several world
regions, the worst-performing unit in 2017 had a U5MR that was lower
than the best-performing unit in 2000 (Fig. 2). Nearly half of these
countries were in sub-Saharan Africa. Rwanda showed notable progress
during the study period, reducing mortality from 144.0 (130.0–161.6)
in its best-achieving district in 2000 (Rubavu) to 57.2 (47.4–72.1) in
its worst-achieving district in 2017 (Kayonza). These broad
reduc-tions in U5MR have also led to a convergence of absolute subnational
geographical inequalities, although relative subnational inequalities
appear to be mostly unchanged between 2000 and 2017 (Fig. 2 and
Supplementary Fig. 6.12). Despite this success, the highest U5MRs in
2017 were still largely concentrated in areas in which rates were highest
in 2000 (Fig. 1a, b). We observed estimated U5MR ≥ 80 across large
geographical areas in Western and Central sub-Saharan Africa, and
within Afghanistan, Cambodia, Haiti, Laos and Myanmar (Fig. 1b).
Deaths of neonates (0–28 days of age) and post-neonates (28–364
days of age) have come to encompass a larger fraction of overall
mor-tality of children under 5 in recent years. By 2017 (Fig. 1d), neonatal
mortality increased as a proportion of total deaths of children under
5 in 91% (90) of countries and for 83% (14,656) of units compared to
2000. In almost all places where U5MR decreased, the share of the
mortality burden increased in the groups of children with younger ages.
Similarly, the mortality of infants (<1 year) has increased relative to
the mortality for children who are 1–4 years of age in many areas. For
example, in the Diourbel Region, Senegal, infant mortality constituted
54.4% (52.4–56.6) of total mortality of children under 5 in 2000; by
2017, the relative contribution of infant mortality was 73.2% (70.3–
75.8). This shift towards mortality predominantly affecting neonates
and infants was not as evident in all locations; mortality for children
aged 1–4 years was responsible for more than 30% of overall under-5
deaths in 13% (2,226) of units, mostly within high-mortality areas in
sub-Saharan Africa.
Distribution of under-5 deaths may not follow rates
The goal of mortality-reduction efforts is ultimately to prevent
prema-ture deaths, and not just to reduce mortality rates. Across the countries
studied here, there were 3.5 million (41%) fewer deaths of children
under 5 in 2017 than in 2000 (5.0 million compared to 8.5 million). At
the national level, the largest number of child deaths in 2017 occurred
in India (1.04 (0.98–1.10) million), Nigeria (0.79 (0.65–0.96) million),
Pakistan (0.34 (0.27–0.41) million) and the Democratic Republic of
the Congo (0.25 (0.21–0.31) million) (Fig. 3a). Within these countries,
the geographical concentration of the deaths of the children varied. In
Pakistan, over 50% of child deaths in 2017 occurred in Punjab province,
which had a U5MR of 63.3 (54.1–76.0) deaths per 1,000 live births
(Fig. 3b). By contrast, 50% of child deaths in the Democratic Republic
of the Congo in 2017 occurred across 9 out of 26 provinces. Such
findings are in a large part artefacts of how borders are drawn around
various at-risk populations (the provinces above account for 53% and
63%, respectively, of the under-5 population that is at risk in these two
countries), but can have a real impact at the level at which planning
occurs. Some concentrated areas with apparent high absolute numbers
of deaths highlighted by local-level estimates become less noticeable
when reporting at aggregated administrative levels; for example, areas
across Guatemala, Honduras and El Salvador are visually striking
hot-spots in Fig. 3d, but less so in Fig. 3b, c.
Our estimates indicate that targeting areas with a ‘high’ U5MR of
80 will have a lower overall effect than in previous years owing to
the reductions in mortality rates. In 2000, 23.7% of child deaths—
representing 2.0 (1.7–2.4) million deaths—occurred in regions in which
U5MR was less than 80 that year (Fig. 4). By comparison, in 2017,
69.5% of child deaths occurred in areas in which U5MR was below 80.
A growing proportion of deaths of children under 5 are occurring in
‘low’-mortality areas; 7.3% (5.1–10.2) of all deaths of children under 5
in 2017 occurred in locations in which the U5MR was below the SDG
3.2 target rate of 25, compared to 1.2% (0.9–1.6) in 2000. For instance,
Lima, Peru, has a U5MR in the 8th percentile of units in this study, yet
it ranks in the 96th percentile of highest number of deaths of children
under 5.
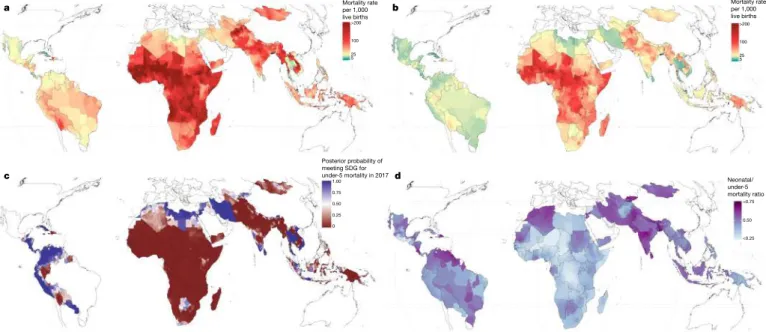
a Mortality rateper 1,000 b
live births >200 100 25 5 Mortality rate per 1,000 live births >200 100 25 5 c d Posterior probability of meeting SDG for under-5 mortality in 2017 1.00 0.75 0.50 0.25 0 Neonatal/ under-5 mortality ratio >0.75 0.50 <0.25
Fig. 1 | U5MR estimates in 99 LMICs. a, U5MR at the second
administrative level in 2000. b, U5MR at the second administrative level
in 2017. c, Modelled posterior exceedance probability that a given second
administrative unit had achieved the SDG 3.2 target of 25 deaths per
1,000 live births for children under 5 in 2017. d, Proportion of mortality
of children under 5 occurring in the neonatal (0–28 days) group at the
second administrative level in 2017.
Despite population growth, child deaths have declined due to the
outpaced decline in U5MR. For example, there were a total of 8.5
(7.2–10.0) million deaths of children under 5 in the countries in this
study in 2000; had the 2017 under-5 population been exposed to the
same U5MRs that were observed in 2000, there would have been 10.6
(9.0–12.5) million deaths in 2017. Instead, we observed 5.0 (3.8–6.6)
million deaths in 2017 (Extended Data Fig. 5).
Finally, we combine estimates of subnational variation in mortality
rates and populations to gain a better understanding of the impact
of geographical inequality. Overall, 2.7 (2.5–2.9) million deaths, or
54% of the total number of deaths of children under 5, would have
been averted in 2017 had all units had a U5MR that matched the best-
performing unit in each respective country (Extended Data Fig. 2).
Over the 2000–2017 period, this number is 71.8 (68.5–74.9) million
deaths, or 58% (55–61) of the total number of deaths of children under
5. Total deaths attributable to inequality in this scenario ranged from
13 (6–24) deaths in Belize to 0.84 (0.72–0.99) million deaths in India.
Furthermore, had all units met the SDG 3.2 target of 25 deaths per
1,000, an estimated 2.6 (2.3–2.8) million deaths of children under 5
would have been averted in 2017.
Discussion
This study offers a comprehensive, geospatially resolved resource for
national and subnational estimates of child deaths and mortality rates
for 99 LMICs, where 93% of the world’s child deaths
4occurred in 2017.
Gains in child survival varied substantially within the vast majority of
countries from 2000 to 2017. Countries such as Vietnam, for example,
showed more than fivefold variation in mortality rates across second
administrative-level units. The inconsistency of successes, even at
subnational levels, indicates how differences in health policy,
finan-cial resources, access to and use of health services, infrastructure, and
economic development ultimately contribute to millions of lives cut
short
25–27. By providing detailed maps that show precisely where these
deaths are estimated to have occurred, we provide an important
evi-dence base for looking both to the past, for examples of success, and
towards the future, in order to identify where precision public-health
initiatives could save the most lives.
The epidemiological toll of child mortality should be considered both
in terms of total deaths and as rates of mortality. Focusing only on
mortality rates can effectively mask areas in which rates are
compara-tively low but child deaths are high owing to large population sizes. The
number of deaths that occur in high-risk areas has declined, and most
under-5 deaths in recent years have occurred in lower-risk areas. This
‘prevention paradox’
28could indicate that whole-population
interven-tions could have a larger overall impact than targeting high-risk areas
29.
At the same time, strategies that target resources to those locations that
have the highest number of child deaths risk leaving behind some of
the world’s most marginalized communities: remote, more-sparsely
populated places in which, relative to the number of children born
each year, a large number of children die before their fifth birthday.
Instead, by considering subnational measures of both counts and rates
of deaths of children under 5, decision-makers can better tailor child
health programs to align with local contexts, norms and needs. Rural
communities with high rates but low counts may benefit from
‘last-mile’ initiatives to provide effective health services to populations who
lack adequate access to care. By contrast, locations with low rates but
high counts may require programs that focus on alleviating the cost of
care, unsafe environmental exposures or health risks that are uniquely
associated with urban slums
30. The SDGs have pointed the global
development agenda towards progress in child survival. Our analysis
indicates that reaching the SDG 3.2 targets of 25 child deaths per 1,000
live births and 12 neonatal deaths per 1,000 live births will require
only modest improvements or have already been achieved by some
units; however, these targets are ambitious for other units in which
child mortality remains high. It is worth noting that many countries
contain areas that fit both of these profiles. For example, 11 countries
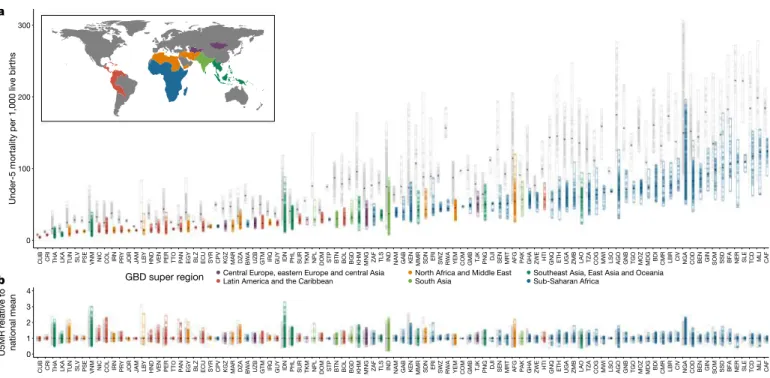
0 100 200 300
a
b
CU B CR I TH A LK A TU N SLV PSE VN M NI C CO L IR N PRY JO R JA M LB Y HN D VE N PE R TT O PA N EG Y BL Z EC U SY R CP V KG Z MA R DZ A BWA UZ B GT M IR Q GU Y ID N PH L SU R TK M NP L DO M ST P BT N BO L BG D KH M MN G ZA F TL S IN D NA M GA B KE N MM R SD N ER I SW Z RWA YE M CO M GM B TJ K PN G DJI SE N MR T AF G PAK GH A ZW E HT I GN Q ET H UG A ZM B LAO TZA CO G MW I LSO AG O GN B TG O MO Z MD G BD I CM R LB R CI V NG A CO D BE N GI N SO M SSD BFA NE R SL E TC D ML I CA FUnder-5 mortality per 1,000 live births
0 1 2 3 4 CU B CR I TH A LK A TU N SL V PSE VN M NI C CO L IR N PRY JOR JAM LBY HN D VE N PE R TT O PA N EG Y BL Z EC U SYR CP V KG Z MA R DZ A BWA UZ B GT M IR Q GU Y ID N PH L SU R TK M NP L DO M ST P BT N BO L BG D KH M MN G ZA F TL S IN D NA M GA B KE N MM R SD N ER I SW Z RWA YEM CO M GM B TJ K PN G DJ I SE N MR T AF G PA K GH A ZW E HT I GN Q ET H UG A ZM B LA O TZ A CO G MW I LS O AG O GN B TG O MO Z MD G BD I CM R LB R CI V NG A CO D BE N GI N SO M SS D BF A NE R SL E TC D ML I CA F
U5MR relative to national mean
GBD super region Central Europe, eastern Europe and central AsiaLatin America and the Caribbean North Africa and Middle EastSouth Asia Southeast Asia, East Asia and OceaniaSub-Saharan Africa
Country
Fig. 2 | Geographical inequality in U5MR across 99 countries for 2000
and 2017. a, Absolute inequalities. Range of U5MR estimates in second
administrative-level units across 99 LMICs. b, Relative inequalities. Range
of ratios of U5MR estimates in second administrative-level units relative
to country means. Each dot represents a second administrative-level unit.
The lower bound of each bar represents the second administrative-level
unit with the lowest U5MR in each country. The upper end of each bar
represents the second administrative-level unit with the highest U5MR
in each country. Thus, each bar represents the extent of geographical
inequality in U5MRs estimated for each country. Bars indicating the
range in 2017 are coloured according to their Global Burden of Disease
super-region. Grey bars indicate the range in U5MR in 2000. The diamond
in each bar represents the median U5MR estimated across second
administrative-level units in each country and year. A coloured bar that is
shorter than its grey counterpart indicates that geographical inequality has
narrowed.
had at least 1 unit that had already met SDG 3.2 with high certainty,
and at least 1 unit that had not. Subnational estimates can empower
countries to benchmark gains in child survival against their own
sub-national exemplars as well as advances that have been achieved by their
peers. Through our counterfactual analysis we showed that even if all
units had met the SDG 3.2 goal in 2017, there would still have been
2.4 million deaths of children under 5, indicating that ‘ending
pre-ventable child deaths’ is more complex than simply meeting a target
threshold. Future research efforts must address the causes of child
mor-tality in local areas and more precisely identify causes of child deaths
that are amenable to intervention. To that end, new and innovative
data-collection efforts, such as the ongoing Child Health and Mortality
Prevention Surveillance network, offer promising prospects by applying
high-validity, pathology-based methods alongside verbal autopsies to
determine the cause of death
31.
This study offers a unique platform to support the identification of
local success stories that could be replicated elsewhere. In Rwanda,
for example, the highest U5MR at the district level in 2017 was 60.2%
(52.0–67.8%) lower than the lowest U5MR at the district level in 2000.
Such gains have been partially credited to focused investments in
the country’s poorest populations, expanding the Mutuelles de santé
insurance program, and developing a strong workforce of community
health workers who provide evidence-based treatment and health
pro-motion
32,33. Nepal and Cambodia are among the exemplars for
consid-erably decreasing subnational inequalities in child survival since 2000.
In an era when narrowing disparities within countries is as important
as reducing national-level gaps, these results provide the evidence base
to inform best practices and stimulate national conversations about
related social determinants.
Neonatal mortality rates have also declined but failed to keep pace
with reductions in mortality rates of older children, leading to a higher
proportion of deaths of children under 5 occurring within the first four
weeks of life: from 37.4% (37.1–37.7) in 2000 to 43.7% (43.1–44.3%) in
2017. This trend is probably related to the increase in scale of routine
programs and improved infrastructure (for example, vaccination
34, and
water and sanitation
35) and the introduction of effective interventions
to target communicable diseases (for example, malaria control
36and
prevention of mother-to-child transmission of HIV
37). These
inter-ventions have tended to target amenable causes of mortality that are
more common in older children under 5 rather than dominant causes
of neonatal mortality, such as prematurity and congenital anomalies
38.
Notably, irrespective of income level or location, some causes of
neo-natal death (for example, chromosomal anomalies and severe preterm
birth complications) remain difficult to prevent completely with
cur-rent medical technologies. Ultimately, large gains in neonatal
mortal-ity will require serious investment in health system strengthening
39.
Affordable approaches to preventing the majority of neonatal deaths
in LMICs exist and there are success stories with lessons learned to
apply
40–44, but decisions about which approaches to take must be based
on the local epidemiological and health system context. In the absence
of spatially detailed cause of death data, subnational neonatal mortality
estimates can indicate dominant causes and thus serve as a useful proxy
to guide prioritization of interventions
45.
The accuracy and precision of our estimates were primarily
deter-mined by the timeliness, quantity and quality of available data. In Sri
Lanka, for example, there were no available surveys, and the wide
uncertainty intervals surrounding estimates reflect the dearth of
availa-ble evidence in that country (Extended Data Figs. 3, 4). In certain areas,
this decreased the confidence that we had in claiming that a specific
subnational area met the SDG 3.2 target (Fig. 1c). This issue is most
concerning in cases in which estimated mortality rates are high, thus
helping to identify locations in which it would be most useful to focus
future data-collection efforts. High mortality rates with large
uncer-tainty intervals were estimated across much of Eastern and Central
sub-Saharan Africa, and in Cambodia, Laos, Myanmar and Papua New
Guinea (Extended Data Figs. 3, 4). Furthermore, ongoing conflict in
countries such as Syria, Yemen and Iraq pose substantial challenges
to collecting more contemporaneous data, and our estimates may not
fully capture the effects of prolonged civil unrest or war
46,47. Further
methodological and data limitations are discussed in the Methods.
The accurate estimation of mortality is also a matter of equity;
highly refined health surveillance is common in high-income
coun-tries, whereas in LMICs, in which rates of child mortality are the
high-est, surveillance that helps to guide investments in health towards the
areas with the greatest need is less routine
48. Ideally, all countries would
have high-quality, continuous, and complete civil and vital registration
systems that capture all of the births, deaths and causes of death at
the appropriate geographical resolution
49. In the meantime, analyses
such as this serve to bridge the information gap that exists between
low-mortality countries with strong information systems and countries
that face a dual challenge of weaker information systems and higher
disease burden.
a
Numberb
of deaths (×103) >500 200 50 5 Number of deaths (×103) >50 20 5 0.5c
Numberd
of deaths (×103) >5 2 0.5 0.05 Number of deaths per grid cell>10 4 1
Fig. 3 | Estimated number of children under 5 who died within 99
countries in 2017. a, Number of deaths of children under 5 in each
country. b, Number of deaths in each first administrative-level unit.
c, Number of deaths in each second administrative-level unit. d, Number
of deaths of children under 5 in each 5 × 5-km grid cell. Note that scales
vary for each aggregation unit.
By harnessing the unprecedented availability of geo-referenced data
and developing robust statistical methods, we provide a high-resolution
atlas of child death counts and rates since 2000, covering countries
that account for 93% of child deaths. We bring attention to
subna-tional geographical inequalities in the distribution, rates and absolute
counts of child deaths by age. These high-resolution estimates can help
decision-makers to structure policy and program implementation and
facilitate pathways to end preventable child deaths
50by 2030.
Online content
Any methods, additional references, Nature Research reporting summaries, source
data, extended data, supplementary information, acknowledgements, peer review
information; details of author contributions and competing interests; and statements of
data and code availability are available at https://doi.org/10.1038/s41586-019-1545-0.
Received: 28 March 2019; Accepted: 6 August 2019;
Published online 16 October 2019.
1. Reidpath, D. D. & Allotey, P. Infant mortality rate as an indicator of population health. J. Epidemiol. Community Health 57, 344–346 (2003).
2. United Nations General Assembly. United Nations Millennium Declaration: Resolution adopted by the General Assembly. A/RES/55/2 (UN General Assembly, 2000).
3. Centers for Disease Control and Prevention. Ten Great Public Health Achievements—Worldwide, 2001–2010. https://www.cdc.gov/mmwr/preview/ mmwrhtml/mm6024a4.htm (2011).
4. GBD 2017 Mortality Collaborators. Global, regional, and national age-sex-specific mortality and life expectancy, 1950–2017: a systematic analysis for the Global Burden of Disease Study 2017. Lancet 392, 1684–1735 (2018). 5. Golding, N. et al. Mapping under-5 and neonatal mortality in Africa, 2000–15: a
baseline analysis for the Sustainable Development Goals. Lancet 390, 2171–2182 (2017).
6. Pezzulo, C. et al. Geospatial Modeling of Child Mortality across 27 Countries in sub-Saharan Africa. DHS Spatial Analysis Reports No. 13 (USAID, 2016). 7. Li, Z. et al. Changes in the spatial distribution of the under-five mortality rate:
small-area analysis of 122 DHS surveys in 262 subregions of 35 countries in Africa. PLoS ONE 14, e0210645 (2019).
8. Lawn, J. E., Cousens, S. & Zupan, J. 4 million neonatal deaths: When? Where? Why? Lancet 365, 891–900 (2005).
9. World Health Organization. SDG 3: Ensure healthy lives and promote wellbeing for all at all ages. https://www.who.int/sdg/targets/en/ (2019).
10. Dwyer-Lindgren, L. et al. Estimation of district-level under-5 mortality in Zambia using birth history data, 1980–2010. Spat. SpatioTemporal Epidemiol. 11, 89–107 (2014).
11. Dwyer-Lindgren, L. et al. Small area estimation of under-5 mortality in Bangladesh, Cameroon, Chad, Mozambique, Uganda, and Zambia using spatially misaligned data. Popul. Health Metr. 16, 13 (2018).
12. Wakefield, J. et al. Estimating under-five mortality in space and time in a developing world context. Stat. Methods Med. Res. https://doi. org/10.1177/0962280218767988 (2018).
13. Burke, M., Heft-Neal, S. & Bendavid, E. Sources of variation in under-5 mortality across sub-Saharan Africa: a spatial analysis. Lancet Glob. Health 4, e936–e945 (2016).
14. Macharia, P. M. et al. Sub national variation and inequalities in under-five mortality in Kenya since 1965. BMC Public Health 19, 146 (2019).
15. Sousa, A., Hill, K. & Dal Poz, M. R. Sub-national assessment of inequality trends in neonatal and child mortality in Brazil. Int. J. Equity Health 9, 21 (2010). 16. Mohammadi, Y. et al. Measuring Iran’s success in achieving Millennium
Development Goal 4: a systematic analysis of under-5 mortality at national and subnational levels from 1990 to 2015. Lancet Glob. Health 5, e537–e544 (2017). 17. Wang, Y. et al. Under-5 mortality in 2851 Chinese counties, 1996–2012: a
subnational assessment of achieving MDG 4 goals in China. Lancet 387, 273–283 (2016).
18. Horton, R. Offline: in defence of precision public health. Lancet 392, 1504 (2018). 19. Takahashi, S., Metcalf, C. J. E., Ferrari, M. J., Tatem, A. J. & Lessler, J. The
geography of measles vaccination in the African Great Lakes region. Nat. Commun. 8, 15585 (2017).
20. Utazi, C. E. et al. High resolution age-structured mapping of childhood vaccination coverage in low and middle income countries. Vaccine 36, 1583–1591 (2018).
21. Gething, P. W. et al. Mapping Plasmodium falciparum mortality in Africa between 1990 and 2015. N. Engl. J. Med. 375, 2435–2445 (2016).
22. Reiner, R. C. Jr et al. Variation in childhood diarrheal morbidity and mortality in Africa, 2000–2015. N. Engl. J. Med. 379, 1128–1138 (2018).
23. Osgood-Zimmerman, A. et al. Mapping child growth failure in Africa between 2000 and 2015. Nature 555, 41–47 (2018).
24. Amoah, B., Giorgi, E., Heyes, D. J., van Burren, S. & Diggle, P. J. Geostatistical modelling of the association between malaria and child growth in Africa. Int. J. Health Geogr. 17, 7 (2018).
25. Bishai, D. M. et al. Factors contributing to maternal and child mortality reductions in 146 low- and middle-income countries between 1990 and 2010. PLoS ONE 11, e0144908 (2016).
26. Marmot, M. Social determinants of health inequalities. Lancet 365, 1099–1104 (2005).
27. Victora, C. G. et al. Countdown to 2015: a decade of tracking progress for maternal, newborn, and child survival. Lancet 387, 2049–2059 (2016). 28. Rose, G. Strategy of prevention: lessons from cardiovascular disease. Br. Med. J.
(Clin. Res. Ed.) 282, 1847–1851 (1981).
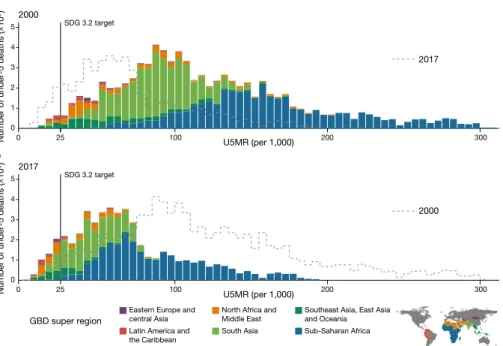
29. Mackenbach, J. P., Lingsma, H. F., van Ravesteyn, N. T. & Kamphuis, C. B. M. The population and high-risk approaches to prevention: quantitative estimates of their contribution to population health in the Netherlands, 1970–2010. Eur. J. Public Health 23, 909–915 (2013). 2017 0 1 2 3 4 5 0 25 100 200 300 0 25 100 200 300 U5MR (per 1,000) U5MR (per 1,000)
Number of under-5 deaths
(× 10 5) 2000 SDG 3.2 target SDG 3.2 target 2000 0 1 2 3 4 5
Number of under-5 deaths
(× 10 5) 2017
a
b
GBD super regionEastern Europe and central Asia Latin America and the Caribbean
North Africa and Middle East South Asia
Southeast Asia, East Asia and Oceania Sub-Saharan Africa
Fig. 4 | Number of deaths of children under 5, distributed across
level of U5MR, in 2000 and in 2017, across 99 countries. Bar heights
represent the total number of deaths of children under 5 within all second
administrative-level units with corresponding U5MR. Bins are a width of
5 deaths per 1,000 live births. The colour of each bar represents the global
region as defined by the subset legend map. As such, the sum of heights
of all bars represents the total number of deaths across the 99 countries.
a, Deaths of children under 5 in 2000. b, Deaths of children under 5 in
2017. The dotted line in the 2000 plot is the shape of the distribution in
2017, and the dotted line in the 2017 plot represents the distribution in
2000.
30. Agarwal, S. & Taneja, S. All slums are not equal: child health conditions among the urban poor. Indian Pediatr. 42, 233–244 (2005).
31. Farag, T. H. et al. Precisely tracking childhood death. Am. J. Trop. Med. Hyg. 97, 3–5 (2017).
32. Farmer, P. E. et al. Reduced premature mortality in Rwanda: lessons from success. Br. Med. J. 346, f65 (2013).
33. Gurusamy, P. S. R. & Janagaraj, P. D. A success story: the burden of maternal, neonatal and childhood mortality in Rwanda - critical appraisal of interventions and recommendations for the future. Afr. J. Reprod. Health 22, 9–16 (2018). 34. McGovern, M. E. & Canning, D. Vaccination and all-cause child mortality from
1985 to 2011: global evidence from the Demographic and Health Surveys. Am. J. Epidemiol. 182, 791–798 (2015).
35. Cheng, J. J., Schuster-Wallace, C. J., Watt, S., Newbold, B. K. & Mente, A. An ecological quantification of the relationships between water, sanitation and infant, child, and maternal mortality. Environ. Health 11, 4 (2012). 36. Steketee, R. W. & Campbell, C. C. Impact of national malaria control scale-up
programmes in Africa: magnitude and attribution of effects. Malar. J. 9, 299 (2010). 37. Kiragu, K., Collins, L., Von Zinkernagel, D. & Mushavi, A. Integrating PMTCT into
maternal, newborn, and child health and related services: experiences from the global plan priority countries. J. Acquir. Immune Defic. Syndr. 75, S36–S42 (2017). 38. GBD 2017 Causes of Death Collaborators. Global, regional, and national
age-sex-specific mortality for 282 causes of death in 195 countries and territories, 1980–2017: a systematic analysis for the Global Burden of Disease Study 2017. Lancet 392, 1736–1788 (2018).
39. Pasha, O. et al. A combined community- and facility-based approach to improve pregnancy outcomes in low-resource settings: a Global Network cluster randomized trial. BMC Med. 11, 215 (2013).
40. Horton, S. et al. Ranking 93 health interventions for low- and middle-income countries by cost-effectiveness. PLoS ONE 12, e0182951 (2017).
41. Simmons, L. E., Rubens, C. E., Darmstadt, G. L. & Gravett, M. G. Preventing preterm birth and neonatal mortality: exploring the epidemiology, causes, and interventions. Semin. Perinatol. 34, 408–415 (2010).
42. Darmstadt, G. L. et al. Evidence-based, cost-effective interventions: how many newborn babies can we save? Lancet 365, 977–988 (2005).
43. Saugstad, O. D. Reducing global neonatal mortality is possible. Neonatology 99, 250–257 (2011).
44. Ntigurirwa, P. et al. A health partnership to reduce neonatal mortality in four hospitals in Rwanda. Glob. Health 13, 28 (2017).
45. Knippenberg, R. et al. Systematic scaling up of neonatal care in countries. Lancet 365, 1087–1098 (2005).
46. GBD 2015 Eastern Mediterranean Region Neonatal, Infant, and under-5 Mortality Collaborators. Neonatal, infant, and under-5 mortality and morbidity burden in the Eastern Mediterranean region: findings from the Global Burden of Disease 2015 study. Int. J. Public Health 63, 63–77 (2018).
47. Wagner, Z. et al. Armed conflict and child mortality in Africa: a geospatial analysis. Lancet 392, 857–865 (2018).
48. Mikkelsen, L. et al. A global assessment of civil registration and vital statistics systems: monitoring data quality and progress. Lancet 386, 1395–1406 (2015).
49. AbouZahr, C. et al. Civil registration and vital statistics: progress in the data revolution for counting and accountability. Lancet 386, 1373–1385 (2015). 50. Annan, K. Data can help to end malnutrition across Africa. Nature 555, 7
(2018).
Publisher’s note Springer Nature remains neutral with regard to jurisdictional
claims in published maps and institutional affiliations.
Open Access This article is licensed under a Creative Commons
Attribution 4.0 International License, which permits use, sharing, adaptation, distribution and reproduction in any medium or format, as long as you give appropriate credit to the original author(s) and the source, provide a link to the Creative Commons license, and indicate if changes were made. The images or other third party material in this article are included in the article’s Creative Commons license, unless indicated otherwise in a credit line to the material. If material is not included in the article’s Creative Commons license and your intended use is not permitted by statutory regulation or exceeds the permitted use, you will need to obtain permission directly from the copyright holder. To view a copy of this license, visit http:// creativecommons.org/licenses/by/4.0/.
© The Author(s) 2019
roy Burstein1,612, Nathaniel J. Henry1,612, Michael l. collison1, laurie B. Marczak1, Amber
Sligar1, Stefanie Watson1, Neal Marquez1, Mahdieh Abbasalizad-Farhangi2, Masoumeh
Abbasi3, Foad Abd-Allah4, Amir Abdoli5, Mohammad Abdollahi6, ibrahim Abdollahpour7,8,
rizwan Suliankatchi Abdulkader9, Michael r. M. Abrigo10, Dilaram Acharya11,12, Oladimeji M.
Adebayo13, Victor Adekanmbi14, Davoud Adham15, Mahdi Afshari16, Mohammad Aghaali17,
Keivan Ahmadi18, Mehdi Ahmadi19, ehsan Ahmadpour20, rushdia Ahmed21,22, chalachew
Genet Akal23, Joshua O. Akinyemi24, Fares Alahdab25, Noore Alam26, Genet Melak Alamene27,
Kefyalew Addis Alene28,29, Mehran Alijanzadeh30, cyrus Alinia31, Vahid Alipour32,33, Syed
Mohamed Aljunid34,35, Mohammed J. Almalki36,37, Hesham M. Al-Mekhlafi38,39, Khalid
Altirkawi40, Nelson Alvis-Guzman41,42, Adeladza Kofi Amegah43, Saeed Amini44, Arianna
Maever loreche Amit45,46, Zohreh Anbari44, Sofia Androudi47, Mina Anjomshoa48, Fereshteh
Ansari49, carl Abelardo t. Antonio50,51, Jalal Arabloo33, Zohreh Arefi52, Olatunde Aremu53,
Bahram Armoon54,55, Amit Arora56,57, Al Artaman58, Anvar Asadi59, Mehran Asadi-Aliabadi60,
Amir Ashraf-Ganjouei7,61, reza Assadi62, Bahar Ataeinia63, Sachin r. Atre64,65, Beatriz Paulina
Ayala Quintanilla66,67, Martin Amogre Ayanore68, Samad Azari33, ebrahim Babaee60, Arefeh
Babazadeh69, Alaa Badawi70,71, Soghra Bagheri3, Mojtaba Bagherzadeh72, Nafiseh
Baheiraei73,74, Abbas Balouchi75, Aleksandra Barac76,77, Quique Bassat78,79, Bernhard t.
Baune80, Mohsen Bayati81, Neeraj Bedi37,82, ettore Beghi83, Masoud Behzadifar84, Meysam
Behzadifar85, Yared Belete Belay86, Brent Bell1, Michelle l. Bell87, Dessalegn Ajema Berbada88,
robert S. Bernstein89,90, Natalia V. Bhattacharjee1, Suraj Bhattarai91,92, Zulfiqar A. Bhutta93,94,
Ali Bijani95, Somayeh Bohlouli96, Nicholas J. K. Breitborde97,98, Gabrielle Britton99,100, Annie J.
Browne101, Sharath Burugina Nagaraja102, reinhard Busse103, Zahid A. Butt104,105, Josip
car106,107, rosario cárdenas108, carlos A. castañeda-Orjuela109,110, ester cerin111,112, Wagaye
Fentahun chanie113, Pranab chatterjee114, Dinh-toi chu115, cyrus cooper116,117, Vera M.
costa118, Koustuv Dalal119,120, lalit Dandona1,121, rakhi Dandona1,121, Farah Daoud1, Ahmad
Daryani122, rajat Das Gupta21, ian Davis1, Nicole Davis Weaver1, Dragos Virgil Davitoiu123,124,
Jan-Walter De Neve125, Feleke Mekonnen Demeke126, Gebre teklemariam Demoz127,128, Kebede
Deribe129,130, rupak Desai131, Aniruddha Deshpande1, Hanna Demelash Desyibelew132, Sagnik
Dey133, Samath Dhamminda Dharmaratne1,134, Meghnath Dhimal135, Daniel Diaz136,137, leila
Doshmangir138, Andre r. Duraes139,140, laura Dwyer-lindgren1,141, lucas earl1, roya
ebrahimi142, Soheil ebrahimpour69, Andem effiong143, Aziz eftekhari144,145, elham
ehsani-chimeh146, iman el Sayed147, Maysaa el Sayed Zaki148, Maha el tantawi149,150, Ziad
el-Khatib151, Mohammad Hassan emamian152, Shymaa enany153, Sharareh eskandarieh7,
Oghenowede eyawo154,155, Maha ezalarab1, Mahbobeh Faramarzi156, Mohammad Fareed157,
roghiyeh Faridnia158, Andre Faro159, Ali Akbar Fazaeli160, Mehdi Fazlzadeh161,162, Netsanet
Fentahun163, Seyed-Mohammad Fereshtehnejad164,165, João c. Fernandes166, irina Filip167,168,
Florian Fischer169, Nataliya A. Foigt170, Masoud Foroutan171, Joel Msafiri Francis172, takeshi
Fukumoto173,174, Nancy Fullman1, Silvano Gallus175, Destallem Gebremedhin Gebre176,177,
tsegaye tewelde Gebrehiwot178, Gebreamlak Gebremedhn Gebremeskel179,180, Bradford D.
Gessner181,182, Birhanu Geta183, Peter W. Gething101, reza Ghadimi184, Keyghobad Ghadiri3,
Mahsa Ghajarzadeh185, Ahmad Ghashghaee186, Paramjit Singh Gill187, tiffany K. Gill188, Nick
Golding609, Nelson G. M. Gomes189,190, Philimon N. Gona191, Sameer Vali Gopalani192,193,
Giuseppe Gorini194, Bárbara Niegia Garcia Goulart195, Nicholas Graetz1, Felix Greaves196,197,
Manfred S. Green198, Yuming Guo199,200, Arvin Haj-Mirzaian201,202, Arya Haj-Mirzaian201,203,
Brian James Hall204, Samer Hamidi205, Hamidreza Haririan206, Josep Maria Haro207,208, Milad
Hasankhani209, edris Hasanpoor210, Amir Hasanzadeh211,212, Hadi Hassankhani213,214, Hamid
Yimam Hassen215,216, Mohamed i. Hegazy4, Delia Hendrie217, Fatemeh Heydarpour218, thomas
r. Hird199,219, chi linh Hoang220, Gillian Hollerich1, enayatollah Homaie rad221,222, Mojtaba
Hoseini-Ghahfarokhi223, Naznin Hossain22,224, Mostafa Hosseini225, Mehdi Hosseinzadeh33,226,
Mihaela Hostiuc123,227, Sorin Hostiuc228,229, Mowafa Househ230,231, Mohamed Hsairi232,
Olayinka Stephen ilesanmi233, Mohammad Hasan imani-Nasab234, Usman iqbal235, Seyed Sina
Naghibi irvani236, Nazrul islam237,238, Sheikh Mohammed Shariful islam239,240, Mikk
Jürisson241, Nader Jafari Balalami242, Amir Jalali243, Javad Javidnia244, Achala Upendra
Jayatilleke245,246, ensiyeh Jenabi247, John S. Ji248, Yash B. Jobanputra249, Kimberly Johnson1,
Jost B. Jonas250,251, Zahra Jorjoran Shushtari252, Jacek Jerzy Jozwiak253,254, Ali Kabir255, Amaha
Kahsay256, Hamed Kalani257,258, rohollah Kalhor259, Manoochehr Karami260, Surendra
Karki261,262, Amir Kasaeian263,264, Nicholas J. Kassebaum1,265, Peter Njenga Keiyoro266, Grant
rodgers Kemp1,267, roghayeh Khabiri268,269, Yousef Saleh Khader270, Morteza Abdullatif
Khafaie271, ejaz Ahmad Khan272, Junaid Khan273, Muhammad Shahzeb Khan274,275, Young-Ho
Khang276,277, Khaled Khatab278,279, Amir Khater280, Mona M. Khater281, Alireza Khatony3,
Mohammad Khazaei282, Salman Khazaei260, Maryam Khazaei-Pool283, Jagdish
Khubchandani284, Neda Kianipour3,285, Yun Jin Kim286, ruth W. Kimokoti287, Damaris K.
Kinyoki1,141, Adnan Kisa288,289, Sezer Kisa290, tufa Kolola291, Soewarta Kosen292, Parvaiz A.
Koul293, Ai Koyanagi79,294, Moritz U. G. Kraemer295,296, Kewal Krishan297, Kris J. Krohn1,
Nuworza Kugbey298,299, G. Anil Kumar121, Manasi Kumar300,301, Pushpendra Kumar302,
Desmond Kuupiel303,304, Ben lacey305,306, Sheetal D. lad307, Faris Hasan lami308, Anders O.
larsson309,310, Paul H. lee311, Mostafa leili282, Aubrey J. levine1, Shanshan li199, lee-ling
lim312,313, Stefan listl314,315, Joshua longbottom316, Jaifred christian F. lopez45,317, Stefan
lorkowski318,319, Sameh Magdeldin320,321, Hassan Magdy Abd el razek322, Muhammed Magdy
Abd el razek323, Azeem Majeed196, Afshin Maleki142, reza Malekzadeh324,325, Deborah
carvalho Malta326, Abdullah A. Mamun327, Navid Manafi328,329, Ana-laura Manda330, Morteza
Mansourian331, Francisco rogerlândio Martins-Melo332, Anthony Masaka333, Benjamin Ballard
Massenburg334, Pallab K. Maulik335,336, Benjamin K. Mayala1, Mohsen Mazidi337, Martin
McKee338, ravi Mehrotra339, Kala M. Mehta340, Gebrekiros Gebremichael Meles88, Walter
Mendoza341, ritesh G. Menezes342, Atte Meretoja343,344, tuomo J. Meretoja345,346, tomislav
Mestrovic347,348, ted r. Miller217,349, Molly K. Miller-Petrie1, edward J. Mills350, George J.
Milne351, G. K. Mini352, Seyed Mostafa Mir353,354, Hamed Mirjalali355, erkin M.
Mirrakhimov356,357, efat Mohamadi358, Dara K. Mohammad359,360, Aso Mohammad
Darwesh361, Naser Mohammad Gholi Mezerji362, Ammas Siraj Mohammed363, Shafiu
Mohammed364,365, Ali H. Mokdad1,141, Mariam Molokhia366, lorenzo Monasta367, Yoshan
Moodley303, Mahmood Moosazadeh368, Ghobad Moradi369,370, Masoud Moradi3,59, Yousef
Moradi371, Maziar Moradi-lakeh60, Mehdi Moradinazar59, Paula Moraga372, lidia Morawska373,
Abbas Mosapour353,374, Seyyed Meysam Mousavi375, Ulrich Otto Mueller376,377, Atalay Goshu
Muluneh378, Ghulam Mustafa379,380, Behnam Nabavizadeh381, Mehdi Naderi382, Ahamarshan
Jayaraman Nagarajan383,384, Azin Nahvijou385, Farid Najafi386, Vinay Nangia387, Duduzile edith
Ndwandwe388, Nahid Neamati353, ionut Negoi389,390, ruxandra irina Negoi391,392, Josephine W.
Ngunjiri393, Huong lan thi Nguyen394, long Hoang Nguyen395, Son Hoang Nguyen395, Katie r.
Nielsen396,397, Dina Nur Anggraini Ningrum610,611, Yirga legesse Nirayo398, Molly r. Nixon1,
chukwudi A. Nnaji388,399, Marzieh Nojomi60,400, Mehdi Noroozi401, Shirin Nosratnejad402, Jean
Jacques Noubiap403, Soraya Nouraei Motlagh234, richard Ofori-Asenso404,405, Felix Akpojene
Ogbo406, Kelechi e. Oladimeji303,407, Andrew t. Olagunju408,409, Meysam Olfatifar410, Solomon
Olum411,412, Bolajoko Olubukunola Olusanya413, Mojisola Morenike Oluwasanu414, Obinna e.
Onwujekwe415, eyal Oren416,417, Doris D. V. Ortega-Altamirano418, Alberto Ortiz419,420,
Osayomwanbo Osarenotor421, Frank B. Osei422,423, Aaron e. Osgood-Zimmerman1, Stanislav
S. Otstavnov424,425, Mayowa Ojo Owolabi426, Mahesh P. A.427, Abdol Sattar Pagheh122, Smita
Pakhale428, Songhomitra Panda-Jonas429, Animika Pandey121, eun-Kee Park430, Hadi
Parsian353, tahereh Pashaei142, Sangram Kishor Patel431,432, Veincent christian Filipino
Pepito433, Alexandre Pereira434,435, Samantha Perkins1, Brandon V. Pickering1, thomas
Pilgrim436, Majid Pirestani437, Bakhtiar Piroozi370, Meghdad Pirsaheb3, Oleguer
Plana-ripoll438, Hadi Pourjafar439,440, Parul Puri302, Mostafa Qorbani441, Hedley Quintana100,
Mohammad rabiee442, Navid rabiee72, Amir radfar443,444, Alireza rafiei445,446, Fakher
rahim447,448, Zohreh rahimi449, Vafa rahimi-Movaghar450, Shadi rahimzadeh63, Fatemeh
rajati451, Sree Bhushan raju452, Azra ramezankhani453,454, chhabi lal ranabhat455,456, Davide
rasella457,458, Vahid rashedi459, lal rawal56,460, robert c. reiner Jr1,141, Andre M. N.
renzaho461, Satar rezaei462, Aziz rezapour33, Seyed Mohammad riahi463,464, Ana isabel
ribeiro465, leonardo roever466, elias Merdassa roro467,468, Max roser469, Gholamreza
roshandel324,470, Daem roshani471, Ali rostami472, enrico rubagotti473,474, Salvatore
rubino475, Siamak Sabour463, Nafis Sadat1, ehsan Sadeghi59, reza Saeedi476, Yahya Safari3,
roya Safari-Faramani477, Mahdi Safdarian450,478, Amirhossein Sahebkar479,480, Mohammad
reza Salahshoor481, Nasir Salam482, Payman Salamati450,483, Farkhonde Salehi484, Saleh Salehi
Zahabi485,486, Yahya Salimi386, Hamideh Salimzadeh324, Joshua A. Salomon487, evanson
Zondani Sambala388, Abdallah M. Samy488, Milena M. Santric Milicevic489, Bruno Piassi Sao
Jose490, Sivan Yegnanarayana iyer Saraswathy491,492, rodrigo Sarmiento-Suárez493, Benn
Sartorius141,494, Brijesh Sathian495,496, Sonia Saxena497, Alyssa N. Sbarra1, lauren e. Schaeffer1,
David c. Schwebel498, Sadaf G. Sepanlou324,325, Seyedmojtaba Seyedmousavi499,500, Faramarz
Shaahmadi501, Masood Ali Shaikh502, Mehran Shams-Beyranvand63,503, Amir Shamshirian504,
Morteza Shamsizadeh505, Kiomars Sharafi3, Mehdi Sharif506,507, Mahdi Sharif-Alhoseini450,
Hamid Sharifi508, Jayendra Sharma509, rajesh Sharma510, Aziz Sheikh511,512, chloe Shields1,
Mika Shigematsu513, rahman Shiri514, ivy Shiue515, Kerem Shuval198, tariq J. Siddiqi275, João
Pedro Silva118, Jasvinder A. Singh516,517, Dhirendra Narain Sinha518,519, Malede Mequanent
Sisay378,520, Solomon Sisay521, Karen Sliwa403, David l. Smith1,141, ranjani Somayaji522,523,
Moslem Soofi524, Joan B. Soriano525,526, chandrashekhar t. Sreeramareddy527, Agus
Sudaryanto528, Mu’awiyyah Babale Sufiyan529, Bryan l. Sykes530, P. N. Sylaja531, rafael
tabarés-Seisdedos532,533, Karen M. tabb534, takahiro tabuchi535, Nuno taveira536,537,
Mohamad-Hani temsah538,539, Abdullah Sulieman terkawi540,541, Zemenu tadesse tessema378,
Kavumpurathu raman thankappan542, Sathish thirunavukkarasu543, Quyen G. to544,
Marcos roberto tovani-Palone545, Bach Xuan tran546, Khanh Bao tran547,548, irfan Ullah549,550,
Muhammad Shariq Usman275, Olalekan A. Uthman551, Amir Vahedian-Azimi552,553, Pascual r.
Valdez554,555, Job F. M. van Boven556,557, tommi Juhani Vasankari558, Yasser Vasseghian462,
Yousef Veisani559, Narayanaswamy Venketasubramanian560,561, Francesco S. Violante562,563,
Sergey Konstantinovitch Vladimirov564,565, Vasily Vlassov566, theo Vos1,141, Giang thu Vu220,
isidora S. Vujcic77, Yasir Waheed567, Jon Wakefield568, Haidong Wang1,141, Yafeng Wang569,
Yuan-Pang Wang570, Joseph l. Ward571, robert G. Weintraub572,573, Kidu Gidey
Weldegwergs398, Girmay teklay Weldesamuel574, ronny Westerman575, charles Shey
Wiysonge576,577, Dawit Zewdu Wondafrash578,579, lauren Woyczynski1, Ai-Min Wu580,
Gelin Xu581, Abbas Yadegar355, tomohide Yamada582, Vahid Yazdi-Feyzabadi583,584,
christopher Sabo Yilgwan585,586, Paul Yip587,588, Naohiro Yonemoto589, Javad Yoosefi lebni331,
Mustafa Z. Younis590,591, Mahmoud Yousefifard592, Hebat-Allah Salah A. Yousof593,
chuanhua Yu569,594, Hasan Yusefzadeh595, erfan Zabeh596,597, telma Zahirian Moghadam33,598,
Sojib Bin Zaman599,600, Mohammad Zamani601, Hamed Zandian598,602, Alireza Zangeneh603,
taddese Alemu Zerfu604,605, Yunquan Zhang606,607, Arash Ziapour331, Sanjay Zodpey608,
christopher J. l. Murray1,141,613 & Simon i. Hay1,141,613*
1Institute for Health Metrics and Evaluation, University of Washington, Seattle, WA, USA. 2Department of Nutrition, Tabriz University of Medical Sciences, Tabriz, Iran. 3Kermanshah
University of Medical Sciences, Kermanshah, Iran. 4Department of Neurology, Cairo University,
Cairo, Egypt. 5Department of Parasitology and Mycology, Jahrom University of Medical
Sciences, Jahrom, Iran. 6The Institute of Pharmaceutical Sciences, Tehran University of Medical
Sciences, Tehran, Iran. 7Multiple Sclerosis Research Center, Tehran University of Medical
Sciences, Tehran, Iran. 8Department of Epidemiology, Arak University of Medical Sciences, Arak,
Iran. 9Department of Public Health, Ministry of Health, Riyadh, Saudi Arabia. 10Research
Department, Philippine Institute for Development Studies, Quezon City, The Philippines.
11Department of Preventive Medicine, Dongguk University, Gyeongju, South Korea. 12Department of Community Medicine, Kathmandu University, Devdaha, Nepal. 13College of
Medicine, University College Hospital, Ibadan, Nigeria. 14School of Medicine, Cardiff University,
Cardiff, UK. 15School of Health, Ardabil University of Medical Science, Ardabil, Iran. 16Department of Community Medicine, Zabol University of Medical Sciences, Zabol, Iran. 17Department of Epidemiology and Biostatistics, Qom University of Medical Sciences, Qom,
Iran. 18School of Pharmacy, University of Lincoln, Lincoln, UK. 19Environmental Technologies
Research Center, Ahvaz Jundishapur University of Medical Sciences, Ahvaz, Iran. 20Department
of Parasitology and Mycology, Tabriz University of Medical Sciences, Tabriz, Iran. 21James P.
Grant School of Public Health, Brac University, Dhaka, Bangladesh. 22Health Systems and
Population Studies Division, International Centre for Diarrhoeal Disease Research Bangladesh, Dhaka, Bangladesh. 23Department of Medical Laboratory Science, Bahir Dar University, Bahir