MERGERS AND ACQUISITIONS:
THE CASE OF KRAFT FOODS AND CADBURY
Sara de Paula Ribeiro
Advisor: Peter Tsvetkov
Dissertation submitted in partial fulfillment of requirements for the degree
of MSc in Finance, at Universidade Católica Portuguesa
ABSTRACT
The aim of this dissertation is to focus on a determinant aspect of Corporate Finance that is Mergers and Acquisitions (M&A). This dissertation not only provides a practical analysis of main issued regarding a process of M&A, but also provides a theoretical framework about M&A.
Specifically, this dissertation explores the real case of Kraft Foods - world’s second largest manufacturer and packager food products – and Cadbury - the world’s second largest confectionery firm.
Despite Food & Beverage Industry being a non-cyclical industry is a highly competitive one, where players compete for price, quality, innovation, brand recognition and loyalty.
Together, Kraft Foods and Cadbury will become the largest manufacturer and packager food products in the world. Benefiting from economies of scale, Kraft Foods will be more efficient and better price competitive than its competitors.
Kraft Foods should acquire Cadbury through a tender offer. Synergies are estimated to be 25% of Cadbury’s market capitalization at 9th of November of 2009. The price offered should be
£7.93 for each Cadbury’s share. To conclude, Kraft Foods should pay 88% in Debt and 12% in Cash through an emission of more than 90 million new shares.
ACKNOWLEDGEMENTS
The author would like to express her sincere gratitude to: Professor Peter Tsvetkov, the Dissertation Advisor, for the constant availability and helpful feedback; her friends for the continuous discussion of ideas and support, especially Diogo Maia Marques, Francisco de Almeida and Rui Marto; and to her mother and father for all the contribution and inexhaustible support.
TABLE OF CONTENTS
1. Introduction ...13
2. About Valuation Methods ...14
3. Cash Flow Approaches...15
3.1. Free Cash Flow to the Firm (FCFF) ...15
3.2. Terminal Value (TV) ...16
3.3. Growth Rate (g)...16
3.4. Weighted Average Cost of Capital...16
3.5. Cost of Equity...17
3.6. Risk-free rate...18
3.7. Beta ( ) ...18
3.8. Equity– Risk Premium ( − ) ...19
4. Adjusted Present Value (APV) ...19
5. Relative Valuation...21
6. Cross-Border Valuation...21
6.1. Relative Valuation ...22
6.2. Discounted Cash Flows Method...22
7. Types of Acquisitions...23
7.1. What is behind M&A’s Process?...24
7.2. Is M&A a loser’s game? ...26
7.3. Methods of Payment: How to choose? ...27
8. Cross-Border Trends ...28
9.1. Food & Beverage Industry...30
9.2. Market Growth Trends...31
9.3. Market Drivers ...32
9.4. Food & Beverage Market Share...34
9.5. Confectionery Industry Market Share...35
9.6. Confectionery Market Share by Consumer Segment...36
9.7. Food & Beverage Industry Costs...37
9.8. Food & Beverage Industry M&A Activity ...37
10. About Kraft Foods, Inc...38
10.1. General...38
10.2. History...39
10.4. Net Revenues...40
10.5. Net Revenues by Consumer Segment ...41
10.6. Net Revenues by Geographic Segment...41
10.7. Net Revenues by Consumer & Geographic Segment ...42
10.8. Products...43
10.9. Organic Net Revenues ...43
10.10. Operating Income ...44
10.11. Capital Expenditures (CAPEX)...45
10.12. Operating Costs ...46
11. About Cadbury Plc ...46
11.4. Revenues by Consumer Segment ...48
11.6. Operating Costs ...50
11.7. Capital Expenditure ...50
12. Emerging Markets ...50
13. Kraft Foods’ Forecasted Cash Flow ...51
13.1. Revenues ...52
13.1.1. North America Market ...52
13.1.2. European Market ...53
13.1.3. Developing Markets...54
13.2. EBITDA...54
13.3. Amortization and Depreciation ...55
13.4. Capital Expenditure ...56
13.5. Net Working Capital...56
13.6. Average Weighted Cost of Capital (WACC) ...57
13.7. Adjusted Present Value (APV)...58
14. Relative Valuation...58
15. Sensitivity Analysis...61
16. Cadbury’s Forecasted Cash Flow...62
16.1. Revenues ...62 16.1.1. BIMA...63 16.1.2. Europe...63 16.1.3. Americas ...64 16.1.4. Pacific-Asia ...64 16.2. EBITDA...64
16.3. Amortization and Depreciation ...65
16.4. Capital Expenditure ...66
16.5. Net Working Capital...66
16.6. Average Weighted Cost of Capital (WACC) ...67
16.7. Adjusted Present Value (APV)...68
17. Relative Valuation...68
18. Sensitivity Analysis...70
19. Kraft Foods & Cadbury Merged Valuation ...72
19.1. Merged Valuation without Synergies ...72
19.2. Merged Valuation with Synergies ...73
19.2.1. Revenue-enhancing Synergies...74
19.3. Value of Synergy ...78
20. Acquisition...79
20.1. Acquisition Offer ...79
20.2. Shareholder’s Value at Risk...80
20.3. Synergies to Meet the Premium...81
20.4. Mode of Acquisition ...82 20.5. Method of Payment...83 21. Conclusion ...84 Appendix ...85 Bibliography...101 Other References: ...103
LIST OF TABLES
TABLE 1 - VALUATION METHODS ...14
TABLE 2 - KRAFT FOODS MULTIPLES...59
TABLE 3 - KRAFT FOODS SCENARIOS ...61
TABLE 4 - KRAFT FOODS SENSITIVITY ANALYSIS...62
TABLE 5 - CADBURY'S MULTIPLES...69
TABLE 6 - CADBURY'S SCENARIOS ...71
TABLE 7 - CADBURY'S SENSITIVITY ANALYSIS...71
TABLE 8 - COST SAVINGS...75
TABLE 9 - G&A COST SAVINGS...75
TABLE 10 - DISTRIBUTION COST SAVINGS...76
TABLE 11 - MARKETING COST SAVINGS...76
TABLE 12 - R&D COST SAVINGS...76
TABLE 13 - MERGED FIRM CAPITAL STRUCTURE ...77
LIST OF FIGURES
FIGURE 1 - FOOD & BEVERAGE INDUSTRY PERFORMANCE 2007-2010...30
FIGURE 2 - GTCF INDEX VS S&P 500 (2006-2011)...31
FIGURE 3 - PRIVATE LABEL IN WESTERN EUROPE ...33
FIGURE 4 - COMMODITIES' PERFORMANCE 2005-2011 ...33
FIGURE 5 - TOP 10 F&B INDUSTRY MARKET SHARE 2008 % ...34
FIGURE 6 - KRAFT FOODS AND CADBURY'S MARKET SHARE 2001-2008 ...35
FIGURE 7 - MARKET SHARE 2009...35
FIGURE 8 - MARKET GROWTH RATE (2003-2008) ...37
FIGURE 9- GLOBAL CONFECTIONERY MARKET...36
FIGURE 10 - F&B INDUSTRY M&A TRANSACTIONS 2005-2011 ...38
FIGURE 11 - KRAFT FOODS PERFORMANCE 2004-2009...40
FIGURE 12 - KRAFT FOODS NET REVENUES...40
FIGURE 13 - NET REVENUES BY CONSUMER SEGMENT...41
FIGURE 14 - NET REVENUES BY GEOGRAPHIC SEGMENT...42
FIGURE 15 - NET REVENUES BY CONSUMER AND GEOGRAPHIC SEGMENT...42
FIGURE 16 - NET REVENUES BY PRODUCT ...43
FIGURE 17 - ORGANIC NET REVENUES...43
FIGURE 18 - OPERATING INCOME ...44
FIGURE 19 - OPERATING INCOME BY GEOGRAPHIC SEGMENT...44
FIGURE 20 - OPERATING INCOME BY CONSUMER SEGMENT ...45
FIGURE 21 - CAPEX BY GEOGRAPHIC SEGMENT...45
FIGURE 22 – CADBURY’S NET REVENUES...47
FIGURE 23 – NET REVENUES BY GEOGRAPHIC SEGMENTATION (%)...48
FIGURE 24 - REVENUES BY GEOGRAPHIC SEGMENT (BN)...49
FIGURE 25 - CAPEX ...50
FIGURE 26 - MARKET ACCESS...51
FIGURE 28 - EV TO SALES ...60
FIGURE 29 - CADBURY'S EV TO EBITDA...70
FIGURE 30 - CADBURY'S EV TO SALES...70
FIGURE 31 - MEET-THE-PREMIUM LINE...81
FIGURE 32 - CAPABILITIES / MARKET ACCESS MATRIX ...82
LIST OF APPENDIX
APPENDIX 1 - CONFECTIONERY MARKET SHARE ...85
APPENDIX 2 - CHOCOLATE MARKET SHARE ...85
APPENDIX 3 - GUM MARKET SHARE ...85
APPENDIX 4 - SUGAR MARKET SHARE ...86
APPENDIX 5 - KRAFT FOODS' OPERATING COSTS...86
APPENDIX 6 - CADBURY'S REVENUES BY CONSUMER SEGMENT ...86
APPENDIX 7 - CADBURY'S OPERATING COSTS...87
APPENDIX 8 - KRAFT FOODS' INCOME STATEMENT ...87
APPENDIX 9 - KRAFT FOODS' BALANCE SHEET ...88
APPENDIX 10 - KRAFT FOODS NET DEBT AND WC...88
APPENDIX 11 - KRAFT FOOD'S DATA...89
APPENDIX 12 - KRAFT FOODS' APV...89
APPENDIX 13 - KRAFT FOODS' FCFF BASE CASE...89
APPENDIX 14 - KRAFT FOODS' BULL CASE (WACC AND APV) ...90
APPENDIX 15 - KRAFT FOODS' BEAR CASE (FCFF AND APV)...90
APPENDIX 16 – KRAFT FOODS’ CASES...91
APPENDIX 17 - CADBURY'S INCOME STATEMENT ...92
APPENDIX 18 - CADBURY'S BALANCE SHEET...93
APPENDIX 19 - CADBURY'S NET DEBT AND WC...94
APPENDIX 20 - CADBURY'S DATA ...94
APPENDIX 21 - CADBURY'S FCFF...95
APPENDIX 22 - CADBURY'S APV...95
APPENDIX 23 -CADBURY'S BEAR CASE (FCFF AND APV)...96
APPENDIX 24 - CADBURY'S BULL CASE ( FCFF AND APV) ...97
APPENDIX 25 - CADBURY'S CASES ...97
APPENDIX 26 - MERGER WITH NO SYNERGY INCOME STATEMENT...98
APPENDIX 28 - MERGER FCFF AND APV...100 APPENDIX 29 - MEET THE PREMIUM LINE CALCULATIONS...100
1. Introduction
The aim of this dissertation is to focus on a determinant aspect of Corporate Finance that is Mergers and Acquisitions (M&A). In order to achieve that, it is necessary to present two firms and their respective strategic and financial reasons to justify a process of M&A. Specifically, this dissertation explores the real case of Kraft Foods - world’s second largest manufacturer and packager of food products – and Cadbury - the world’s second largest confectionery firm. This dissertation not only provides a practical analysis of the main issue regarding a process of M&A, but also theoretical framework about M&A.
The first part of the dissertation is composed by the literature review section where a compendium of diverse academic articles regarding valuation process and aspects related to M&A deals is presented, such as type of acquisitions, M&A activity and methods of payment. This theoretical part is going to be used as a guideline for the practical part – valuation and acquisitions section.
The second part is the industry and firms analysis section. The Food & Beverage and Confectionery Industry are going to be introduced and its performance accessed through present and past data. In addition, Kraft Foods and Cadbury are going to be described and analysed based on the information collected in their interim reports. This section is highly important to help identify the market drivers in the each industry and to understand the determinant factors that made Kraft Foods and Cadbury grow over time.
Afterwards the performance forecast section is presented, where Kraft Foods’ and Cadbury’s standalone valuations are defined, according to the literature guidelines. To access the value of each firm it was created a model with its respective assumptions. To analyse the M&A process, another model was created but this time to access the merged value and the mix of synergies created.
After concluding the valuation process, the last section is dedicated to the acquisition offer. This section is going to be partially explored by addressing how the synergy’s benefits should be distributed and how much Kraft Foods should pay for Cadbury. Also, in this section are presented some models that can help to certify if there are enough mix of synergies to compensate the premium offered and if the expectable synergies are plausible or not.
2. About Valuation Methods
Value the value is the basis of market economy (Copeland, T.E., et al, 2000). To have access to the performance of an investment, a bond, a derivative or a firm’s share, it is indispensable to measure the amount of the value it creates. According to Luehrman (1997), every resource-allocation decision a firm makes lies in what that move is worth and if the firm estimates that that value is a key driver of the firm’s overall performance.
In the M&A process, valuation is the most important component in the analysis (Hitchner, 2006). However, given the multiplicity of valuation methods it is important to understand their inputs to better apply them, since they “are different ways of expressing the same underlying model” (Young, M. et al, 1999).
Young’s classification first characteristic is based on the distinction of methods focus on Equity Values – this approach estimates the value of a firm to equity holders - and methods focus on Enterprise Value – while these approach values the whole enterprise, not only the equity but also the debt.
Second characteristic of Young’s classification is the distinction between cash-flows, returns and multiples. Damodaran (2002), defines that cash-flow assumes the value of an asset that corresponds to the present value of all expected future cash-flows. Whereas Returns-Based approaches are focused on the capital stock and the spread between the return and cost of capital. (Young, M.et al, 1999).
At last, Multiples (Relative Valuation) is based on the principle that a firm’s asset can be compared with other similar firms in the same industry by using a multiple (Damodaran, 2002). The value is estimated by multiplying the ratio, or multiple, from the comparable firm by the performance measure for the firm being valued (Kaplan et al., 1996).
Multiples
Dividend Yield
Enterprise Value to Capital Enterprise - Value to EBITDA
Dynaminc ROE Economic Value Added Dividend Discount Model Discounted Cash Flow
P/B Value
Free Cash Flow Yield
Returns Based Approache s Cash Flow Approaches
Equity Enterprise Values
P/E Ratio Enterprise - Value to EBIT
According to Luerhman (1999), most firms use a set of approaches to better estimate value, but discounted-cash flow analysis (DCF) is considered the best practice for valuation, despite valuation models being always a function of three factors – cash, timing and risk.
In this dissertation only Free Cash Flow to the Firm (FCFF), Adjusted Present Value (APV) – both methods belong to cash-flow approaches –and Relative Valuation are going to be used in the valuation process.
3. Cash Flow Approaches
These approaches are heavily based on assumptions and can be explained in two steps. The first step is to forecast the future cash flows of a firm, which means the future intrinsic value of a firm’s assets for each period on the analysis, the second step is to discount the forecasts to present value at a properly discount rate that reflects the riskiness of those streams (Luehrman, 1997).
3.1. Free Cash Flow to the Firm (FCFF)
Free Cash Flow to the Firm is the most common used valuation technique to compute Enterprise Value. This approach consists in discounting all the firm’s expected cash flows using the WACC rate (Damodaran, 2002).
= ∑
( )+
(( ))Free Cash Flow is the cash generated by an all-equity financed project to distribute to all its suppliers of capital (Kester, W. et al., 1995), prior to operating expenses, taxes and reinvestment needs, but before any payment of interests to debt-holders or dividends to stockholders (Damodaran, 2002).
= (1 − ) + − − ∆
There is no mention of tax benefits, such as interest tax shields, in computing FCFF because the WACC is computed after-taxes and already captures them (Damodaran, 2002).
3.2. Terminal Value (TV)
FCFF approach is divided in two stages, the first one that represents the present value of cash flow for an explicit period of time and the second one, that represents a Terminal Value. Since it is impossible to compute firms’ cash flows forever, after the explicit period is determined the Terminal Value that represents the firms’ value at that period (Damodaran, 2002).
This Terminal Value is heavily dependent on the growth rate that cash flows are expected to grow as and the discount rate.
3.3. Growth Rate (g)
According to Damodaran (2005), growth rate is the critical input in valuation process, since it determines how revenues and earnings will evolve in the future.
To determine a consistent growth rate, Damadoran (2005), suggests observing the firms’ past earnings (historical growth rates) or to estimate the growth rate accordingly with the firms’ fundamentals, based on the firms’ reinvestment rate and return on capital.
= ×
= − + ∆ (1 − )− ℎ
= ( 1 − )
3.4. Weighted Average Cost of Capital
The weighted average cost of capital (WACC) is the most commonly-used DFC approach that represents the opportunity cost of investing capital in projects with similar risk and duration; it is difficult to measure it reliably because it is an excepted rate of return. The opportunity cost of capital varies differently depending on the firm and business’ risk
This method is quite contested by academics. Modigliani & Miller (1958) defended that managers by changing a firm’s capital structure cannot change a firm’s value.. For some
academics1, it is a valid and simple model suitable for less complex structural firms. Others
believe that this method is obsolete, since it is a method suitable only for simple firms with a stable capital structure, tax position or fund-raising strategy2. They also argued that WACC is
modeled to handle with financial side effects automatically, but only for interest tax shields according to very inflexible assumptions (Luehrman, 1997).
To
successfully implement the cost of capital it is very important to analyse the components that the WACC embraces: the cost of equity, the after-tax cost of debt, and the company’s target capital structure (Copeland, T.E. et al., 2000).= × + × × (1 − )
3.5. Cost of Equity
The capital asset pricing model (CAPM) was first introduced by Sharpe (1964), Lintner (1965) & Mossin (1966) and allows pricing securities by exploring the relationship between the risk of an asset and its expected return. This model is focused only on non-diversifying risk, since investors can reduce their exposure to other risks – specific to that security - by diversifying their investments.
Based on a set of assumptions3, this model allows to reach a benchmark rate of return for
investments.
( ) = + ( − )
Where ( ) is the security expected return, is the risk-free rate, is security’s beta and is the expected return on the stock market as a whole. These components are going to be mentioned later.
The cost of equity is defined as the expected return on a company’s stock and the expected return is the shareholder’s opportunity cost of the equity funds employed by the company (Mullins, Jr., 1982). Therefore, using CAPM makes it possible to compute the firm’s cost of equity levered and unlevered. The use of debt makes the firm riskier than an all-equity firm, since it faces the existence of distress costs. Because of that, the cost of equity turns out to be more expensive. That is why the cost of equity unlevered is smaller than cost of equity levered.
1Damodaran, A. (2002) Investment Valuation 2nd Edition. New York: Wiley Finance.
2When is expected that the firm will vary its capital structure it is needed to make adjustments not only project by project, as well as period by period in each project (Luehrman, 1997).
3The model assumes a perfect capital market (no taxes on returns or transaction costs), also that all investors are mean-variance optimizers and all with homogeneous expectations and beliefs, and that they can borrow and lend any amount at a fixed risk-free rate.
= + ( − ) = + ( − )
3.6. Risk-free rate
According to Damodaran (2005), risk can be defined as “the likelihood that we will receive a return on an investment that is different from the return we expected to make”.
By this definition a risk-free rate is when the outcome of an investment is expected with certainty, meaning there is no default risk. The default risk is measured with a bond rating and the interest rate is computed by adding a default spread to the riskless rate (Damodaran, 2002). Since any firm has a measure of default risk for larger or safest it can be common practice to view government securities - Treasury Bills (short-term) and Treasury Bonds (long-term) – as risk-free assets.
In valuation Treasury Bonds are used more often. Copeland, T. et al (2000) indicates for valuation purposes a 10-year Treasury Bond4, however it is imperative to have consistency
between the risk-free rate and the cash-flows’ period in the analysis process
.
3.7. Beta
( )
Beta is a measure of sensitivity. In the CAPM beta represents a stock’s incremental risk to a diversified investor, where risk is defined as how the stock co-varies with the market (Copeland, T. el al, 2000).
= ( , )
To estimate a firms’ beta, in the valuation process, accordingly to Copeland, T. el al (2000), it is better to use an industry-derived unlevered beta re-levered to the firms’ capital structure, since firms’ specific betas vary too much to be reliable.
= 1 + × (1 − )
3.8.
Equity– Risk Premium (
−
)
Equity risk premium is a key component in many pricing models5 and it can be defined as the
compensation risk for the expected return on any investment. It is the difference between the market risk and the risk-free rate. The market risk reflects the expected returns on all risky investments as a whole.
According to Damodaran (2005), the equity risk premium is what investors see in an economy/market and what price they should attach to that risk. Equity premium risk is the main responsible in how investors allocate wealth and in which type of securities they invest.
The equity risk premium is determined by several macroeconomic, volatility and behavioral factors. Damodaran (2005) mentioned some, such as risk aversion – if investors become more risk averse, the equity premium will increase -, economic risk – general concerns about the overall economy, information – the quality and quantity of information available to investors may affect their investment decisions and their confidence level on it, liquidity – illiquidity assets demand a higher premium, catastrophic risk – the risk of a drop in economy output or a default by the government, behavioral irrational component – investors do not always behave rationally.
Copeland, T. et al (2000) presents three essential pointers to estimate equity risk premium: Measuring and extrapolating historical returns;
Regression analysis to link current market variables to project the expected market risk premium;
Using reverse engineering to assess the market’s cost of capital using DFC valuation.
4. Adjusted Present Value (APV)
One alternative to the Weighted Average Cost of Capital (WACC) is the Adjusted Present Value (APV), introduced by Myers (1974), which is considered a better tool, since it “always works when WACC does not” (Luerhman, 1997).
The main advantages of APV over WACC are its flexibility and transparence, since it allows managers to segregate and analyse separately the different components of value.
The fundamental idea behind APV is “value additivity” (Luerhman, 1997), following the propositions of Modigliani & Miller, and it can be explained in three steps. In the first step, it
values the project as if the firm was an all-equity firm, using the DCF valuation to assess the present value.
= (1 + ) + (1 +[( ))]
The second step, it evaluates the financing side effect by adding them to the firm’s unlevered value, such as interest tax shields, cost of financial distress, subsidies, hedges and issue costs. In the literature is discussed that tax shields should be discounted at an appropriate risk-adjusted rate, however there is no agreement on how risky tax shields are. Accordingly with Luerhman (1997), the average firms’ cost of debt is commonly used with an upward adjustment. However, Copeland, T. el al (2000) defends that interest tax shields should also be discounted by cost of equity unlevered rate, since firms will manage its debt-to-value ratio to a target level - making debt grow with the business - so the value of interest tax shield will track the risk of operating assets. = × × (1 + ) + × × ( ) .
The third step is to evaluate expected bankruptcy costs given the firms’ level of debt.
= ×
This estimate is considered the most challenging in the APV approach, since the probability of default and bankruptcy costs cannot be estimated directly. To estimate the probability of default it is necessary to estimate a bond rating for each level of debt, and estimate their probability of default separately.The bankruptcy cost is a statistical probability that needs to take into account the firms’ characteristics and the firms’ level of debt (Damodaran, 2002).
Finally, the Enterprise Value is given by:
= + ( ) − ( )
This “additivity” characteristic allows to understand by segregating all business operations components, as well as interest tax shields and bankruptcy costs, where and how the value is being created.
5. Relative Valuation
Goedhart et al (2005), Damadoran (2005), Copeland, T. el al (2000), defended that a careful analysis comparing a firm’s multiples with its peers can lead to a more accurate valuation, since some errors in estimating firms’ value by using DFC approach are very common, especially in computing firms’ return on invested capital (ROIC), growth rate and its weighted average cost of capital.
The value is estimated by multiplying the ratio or multiple from the comparable firm by the performance measure of the firm being evaluated (Kaplan et al., 1996).
Relative valuation is based in two components. First, to value assets in relative value, prices have to be standardized by using multiples of earnings, book values or sales. Second, the peers must be comparable firms taking into account risk, growth, cash flows, as well as returns on invested capital and capital structures (Goedhart et al, 2005; Damodaran, 2005).
Goedhart et al. (2005) defends the use of forward-looking multiples for a more accurate valuation, which means a multiple that can forecast profits. Goedhart also defends the use of enterprise-value multiples instead of equity-value multiples since they are less affected by the capital structure they are not vulnerable to manipulation.
Kaplan et al. (1996), also defends the use of EBITDA, EBIT, net income and revenue to perform the valuation.
The disadvantage of this approach is that comparable firms are very difficult to find, since it is very difficult to match return on invested capital and growth expectations (Goedhart et al, 2005). The lack of assumptions in this approach can lead to a biased analysis, since this method is vulnerable to manipulation, such as the P/E ratio that can be artificially increased by swapping debt for equity (Goedhart et al., 2005). At last, it is important to use multiples in a consistent manner to avoid the creation of misleading valuations.
6. Cross-Border Valuation
Cross-border investments are a prominent internationalization strategy that is responsible for a significant impact in economy’s value creation, since in the last decades. Cross-border trends and growth factors are mentioned later6in this thesis.
This topic will focus on the most common approaches to evaluate cross-border investments and the major issues that commonly affect such valuations.
In a general perspective, the basic considerations for a cross-border investment should be the same as for a domestic acquisition; nevertheless in a cross-border there are more risk dimensions that must be taken into account and because of that valuation metrics must be adjusted.
6.1. Relative Valuation
In a cross-border transaction, the use of multiples is also a complementary approach and must follow the same consistence in the valuation process like in as the domestic transactions. Nevertheless, according to Zenner el al., (2008), the main problem is that in many countries there is a scarcity of comparable firms or transactions per country and industry.
6.2. Discounted Cash Flows Method
This approach is more flexible to adjust and, at the same time, more challenge, due to the difficulties in estimating future cash flows and the discounting rate in cross-borders (Zenner, M. et al., 2008). In the literature there are two different methods to apply the DFC approach (Kester, W., et al., 1995), however both paths require an appropriate adjusted-discount rate:
Method A: Discounting Foreign-Currency Cash Flows:
This method involves converting the Net Present Value to the Home Currency at the spot exchange rate. The cash-flows are discounted at foreign-currency rate;
Method B: Discounting Foreign-Currency Cash Flows converted to Home Currency: This method involves the conversion of foreign currency amounts into home
currency and the subsequent discounting of the converted cash flows at the home-currency discount rate;
Although both methods should not differ in terms of value, Zenner, M., et al., (2008) defends the use of both methods to validate assumptions.
To adjust the discount rate in a cross-border acquisition several risk dimensions must be taken into account. The approach followed in this thesis to measure the discount rate is the CAPM as already was mentioned, which reflects the non-diversified risk surrounding the investment, as well as the tax advantages associated by the use of debt, as well as the equity risk premium expected. However, there are others dimensions such as country/industry risk, exchange rate
risk, political risk (especially in developing market firms) and liquidity risk (Bodnar, et al., 2003).
According with Kester, W. et al., (1995), it is not very consensual how the discount rate should be adjusted, since adding additional risk premium in the discount rate can introduce errors into the analysis. Also, according to the same author, the assumptions must be very clear about what type of non-diversifiable risks the cross-borders’ beta are not correctly capturing and then adding a premium to the discount rate.
Beta’s choice must account to how much the acquirer’s stockholders are exposed in the markets, if they are global fully-diversified investors or local investors more vulnerable to a specific market.
Kraft Foods is an American firm and Cadbury is an English firm. To merge both cash-flows in the valuation process it was followed Method A.
7. Types of Acquisitions
In the literature, Mergers and Acquisitions’ (M&A) terminology can be quite confusing, since many research terms, such as “merger”, “acquisition” and “takeover”, can be used interchangeably due to the meanings’ similarity between them (Ghauri& Buckley, 2003; Cartwright & Schoenberg, 2006; Brealy, Myers & Marcus, 2001; Sugiarto, 2000).
Defined as a set of different transactions, acquisitions can be categorized based upon the acquirer’s nature and what happens to the acquired firm (target firm) after the acquisition process (Damodaran, 2002).
There are four different recognized possibilities for a firm to be acquired by another firm: a merger, a consolidation, a tender offer and an acquisition of assets.
A merger is usually a friendly deal and enjoys the cooperation of firms 7(Loughran&Vijh,
1997). It represents the combination of two firms into one where the acquiring firm assumes all assets and liabilities of the bidding firm that ceases to exist, since it becomes part of the acquiring firm, and its preceding shareholders receive cash and/or securities in the acquiring firm. In a consolidation, the process is similar, except it results in a new firm composed by both acquiring and acquired firms, each one with a percentage of the ownership (Damodaran, 2002).
7For the merger to happen both parts must agree, at least 50% of the shareholders of the acquiring and the target firm (Damodaran, 2002).
A tender offer occurs when the acquiring firm commits itself publicly to buy the outstanding stock of the target firm at a specific price. The target firm tends to exist as long as there are minorities of stockholders who refuse the tender. Usually, tender offers can turn into a hostile takeover or into a merger (Damodaran, 2002).
The last possibility is one firm acquiring the assets of another firm, as a formal investment, and the firm whose assets were purchased continues in activity.
Another form of acquisition is when the firm is acquired by its own management –
management buyouts – or by outside investors – leveraged buyouts, through a tender offer.
After this transaction, the acquired firm can cease to exist as a publicly traded firm and become a private firm (Damodaran, 2002).
Traditionally, there are three categories of mergers (Buckley & Ghauri, 2003): Horizontal – between firms in the same industry;
Vertical – between firms in the value chain linkage; Conglomerate – between firms in unrelated business.
7.1. What is behind M&A’s Process?
There are much of literature that justify that the fundamental reasons for the existence of M&A’s processes is the argument that they will create synergy.
Synergy is the additional value that is generated by combining two firms, creating opportunities that
would not been available to these firms operating independently (Damodaran, 2005). Nevertheless, during the process of evaluating the synergies it is important to highlight the concept value of control that should not be confused with synergy. The value of control is the incremental value that an acquirer believes can be created by running a target firm more efficiently (Damodaran, 2005). The incremental value is created by the target itself and not by the combination with another firm.
Accordingly with Damodaran (2005), synergies must be influenced by one of four inputs into the valuation process: higher cash flows from existing assets, higher expected growth rates, a longer growth period or a lower cost of capital.
There are two considered sources of synergies: operating synergies and financial synergies.
Operating synergies (Increasing Revenues / Decreasing Costs) allows firms to increase their
operating income from existing assets, mainly through economies of scale (enabling the combined firms to be more cost-efficient and profitable), economies of scope (functional strengths that can be
transferable across businesses), greater price power and higher growth in markets that can lead to higher margins and growth rates.
Financial synergies (higher cash flows / lower cost of capital) are possible when the combined firms
have different opportunities available, such as a firm with cash slack and with limited projects opportunities and a firm with higher-return project but no cash available. Another possibility is when debt capacity increases8, since the combined firms become more stable and predictable, reducing
default risk, due to less variable cash flows, what allows them to borrowing more. There are several financial synergies derived from tax benefits, cash flows can increase due to higher tax deductions that sheltered income, also the acquirer can take advantage of tax laws to write up the Target Company’s asset, resulting in higher tax savings from depreciation. There are other financial synergies although mentioned as dubious in the literature, such as diversification and accretive acquisitions. A diversification strategy is known by providing the lowest exposure to risk for any given level of expected return through the acquisitions of imperfect correlated assets9. However it seems difficult to
prove value creation relates directly to M&A’s10, since the market reacts negatively to the
announcement of diversifying acquisitions (Damodaran, 2002) and because diversifying could result in a reverse synergy due to the lack of expertise related to the business.
To evaluate synergies is used a DCF framework that follows the same procedures, first analyzing the companies separately (Status Quo Valuation) and afterwards analyzing both firms together with no synergy and with synergy, with the difference between those last two showing the synergy value. Based on assumptions and forecasts, synergies are difficult to measure not just in value but in time. It is not just relevant to know how much is the synergy value but also when they will start affecting cash flows; the longer it takes to show up, the less it values.
So to avoid a “synergy trap”, this means, to pay a high premium for a firm that will not create the expected synergy, Sirower&Sahni (2006) suggests an “earnings” model for the target that through a combination of cost reductions and revenue enhancements would justify a given premium that can be used as a benchmark for any deals.
The author defines that one unit of the target’s offer premium is the product of the premium (%P) and equity market value of the target firm, meaning in order to earn one unit of premium offered of the target, the target’s after-tax earnings ( ) must increase by %P.
% × = % × ( × ) × (1 − )
8This argument assumes that both the acquiring firm and the target were at their optimal debt capacities prior to the merger. The merger reduces the overall risk in the combined firm and increased the optimal debt capacity (Damodaran, 2002).
9Bodie, Z., Kane, A., and Marcus, A.J. (2008) Essentials of Investments (7th edition), Boston: McGraw-Hill Irwin.
10Bruner, R.F. (2004) “Where M&A Pays and Where It Strays: A Survey of the Research”, Journal of Applied Corporate Finance, 16(4), pp. 63-76.
Where R is the revenue, the pretax profit margin and T the affective tax rate.
This represents that for each percentile unit of offering premium over the target’s pre-announcement market value, the target must generate the same percentile unit increase in pretax profit margin.
This increase must be delivered by pre-tax synergies, which can be created not only by revenue enhancement but by cost reduction as well.
% = % × ( × )× (1 − )
After achieving the pre-tax synergies, Sirower&Sahni (2006) also suggests to plot graphically the solutions in a MTP11 line to best analyse the business combination of cost savings and revenues
enhancements. This graphic is illustrated in section 20.3 of this dissertation where the MTP Line’s importance is straightforward: deals below the line should be avoided.
7.2. Is M&A a loser’s game?
Accordingly to Bruner (2004), there is a “conventional wisdom” that M&A is a loser’s game, “only about 20% of all mergers really succeed (…)” , an idea also present in Ghauri& Buckley (2003).
Wealth gains in M&A trigger some disagreement between researchers, in part due to differences in how returns are computed what generates incomparable results and a lack of feasible metrics to analyse the value creation in M&A. Also, some of those studies are focused on accounting measures, such as net income, ROE, ROA and EPS, leverage and liquidity and are structured to matched-sample comparisons in which acquirers’ performance are set against peers (non-acquirers) of similar size, in the same industry (Bruner, 2004).
Ghauri& Buckley (2003), defend that the assumption of profitability in a M&A is erroneous, based on the argument that if the market price fully reflects the future profit stream of the acquired assets, then there is no scope for profit from acquisitions.
However, accordingly with Loughran&Vijh (1997), there are three patterns established in the literature:
Target shareholders earn significantly positive abnormal returns from all acquisitions; Acquiring shareholders earn little or no abnormal returns from tender offers;
Acquiring shareholders earn negative abnormal returns from mergers.
Nevertheless, the authors conclude that the target shareholders that hold on to the acquirers’ stock received as payment find their gains diluted over time. As already was mentioned, there is a relationship between post-acquisition returns of acquirer’s stock and the mode of acquisition, as well as the form of payment (Loughran&Vijh, 1997):
On average, the acquirers earn less excess returns from mergers than from tender offers; On average, stock acquirers earn less excess returns than cash acquirers;
On average, stock mergers earns significantly negative returns; On average, Cash tender offers earn significantly positive returns.
Although Sirower&Sahni (2006) show results that meet the patterns mentioned above, it states that the stock market reacts negatively to a M&A announcement, which reflects the investors’ skepticism about the ability of the acquirer to maintain the original values of both firms and also the achievement of synergies justifying the premium paid.
To mitigate part of the skepticism, Sirower&Sahni (2006), created a simple measure to assess synergy risk very similar to the VAR concept, where with one number it is possible to show how much of the acquiring company’s value is at risk if no post-acquisition synergies are realized.
=
M&A clearly pays for the shareholder target and the combined shareholders’ generates positive abnormal returns, meaning that there is a value creation in the economy (Bruner, 2004). However, it is important to highlight not only the importance of valuation knowledge, but also the firms’ strategy and post-merger management ability.
7.3. Methods of Payment: How to choose?
It is possible to finance an M&A through cash, stock, a mix of cash and stock, or through an “earn out” contract12 (Zenner et al., 2008). However, literature shows that the terms of the
transaction, such as form of payment, have a significant influence on M&A profitability for the buyer (Bruner, 2004).
According to Travlos (1984), there are three main arguments that explain why each method of payment reflects in different valuation effects on the bidding firm’s common stock prices. The first argument is based on a world of asymmetric information13; the method of payment
may signal information to the market, assuming that if the acquirer firm possesses information about the intrinsic value of their firm, which is not reflected in the pre-acquisition stock price, they will try to finance the acquisition in the best suitable way for shareholders. Following Myers &Majluf (1984), managers will prefer a cash offer if they believe they are undervalued, while a common stock exchange offer will be preferred if they believe they are overvalued. Therefore, based on the extant literature the returns to the acquirer firm will be always higher in cash offers than in common stock exchange offers.14
The second argument is based on the fact that cash and stock offers have different tax implications. Due to this difference the acquirer firm must pay a higher value in case of a cash offer than in case of a stock offer, in part due to the additional tax. Since cash offers generate tax obligations for the target firms’ stockholders but allow the acquiring firm to raise the depreciation basis of acquired assets to their market value, common stock offers are, in general, tax-free acquisitions, so that any capital gains realized by the target firms’ stockholder are deferred until the stock is sold, but the depreciation basis of the acquired assets remains the same (Travlos, 1987).
The last argument is related to the debt capacity, as mentioned earlier the combined firms can have less variable cash flows, reducing default risk, increasing the debt capacity. The benefit from increasing debt capacity accrues to the merging firms’ bondholders at the stockholders’ expense. Thus, a common stock exchange offer leads to a wealth transfer from stockholders to bondholders, implying a fall in the stock price.
8. Cross-Border Trends
Cross-border has expanded as developed-market firms searched for growth opportunities in emerging markets and it is considered a common form of investment, in the last decades. However, in the last few years, the reverse situation appears to be the new catalyst to new cross-borders investments - developing-market firms started looking for new markets overseas. This new paradigm is hand in hand with financial crises that reduced domestic competition in
13Assumes that one partner has access to private information that is not known by the other partner. 14Loughran&Vijh (1997); Bruner (2004); Zenner et al. (2008); Travlos (1987)
developed-market firms and weakened the developed countries currencies, especially U.S. dollar.
Zenner, M. et al., (2008) considered some factors responsible for cross-borders M&A’s growth, divided into long-term and short-term drivers. In the long-term drivers, there are three main factors: globalization - the soaring necessity to meet growth expectations took firms to seek for new markets in foreign countries; diversification– for developed-market firms a way of conquer new markets, for developing-market firms a way to reduce the exposure to sovereign risk; deregulation – the elimination of some nationalistic and protectionist forces in many countries allowed the entering of foreign countries into domestic markets (for example: creation of European Union). In the short-term drivers, there are four factors: high relative equity
valuations – companies tend to be acquirers when their stock prices are high, meaning
prospects of growth and profits. In the last few years, developing-market firms are benefiting from higher equity evaluations comparing with developed-market firms; major currency shifts
– emerging-market currencies have appreciated in relation to developed-markets currencies,
which turned developed-market firms more appealing and accessible; sovereign wealth funds – the main objective of those funds is to generate a future income and not to be exposed to the sovereign risk of its own country, so that the income is invested into long-term investments, such as acquisitions of illiquid foreign assets; reduced competition – due to the reduced liquidity in the debt markets, mainly in developed–markets, this made the public firms reluctant on investing in a long-term where future is so uncertain; for private firms this scenario is even more drastic, since private firms are very dependent on leverage markets. On the other hand, developing-market firms have access to more liquidity and leveraged markets, which increased their acquisition power.
Between the years 2003 – 2006, cross-border acquisitions accounted for less than 30% of all total acquisitions and in 2007 that percentage rose to 40%. Also, for a period between 2001 – 2007, acquirers from developing-market firms15increased by 1.4% and acquirers from the U.S.
decreased by 2.1% (Zenner, M. et al., 2008).
9. Industry Overview
This section is divided in four parts. The first part features a Food & Beverage Industry analysis, focused especially on the Food Packaged Industry, where the Confectionery Industry belongs; the second part shows a Kraft Foods’ and Cadbury’s cash flow analysis; the third part is focused on the strategies behind Cadbury’s acquisition and, at last, the fourth part portraits the M&A activity on Food & Beverage Industry in the last few years.
9.1. Food & Beverage Industry
Food & Beverage (F&B) Industry involves the food industry from farming, food production, packaging and distribution, retail and catering; and beverage industry which is composed by soft drinks (non-alcoholic), beers, spirits and wines (alcoholic). Thereby, the food’s value chain is possible to divide into three categories16:
Farming: production and collection of raw agricultural commodities such as rice, wheat and corn;
Processing: transformation of raw food commodities into forms that can be easily distributed and sold to consumers;
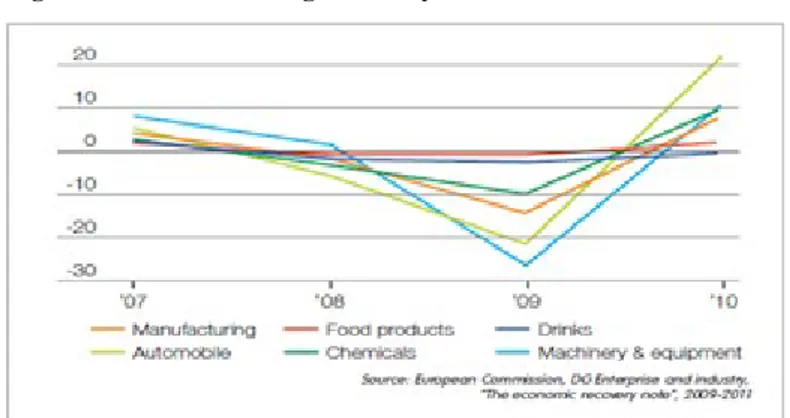
Distribution: finished or near-finished food products are delivered to consumers. As a non-cyclical industry, the Food & Beverage Industry presents certain stability during economic downturns, due to the fact that food products are essential to life and health of the consumers. Looking at Figure 1 despite the decline in consuming spending, the Food & Beverage Industry behaves almost uniquely in the economy, which gives this industry a resilient character. In Europe, while the manufacturing industry decreased by -7.9% between the first quarter of 2008 and the third quarter of 2011, food companies registered a growth of 1.3% during the same period.
Looking at S&P 500 and GTCF Food & Beverage Index17(Figure 2) this last one always beats
the market, even in bear moments as the downturn in 2008. Once again, the resilient character persists.
16IMAP’s Food & Beverage Industry Global Report 2010
17Reflects data from food and beverage industry participants that are broadly categorized as food processors, food distributors, food retailers and beverage companies
9.2. Market Growth Trends
Historically, F&B Industry presents a consistent growth wherein 2001-2011 had a CAGR of 5.2%18. In 2008, global F&B Industry registered revenues of $5.7 trillion and it is expected19to
grow at a CAGR (2008-2014) of 3.5% with estimated revenues of more than $7 trillion by 2014. According to Goldman Sachs, long-term F&B industry estimates are possible, since it is closely tied to income growth. Hereafter, estimates 20point for a CAGR (2011-2020) of 6.6%
driven by a geography mix due to emerging markets exponential growth. Also, it is expected4
that North America market continues to grow at 3%, Western Europe market at 2%, emerging markets at 10.8%, especially China (14.4%) and India (21%), Eastern Europe market at 9%, LatAm market at 9.3% and Middle East and Africa markets at 10.4%.
Food industry is responsible for 56% of F&B industry total revenues. In 2008 is expected to generate earnings of $3.2 trillion at a CAGR (2008-2013) of 4.6% and revenues are expected to increase to $4 trillion by 2013.21
Packaged Food Industry has grew at a CAGR (2001-2008) of 3.1%22and is expected to grow at
a CAGR (2010-2015) of 2.8% 23, valuing over $1.8 trillion in 2008.
Confectionery industry is the fourth largest segment in Package Food with retail sales over $150 billion, in 2008. Confectionery market is growing steadily at 5% CAGR (2003-2008), where 60% of total sales by value are coming from developed markets that are growing at 3% CAGR (2003-2008), while emerging markets are growing at a 10% CAGR (2003-2008).
18Goldman Sachs Investment research, October 23, 2012 19IMAP’s Food & Beverage Industry Global Report 2010 20Goldman Sachs Investment research, October 23, 2012 21IMAP’s Food & Beverage Industry Global Report 2010 22Euromonitor International
23Rexam – consumer packaging report 2011/2012
9.3. Market Drivers
Food industry is highly competitive; players not only compete on price, but also in quality, innovation, brand recognition and loyalty, where the top-10 firms have a market share of 15% of total sales. Costumers have a lot of bargaining power, due to the quantity of products and substitutes in the market, whereas firms must reduce prices to maintain its market share and to answer to competitors and, at the same time, costumer’s preferences.
Food industry is highly correlated with population growth and with consumer spending. Developed countries are expected to stay stagnant, with North America’s population expecting to grow by 0.8% and Western Europe by 0.3%24 in the next years, while developing countries
are expected to grow. By 2050, global population is projected to be 9 billion25, with developing
countries accounting for 85% of participation. To feed the additional 2 billion people it is necessary that global food production increases by 70%. Also, in developed countries consumer
preferences are expected to shift toward high quality and nutritional products, due to a more
health consciousness. Moreover, due to the declining in consumer spending in developed countries pre-packed and home-cook foods products are going to be more appealing. This shifting in consumer preferences allows firms penetration into new niches as diet food, where in Europe is expected to grow at a CAGR of 3.4% (2008-2014) and in US of 4.1%, organic food and frozen food, with an expected CAGR of 3.1% by 2013. On the other hand, developing countries are facing a rising in income levels, which allows the population to acquire more and better product. For firms in food industry this represents an opportunity to gain market share and increase profits by flooding emerging markets with different products. It is forecasted that over the next decade the middle class consumers will double, with over 80% of the increase coming from emerging markets. 26
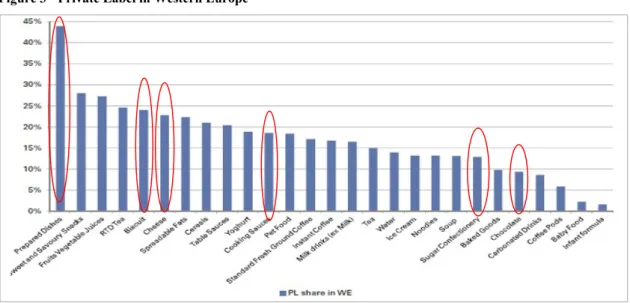
In developed countries due to the declining in consumer spending, most of the retailers started internally manufacturing products marked as their house brands, which are less expensive. Initially considered low-quality products, private label products improved their quality driving a shift in consumer decision-making, competing against large multinational brands. The graphic shows private label share market in Western Europe in many food categories.
24Goldman Sachs Investment research , October 23, 2012 25IMAP’s Food & Beverage Industry Global Report 2010 26Goldman Sachs Investment research, January 25, 2012
As it is possible to observe, in Western Europe, the Private Label share in Prepared Dishes is almost 45%. In Biscuit and Cheese is around 25%. Less than 20% are Cooking Sauces and Sugar confectionery. The least affected seem to be the chocolate confectionery with only less than 10% of Private Label.
However, this industry is highly vulnerable to commodities prices27, as raw materials affect
the firm’s stable profit growth.
Commodities prices are extremely volatile due to global competition for resources, currency fluctuation, weather conditions and consumer demand. Political concerns can also influence commodities prices, such as sovereign risk and agriculture programs. In the middle of 2008, prices rose drastically due to severe weather conditions, a strong supply necessity and a weaker demand (especially from emerging markets). Since 2006, commodities prices are climbing, increasing the raw materials’ input costs of food industry’s firms. Also, higher oil prices
27Dairy, coffee, cocoa, wheat, corn products, soybean, vegetable oils, nuts, meat products and sugar.
Figure 3 - Private Label in Western Europe
increase the transportation costs making the distribution and supply of food products more expensive than usual. These results in a decrease of profit margin for F&B industry firms, since firms are forced to reduce prices and at the same time face higher input, distribution and supply costs. Also, F&B industry firms are not only susceptible to commodities prices but also to plastic, glass and cardboard prices.
At last, innovation is the key factor for success in the Food & Beverage Industry, as a way of conquering higher market share and profits maximization. To be able to do that, firms must answer to consumer’s preferences - that are dictated by demands shifts affected by economic changes in consumers’ lifestyle - by investing in Research & Development, Marketing and Distribution channels.
9.4. Food & Beverage Market Share
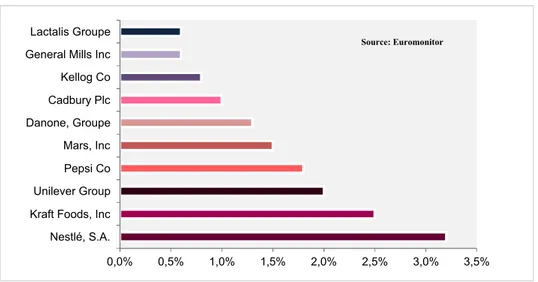
Food & Beverage is a very competitive industry where the top ten packaged food firms only account for 15% of market share of total revenues, where each firm contributes fewer than 3.3%. In 2009, Nestlé, S.A. headed the F&B Industry with a market share of 3.2 %, followed by Kraft Foods Inc, the world’s second largest firm with 2.5%. Cadbury had a small market share of 1%.
Cadbury’s acquisition by Kraft Foods (Figure 6) will change the overall package food firm competitive landscape. Kraft Foods Inc will take the leading position with a market share of 3.5% of total revenues and the gap between competitors will be more widespread. However, to maintain the leading position, Kraft must increase its growth to distance itself from Nestlé, since Kraft will absorb Cadbury’s growth. Firms with lower market share, such as Lactalis Groupe
Figure 5 - Top 10 F&B Industry Market Share 2008 %
0,0% 0,5% 1,0% 1,5% 2,0% 2,5% 3,0% 3,5%
Nestlé, S.A. Kraft Foods, Inc Unilever Group Pepsi Co Mars, Inc Danone, Groupe Cadbury Plc Kellog Co General Mills Inc Lactalis Groupe
and Mars will probably conquer better market share, since they have a higher growth performance, due to aggressive acquisition strategies.
9.5. Confectionery Industry Market Share
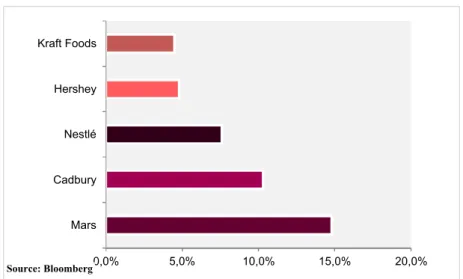
Confectionery Industry is very fragmented (Figure 7), in which the top 5 confectionery industry firms have a market share of 42%, in 2009. The largest confectionery firm is Mars-Wrigley with a market share of 14.8% and the second largest is Cadbury with a market share of 10.3%. After Cadbury’s acquisition, Kraft Foods will dispute the leadership position with Mars-Wrigley.
0,0% 5,0% 10,0% 15,0% 20,0% Mars Cadbury Nestlé Hershey Kraft Foods Source: Bloomberg
Figure 6 - Kraft Foods and Cadbury's Market Share 2001-2008
Figure 7 - Market Share 2009
9.6. Confectionery Market Share by Consumer Segment
Cadbury is the fourth largest chocolate confectionery firm in the world with a market share of 7.5%. Kraft Foods appears in third place with a market share of 8.3%, in 2008. (Appendix 1)
In Gum confectionery, Cadbury appears as the second largest firm with a market share of 28.9%. Mars-Wrigley is leading this segment with a market share of 34.9%. In Candy confectionery, Cadbury is leading the market with a market share of 7.2%. Mars-Wrigley appears in third with a market share of 4.9%. (Appendix 2; Appendix 3; Appendix 4)
Confectionery market is quite fragmented where the top 5 confectionery firms have 42% of total market share.
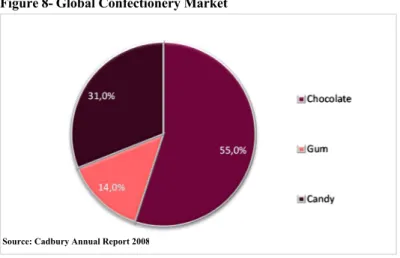
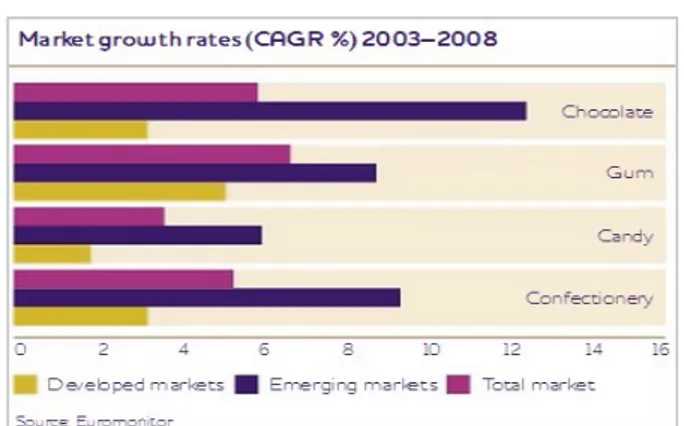
As it is possible to observe (Figure 8 and 9), chocolate represents the biggest segment with 55% share in retail sales and has been growing at 6% CAGR (2003-2008) whereas the top 5 firms account with 50% of global confectionery sales, followed by Candy which is considered the most fragmented segment with 31% of total confectionery sales and growing at a CAGR (2003-2008) of 4%. The top 5 players only account with 25% of global confectionery sales in candy. Gum is the faster and most consolidated segment growing at 7% CAGR (2003-2008), accounting for 14% of total market share, where the two stronger players (Cadbury and Wringley) account with 60% of the global market. In emerging markets the growth rates are higher with chocolate growing at a CAGR (2003-2008) of more than 12%, gum at 9% and candy at 6%. The overall confectionery market is increasing at 5%.
Source: Cadbury Annual Report 2008
9.7. Food & Beverage Industry Costs
The main costs that affect this industry are related to energy (natural gas), raw materials (commodities price), manufacturing costs (especially labor), transportation (oil prices) and a complex and growing customer demand based on brand loyalty and quality product expectations that need constant improvement in the value chain, especially in innovation, marketing and distribution channels.
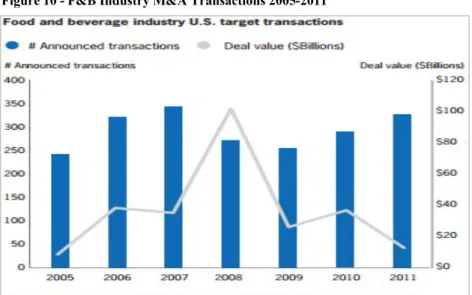
9.8. Food & Beverage Industry M&A Activity
In 2009, M&A activity in Food & Beverage industry suffered a decline due to the economy downturn. Comparing with the previous year, the industry saw a decrease in 73.1% in transaction value and also a 37% decline in the number of transactions28. In 2011 was registered
a weight improve of 13% in the number of transactions comparing with 2010; however the aggregate value appears to decline. In the U.S. it is possible to analyse that scenario, as the country where most deals were made each year; it is possible to observe a retraction not only in the number of transactions occurred, but also in the value of those transactions since 2005. In the period of 2008-2009 it is noticeable the decline in the value of transactions, as well as in the number of transactions. By 2010 and 2011, the number of transactions increased, however the value stayed as low as in 2007. The period of 2008-2011 was less competitive in terms of acquisitions, due to the lack of liquidity in the economy, where only private equity groups with strong balance sheets and financial slack had the opportunity to take advantage of undervalued firms to strengthen their competitive positions, as well as improving their value chain with vertical acquisitions.
28IMAP –Food and Beverage Industry Global Report - 2010
10. About Kraft Foods, Inc
10.1.
General
Kraft Foods is an American public firm, listed on NASDQ (NASDAQ: KTF), operating on the Food & Beverage Industry. In 2009, Kraft Foods was the world’s second largest food products manufacturer and packager firm with operations in more than 70 countries, 97.000 employees worldwide and selling for almost 160 countries. Its products are dispersed into five consumer sectors:
Snacks: primarily biscuits, salted snacks and chocolate confectionery; Beverages: primarily coffee, packaged juice drinks and powdered beverages; Cheese: primarily natural, processed and cream cheese;
Grocery: primarily spoonable and pourable dressings, condiments and desserts;
Convenient Meals: primarily processed meals, frozen pizza, packaged dinners and lunch combinations.
Kraft Foods is geographically segmented in North America, Canada, Europe and Developing Countries, such as Brazil, Russia, China and other regions of Southeast Asia. Kraft Foods started focusing on emerging markets as a strategy to grow its operations, market share and profitability, since emerging markets face growing population and rising income levels followed by a shift in demand for more expensive products.
In 2009, Kraft Foods presented Net Revenues of $ 40.39 billion, 3.6% less than the previous year, an Operating Income of $5.52 billion, 43.7% more than in 2008 and Net Earnings of $3.03 billion, 4.7% more compared with the previous year.
10.2.
History
Although Kraft Foods, Inc was rebranded in 1995, its foundations go back more than a century of history. Kraft Food, Inc was born from the merger of three completely different firms: Kraft, General Foods and Oscar Mayer. Kraft started in 1903 and was in the cheese business. General Foods, started in 1895 under the name of PostCereal Company in the cereals business, responsible for one of the first ready-to-eat cold cereals, as well as corn flakes products. In 1981, with the intention of entering in a new completely different product category General Foods acquired Oscar Mayer & Co, founded in 1883 and a leader in the processed meats. Later, General Foods were acquired by Philip Morris Company, Inc that previously had acquired Kraft, Inc as a subsidiary too. In 1989, the two subsidiaries, General Foods and Kraft, were combined and formed a wholly owned subsidiary Kraft General Foods and, in 1995, was rebranded to Kraft Foods, Inc. In 2001, Philip Morris Company, Inc did a initial public offer to Kraft Foods, Inc. In 2007, Altria Group, Inc (new Philip Morris Company, Inc name) completed the separation by spinning off its remaining interest in Kraft Foods, Inc..
Due to Cadbury’s integration Kraft Foods suffered a transformation in terms of geographic market coverage, so in October of 2012, Kraft Foods Inc was split into Kraft Foods Group, responsible for North America Grocery Business, and Mondelez International, Inc, responsible for global business in emerging markets.
10.3.
Performance
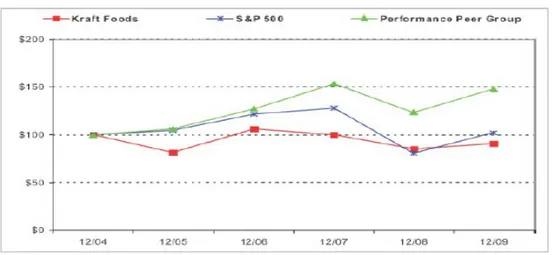
This performance comparison of 5 years shows that Kraft Foods seems to be underperforming comparing with S&P 500 and a peer group. The peer group has a great performance beating the market after 2004. The peer group is composed by Cadbury plc, Campbell Soup Company, The Clorox Company, The Coca-Cola Company, Colgate-Palmolive Company, ConAgra Foods, Diageo plc, General Mills, Inc, Danone, H.J. Heinz Company, Hershey Foods Corporation, Kellogg Company, Nestlé S.A., PepsiCo Inc, The Procter & Gamble Company, Sara Lee Corporation and Unilever N.V. and reflects all Kraft Foods consumer sectors.
10.4.
Net Revenues
With a market share of 2.5% of total revenues in Food & Beverage Industry, in 2009, Kraft Foods had net revenues of $40. 38 billion, less 3.7% compared with the $ 41.93 billion had in 2008, and a CAGR (2005-2009) of 5.28 %. The decrease in net revenues is explained by volume decline in almost every segment, expect U.S. Beverage and U.S. Convenient Meals, influence by the discontinuation of less profitable product line, as a strategy of walking away from unprofitable volumes. Unfavorable foreign currency also decreases net revenues by $1.897 million, due to the strength of the U.S. dollar against foreign currencies29. The decline is
also explained by the weakening consumption trends, mainly in developed countries.
29Euro, Russian Ruble, Canadian dollar, Ukrainian hryvnia, British pound, Brazilian and Polish zloty.
Figure 11 - Kraft Foods Performance 2004-2009
Figure 12 - Kraft Foods Net Revenues
10.5.
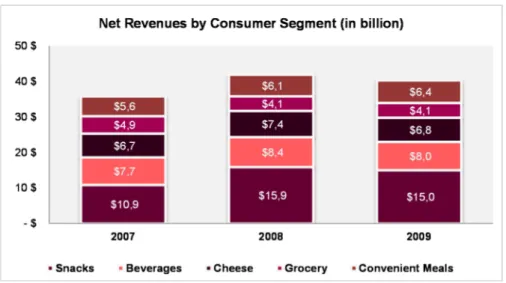
Net Revenues by Consumer Segment
In consumer segment Snacks is the largest segment in 2007-2009 period. In 2009, Snacks weighted about 37% of total net revenues, followed by beverages with 20%. The smaller segment in the period is Grocery weighting 10% of total net revenue.
Excepting Grocery, from 2007 to 2008, all sectors have grown, especially Snacks with a growth rate of 44.5%, followed by Cheese with 11.3%. Grocery decreased by 16.1% in the same period. From 2008-2009, excepting Convenience Meals, every sector had decreased, such as Cheese by 8.6% and Snacks by 5%. Convenient Meals increased by 5.6%. The CAGR (2007-2009) for all sectors are 11.2%, 1.2%, 0.6%, -6.2% and 5.2%, respectively.
10.6.
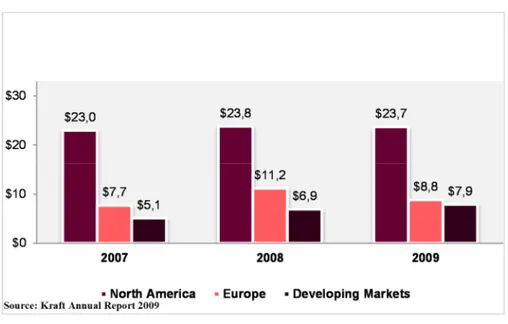
Net Revenues by Geographic Segment
North America is the largest market of Kraft Foods, responsible for 58.6% of total net revenues, in 2009, followed by Europe (21.7%) and Emerging Markets (19.7%). Despite the fact that U.S. market is the most important one is, at the same time, the one with smaller growth. CAGR (2007-2009) are 1.4%, 6.9% and 24.1%, respectively. It is possible to analyse the importance of U.S. as a stable and mature market; however developing markets are the key factor to net revenues’ increment.
Source: Kraft Annual Report 2009
10.7.
Net Revenues by Consumer & Geographic Segment
In North America the largest consumer segment are Snacks, Cheese and Conveninet Meals. In Europe and Developing Markets consumer segments in total net revenues are very similar. It is notable that the largest consumer segments are Snacks, Beverages and Cheese where Convenient Meals appears as the smaller consumer segment.
Source: Kraft Annual Report Source: Kraft Annual Report 2009
Figure 14 - Net Revenues by Geographic Segment