CHARACTERIZATION OF PHENOLIC ACID
REDUCTASE AND DECARBOXYLASE ACTIVITIES OF
LACTIC ACID BACTERIA
Master thesis presented to Escola Superior de Biotecnologia of the Universidade Católica Portuguesa as part of the European Master Degree in Food Science,
Technology and Nutrition.
By Ana de Seabra Leão Ferreira Soares
Under the supervision of Francisco Campos and José António Couto
2 Table of contents I. Abstract ____________________________________________________________4 II. Acknowledgments ____________________________________________________5 III. Abbreviations________________________________________________________6 1. Introduction _________________________________________________________8
1.1. Wine Aroma and Phenolic Compounds ___________________________________8 1.2. Volatile phenols______________________________________________________9 1.3. Lactic Acid Bacteria and Malolactic Fermentation__________________________11 1.4. Biochemical Pathways of volatile phenols production_______________________13 1.5. Factors influencing volatile phenols production by LAB_____________________15 1.5.1. Influence of hydroxycinnamic acids, pH, L-malic acid and oxygen________15 1.5.2. Effect of glucose and fructose on the production of volatile phenols_______16 2. Material and methods ________________________________________________17
2.1.Bacterial strains and growth conditions __________________________________17 2.2.Inoculation of media_________________________________________________20 2.3.Volatile fraction extraction ____________________________________________20 2.4.Gas-liquid chromatography analysis _____________________________________21 2.5.High-Performance Liquid Chromatography analysis ________________________23 3. Results_____________________________________________________________26 3.1.Volatile phenols production____________________________________________26 3.1.1. VP production from different concentrations of p-coumaric acid__________26 3.1.2. VP production from p-coumaric acid with addition of L-malic acid to the
medium_______________________________________________________29 3.1.3. VP production from p-coumaric acid with addition of fructose to the medium_______________________________________________________30 3.2.Non-volatile phenolic compounds production______________________________31 3.2.1. Non-volatile Phenolic compounds production from different concentrations of p-coumaric acid ________________________________________________33 3.2.2. Non-volatile Phenolic compounds production from p-coumaric acid with addition of L-malic acid to the medium______________________________33 3.2.3. Non-volatile Phenolic compounds production from p-coumaric acid with addition of fructose to the medium _________________________________34
3
4. Discussion __________________________________________________________35 4.1.Influence of p-coumaric acid concentration in the production of VP and Non-volatile phenolic compounds _________________________________________________35 4.2.Influence of L-malic acid in the production of VP and Non-volatile phenolic
compounds_________________________________________________________37 4.3.Influence of fructose in the production of VP and Non-volatile phenolic compounds_________________________________________________________39 5. Conclusion__________________________________________________________40
4
Abstract
Hydroxycinnamic acids are natural constituents of grape juice and wine, and are precursors of volatile phenols produced by yeasts and lactic acid bacteria (LAB). The organoleptic defects due to the presence of this volatile phenols are usually associated with “animal”, “horsey”, “leather”, “phenolic” or “spicy” aromatic notes. The most common pathway for the degradation of hydroxycinnamic acids involves two enzymes. In first place, it occurs a decarboxylation by the phenolic acid decarboxylase (PAD), and secondly a reduction of the intermediate metabolite carried out by the vinylphenol reductase (VPR). Some LAB strains seem to be able to metabolise hydroxycinnamic acids through an alternative route, involving a reduction step by a phenolic acid reductase (PAR) followed by a decarboxylation reaction.
In order to characterize PAR and PAD/VPR activities, six different LAB strains were tested for the production of volatile phenols and non-volatile metabolites. The main objective of this work was to study the influence of certain factors/growth conditions on the extent of these activities. In the first part of this study, we evaluated the influence of the concentration of p-coumaric acid (1.0, 5.0 and 50 mg/L) as precursor for the production of volatile phenols. In the second part, the effect of the presence of L-malic acid and fructose on PAR and PAD/VPR activities with regard to the metabolism of p-coumaric acid was studied.
The results show that all of the LAB strains tested have the ability to produce volatile phenols, however, strain-dependent patterns were observed. Four of the strains were also found to produce phloretic acid from 50 mg/l of p-coumaric acid using the alternative metabolic route mentioned above, thus indicating PAR activity. L-malic acid and fructose seemed to stimulate VPR activity, while no alteration was observed on the PAR activity. Moreover, the initial concentration of p-coumaric acid used seems to play an important role on volatile phenols production.
5
Acknowledgments
I would like to express my gratitude to my supervisors Francisco Campos and José António Couto for the useful comments, remarks and patience through the learning process of this master thesis. Furthermore I would also like to acknowledge with much appreciation Escola Superior de Biotecnologia, who gave the permission to use all required equipment and the necessary materials to complete the task.
I would like to thank all of my professors from SEFOTECH and all my colleagues. A special thanks you to all my friends for just being there.
Finally, I would like to dedicate this project to my parents, for their support and patience.
6 Abbreviations 4-EC 4-ethylcathecol 4-EG 4-ethylguaiacol 4-EP 4-ethylphenol 4-VC 4-vinylcatechol 4-VG 4-vinylguaiacol 4-VP 4-vinylphenol
ADP Adenosine diphosphate
ATP Adenosine triphosphate
ESB Escola Superior de Biotecnologia
FID Flame Ionisation Detector
GC Gas-Liquid Chromatography
HPD Hydroxyphenylpropionic Decarboxylase HPLC High Performance Liquid Chromatography
L. Lactobacillus
LAB Lactic Acid Bacteria
LB Bacteriocin producer strain MLF Malolactic Fermentation
MRS de Man, Rogosa and Sharpe
NAD Nicotinamide Adenine Dinucleotide
NCFB National Collection of Food Bacteria, Reading, UK
O. Oenococcus
P. Pediococcus
PA Phloretic acid
PAD Phenolic Acid Decarboxylase
7
UCP Universidade Católica Portuguesa
v/v Volume by volume
VP Volatile Phenols
8
1. Introduction
Grapes are one of the most antique crops in history. Indeed, wine and man have a long history together, and Palaeolithic man was probably the first to become familiar with wine (Hornsey, 2007). Since Louis Pasteur clearly demonstrated that the alcoholic fermentation required the presence of yeast, unprecedented improvements in the winemaking processes have gone hand in hand with the development of modern microbiology
1.1.Wine Aroma and Phenolic Compounds
Several chemical compounds - mainly aldehydes, esters, alcohols, acids and phenolic compounds - have been described as normal components of wine aroma. Some of these compounds have a relatively low boiling point and are detectable by the human nose when present above the olfactory threshold. Some of them contribute positively to the wine aroma, although depending on the concentration levels, but others are responsible for off-flavours, decreasing the quality of the wine.
The composition of the volatile fraction is influenced by many factors, including grape must composition, pH, prevailing temperature of fermentation, which can affect the biosynthetic pathways in wine by yeast and bacteria (Swiegers et al., 2005). In addition, viticulture factors, such as the quality of the grapes and soil, water management, climate, technological aspects, vinification methods (grape de-stemming, crushing and pressing technology, must treatment and skin contact time) and the ageing conditions (oak-ageing, bottle ageing), affect the amount and type of volatiles in wine (Gómez-Míguez et al., 2007; Ivanova et al., 2011; Ginjom et al., 2011)
. The major phenolics found in wine are either members of the diphenylpropanoids (flavonoids) or phenyl-propanoids (nonflavonoids) (Jackson, 2008). They play an important role in the visual and gustative quality of wines, in particular, anthocyanins that are responsible for the colour of red wines, and tannins which confer the astringency and structure to the wine (Ivanova et al., 2011). Non-flavonoids, especially resveratrol, are thought to have anti-carcinogenic effects due to their antioxidant properties, limiting the action of free radicals in the body. Epidemiological studies have suggested that a moderate consumption of alcoholic beverages, particularly
9
red wine, is associated with a reduction in overall mortality, attributed mostly to a reduced risk of coronary heart disease (Bakker and Clarke, 2012). These phenolic compounds are abundant in grape material (skins, seeds and stalks) as well as in wood used for storage (Campos et al., 2003), therefore, the wine-making procedures determine the transference of these compounds to musts and wines.
1.2.Volatile phenols
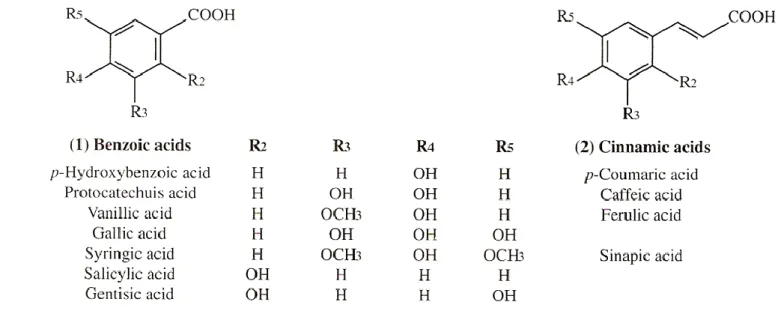
The phenolic composition of wines include phenolic acids, such as hydroxycinnamic (p-coumaric, caffeic and ferulic) acids and hydroxybenzoic (gallic, protocatechuic, vanillic and syringic) acids, ranging from 100 to 200 mg/L in red wine and 10-20 mg/L in white wine (Ribéreau-Gayon et al., 2006b).
Figure 1. Phenolic acids in grapes and wine (Ribéreau-Gayon et al., 2006b)
These phenolic acids are natural constituents of grape juice and wine, being differentiated by substitution of their benzene ring (Figure 1). They are mainly esterified, in particular with tartaric acid, however, the free form can be released by cinnamoyl-esterase activities. This enzyme is present in wine due to enzyme preparations added, and also due to lactic acid bacteria (LAB), that can exhibit cinnamoyl-esterase activities during malolactic fermentation. Although these phenolic
10
acids have no flavour or odour, they are precursors of volatile phenols produced by yeasts and lactic acid bacteria (Buron et al., 2011).
Volatile phenols are found in many fermented beverages, such as beers (Lyumugabe et al., 2013) and cider (Buron et al., 2012), and have characteristic aromas which, above a certain concentration threshold, have a negative effect on the overall aroma of a wine (Silva et al., 2011b). The most important molecules in this class are 4-vinylphenol (4-VP), 4-vinylguaiacol (4-VG), 4-ethylphenol (4-EP) and 4-ethylguaiacol (4-EG). The organoleptic defects due to their presence are usually associated with “animal”, “horsey”, “leather”, “phenolic” or “spicy” aromatic notes, which also leads to a loss of freshness and fruitiness character (Couto et al., 2006; Tamasi et al., 2013) (Figure 2). The sensory threshold in wines for 4-EP is low, about 230 µg/L (Suarez et al., 2007), but low concentrations (420 μg/L of a mixture of 4-EP and 4-EG) have been cited as contributing positively to aroma complexity (Fugelsang and Edwards, 2007; Ribéreu-Gayon et al., 2000a).
Ethylphenols are present in largest quantities in red wines, whereas vinylphenols are more common in white wines (Torrens et al., 2004). Concentrations of more than 770 μg/L of a mixture of 4-VG/4-VP (1:1) in white wines can be responsible for heavy "pharmaceutical" odours reminiscent of sticking plaster (Chatonnet et al., 1995).
Volatile phenols
Compound Concentration in
wine (mg/L) Aroma 4-Vinylphenol 0-1.15 Medicinal 4-Vinylguaiacol 0-0.496 Smoky, vanilla 4-Ethylphenol 0-6.047 Horse sweat 4-Ethylguaiacol 0-1.561 Smoky, vanilla
Figure 2. Principal volatile phenols in wine; Adapted from Carrascosa et al., 2011.
The formation of volatile phenols in wine is known to depend on the presence of precursors (hydroxycinnamic acids) and is proportional to the size of the
11
Brettanomyces/Dekkera population (Suarez et al., 2007), which are capable of forming significant quantities of ethylphenols.
Although the yeasts Dekkera/Brettanomyces are recognized as the main organisms responsible for the production of volatile phenols (Suarez et al., 2007), previous works have shown that some strains of LAB are also capable of producing volatile phenols in growth media, but at lower concentrations (Couto et al., 2006; Chatonnet et al., 1995; Cavin et al., 1997). In 1997, Chatonnet et al. (1997) showed that strains of Lactobacillus and Pediococus were capable of producing quantities of 4-VP similar to those formed by Saccharomyces cerevisiae. However, measurable quantities of 4-EP were always relatively low and, in all cases, much lower than those produced by Dekkera/Brettanomyces.
1.3.Lactic Acid Bacteria and Malolactic Fermentation
LAB are naturally present in wine as well as in winery equipment that is not well sanitized. A general description of them would be that they are Gram positive, non-spore forming, non-respiring cocci or rods, which produce lactic acid as the major end-product during the fermentation of carbohydrates (Hornsey, 2007). They are doubly important, whereas growth of some bacteria in certain wines is desirable (i.e., malolactic fermentation), while the growth of other species can lead to spoilage (Fugelsang, K.C. and Edwards, 2007).
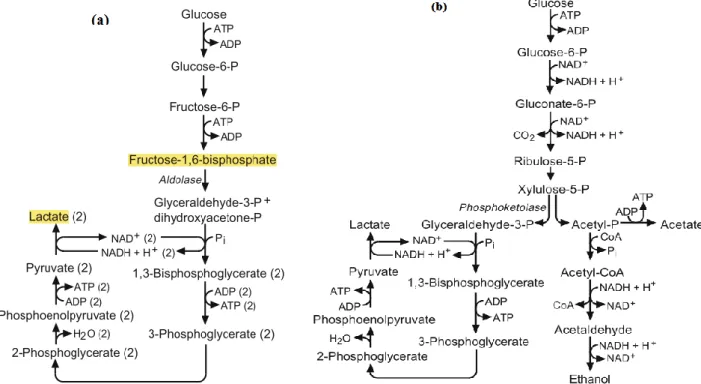
Lactic acid is the primary metabolite of sugar metabolism that can be carried out by homo or heterofermentative pathways (Figure 3). Homofermentative bacteria transform nearly all of the hexoses that they use, especially glucose, into lactic acid; the oxidation reaction takes place generating the reduced coenzyme NADH and H+, which is at the end oxidized into NAD+ during the reduction of pyruvate into lactate. Bacteria using the heterofermentative pathway transform hexoses principally but not exclusively into lactate. The other molecules produced by this metabolism are essentially CO2,
acetate and ethanol (Ribéreau-Gayon et al., 2006). The study of the homofermentative and heterofermentative metabolic pathways of sugars therefore permits the prediction of the nature of the products formed.
12
Yeasts are better adapted than LAB to growth in grape musts, which contain very high sugar concentrations (210 g/L) and have a low pH, about 3.0–3.8 (Lonvaud-funel, 1999). Therefore, alcoholic fermentation starts very quickly, and when all reducing sugars are fermented to ethanol, yeast levels decline and LAB growth occurs, due to their adaptation to the wine environment, namely low pH, high ethanol and low concentrations of nutrients (Campos et al., 2003).
Figure 3. Homofermentative (a) and heterofermentative (b) pathways of sugar metabolism
(Fugelsang and Edwards, 2007)
The most important bacterial genera in winemaking are Pediococcus, Lactobacillus, Leuconostoc and Oenococcus. Lactobacillus, mainly Lactobacillus hilgardii, use the residual sugar of the wine in slow alcoholic fermentations generating an increase of the volatile acidity (D-lactic acid and acetic acid) which results in a modification of the sensorial properties of the wine (Chatonnet et al., 1997; Lonvaud-Funel, 1999). Pediococcus are known to cause ropiness in wine by the production of polysaccharides (König, Unden and Fröhlich, 2009), whereas Oenococus is the species of choice to carry out the malolactic fermentation.
Malolactic fermentation (MLF) follows the alcoholic fermentation, and although the main reason it´s carried out is because it leads to a reduction of wine acidity, due to the conversions of L-malic acid (dicarboxylic acid) into L-lactic acid (monocarboxylic
13
acid), many winemakers are increasingly viewing it as a means of adjusting wine flavour. Although more commonly promoted in red wines, it is now being applied to white wines (Jackson, 2008).
MLF may occur spontaneously, but also can be induced by inoculating wine with malolactic starter cultures, which are preparations usually containing cultures of one strain, used to inoculate a substrate in order to initiate fermentation (Comitini, et al., 2005; Carrascosa et al., 2011). The induction of MLF by inoculation offers some advantages, including greater control over the timing and length of this fermentation and also over the strain of lactic acid bacteria that carries out the process. The longer it takes for it to start, the higher the risk for the growth of Dekkera/Brettanomyces, which compromises the quality of the wine due to the formation of various spoilage compounds, especially volatile phenols. The selection of the starter culture is based on some specific criteria, such as resistance to low pH, resistance to ethanol, tolerance of low temperatures, and reduced metabolism of hexose/pentose sugars (Carrascosa et al., 2011).
1.4.Biochemical Pathways of volatile phenols production
The precursors of volatile phenol biosynthesis are hydroxycinnamic (caffeic, p-coumaric and ferulic) acids (Figure 4), that are generally esterified with tartaric acid in grape must and wine, and can be released as free acids during wine making by some cinnamoyl-esterase activities (Buron et al., 2012; Cavin et al., 1997).
After this first step, there are two possible metabolic pathways for the conversion of hydroxycinnamic acids into volatile phenols. Most often, they are first decarboxylated into 4-vinyl derivatives and then reduced to 4-ethyl derivatives, involving the sequential activity of two enzymes: the first is the cinnamate decarboxylase or phenolic acid descarboxylase (PAD) which decarboxylates the hydroxycinnamic acid into the corresponding vinylphenol; the second enzyme involved is the vinylphenol reductase (VPR) which reduces the vinylphenol into the corresponding ethylphenol (Ribéreu-Gayon et al., 2000). Some LAB like L. plantarum, L. brevis and P. pentosaceus are able to synthesize PAD, thus being able to decarboxylate the hydroxycinnamic acid, while others don´t possess the gene encoding
14
a PAD, namely O. oeni and L. hilgardii (de la Rivas et al., 2009). Given this, Dekkera/Brettanomyces could theoretically reduce vinyl phenols synthesized by other wine microorganisms and thereby benefit from the growth of other microorganisms (e.g., LAB). The reduction step seems to be mediated by the intracellular NAD+/ NADH balance (Silva et al., 2011a).
A second pathway, first described by Whiting et al. (1959) for Lactobacillus pastorianus, consists of a two-step reaction. First, a reduction step takes place carried out by a phenolic acid reductase (PAR), followed by a decarboxylation reaction through a putative hydroxyphenylpropionic decarboxylase (HPD) (Figure 4). Barthelmebs et al. (2000) showed that knocking out the p-coumaric acid decarboxylase gene, the bacteria was still able to weakly metabolize p-coumaric and ferulic acids into vinyl derivatives or into substituted phenyl propionic acids (e.g. phloretic acid), showing that both routes, can co-exist and compete for the hydroxycinnamic acid degradation. In sum, the main difference between the two routes is the intermediary compound, either vinylphenols or phloretic acid.
Figure 4. Biosynthetic pathways of volatile phenols from hydroxycinnamic esters.
PAD, phenolic acid decarboxylase; VPR, vinylphenol reductase; PAR, phenolic acid reductase; HPD, putative hydroxyphenylpropionic decarboxylase (Buron et al., 2012)
15
1.5. Factors influencing volatile phenols production by LAB
The contaminant yeasts Dekkera/Brettanomyces are recognized as the main organisms responsible for the production of volatile phenols, although previous works have shown that some strains of LAB are also capable of producing volatile phenols. Couto et al. (2006) showed that thirteen LAB strains (37%) produced volatile phenols from p-coumaric acid, although only three (9%) produced 4-EP. The reduction step was only found in the Lactobacillus genus: L. brevis, L. collinoides, and L. plantarum.
1.5.1. Influence of hydroxycinnamic acids, pH, L-malic acid and oxygen
Hydroxycinnamic acids, especially p-coumaric, were proven to be inhibitory for the growth of O. oeni and Lactobacillus hilgardii, inhibiting cell growth (Campos et al., 2003; Campos et al., 2009), but the tested strains didn´t have the ability to produce volatile phenols (Couto et al., 2006).
Regarding the bacterial strains that are capable of producing volatile phenols, Silva et al. (2011b) evaluated the effect of wine phenolic compounds on the production of volatile phenols by LAB, where the results suggest that caffeic and ferulic acids induce the synthesis of the PAD involved in the metabolism of p-coumaric acid, supporting the hypothesis of enzyme induction by molecules structurally similar to the substrate. The main difference between the hydroxycinnamic acids studied is the ring C3
substitution, which is -H for p-coumaric acid, -OH for caffeic acid and -OCH3 for
ferulic acid (Figure 1). Also, Couto et al. (2006) studied the influence of hydroxycinnamic acids concentration. The higher the p-coumaric acid content in the culture medium, the more volatile phenols were produced, both for vynilphenol and 4-ethylphenol, except for Lactobacillus plantarum where it appeared that the production of 4-ethylphenol, in relation to 4-vinylphenol, was favoured at low concentrations of p-coumaric acid.
Other factors affect the production of volatile phenols by LAB, namely the presence of L-malic acid, which can stimulate the production of volatile phenols (Silva et al., 2011a). During malolactic fermentation, LAB converts a dicarboxylic acid (L-malic acid) into a monocarboxylic acid (L-lactic acid) increasing pH (Carrascosa et al., 2011), factor which Silva et al. (2011a) showed to influence volatile phenols
16
production, increasing its yield. This study also showed that L-malic acid stimulates the production of 4-EP while diminish the amount of 4-VP released to the culture medium by L. collinoides and L. plantarum. A possible explanation for this behaviour is that the the enzyme involved in the malolactic fermentation by LAB, requires the presence of NAD+ cofactor for the decarboxylation of L-malic acid into L-lactic acid and CO2
(Jackson et al., 2008), which is generated when reducing 4-VP to 4-EP. This may also explain why in anaerobiosis, the production of 4-EP is also favoured (Silva et al., 2011a). Under low oxygen concentrations the availability of NAD+ can be limited, thus the reduction of 4-VP into 4-EP would allow the cells to regenarate NAD+.
1.5.2. Effect of glucose and fructose on the production of volatile phenols
Fermentation can result in the generation of excess oxidised NAD+ (NADH). To maintain an acceptable redox balance, the bacteria must regenerate NAD+. (Jackson et al., 2008). Silva et al. (2011a) investigated the influence of glucose and fructose concentration in some homo and/or heterofermentative LAB strains. At high concentrations of glucose (20 g/L) production of 4-VP by homofermentative or facultatively hetrerofermentative seemed to be favoured, although it was strain dependent, since Pediococcus pentosaceus (homofermentative) was not affected. This influence on the production of 4-VP may be because at relatively high levels of glucose, part of the carbohydrate might be diverted to the production of mannitol in homofermentative strains. Mannitol biosynthesis in homofermentative lactic acid bacteria starts with the glycolysis intermediate fructose 6-phosphate, which is an alternative pathway, instead of lactate formation, to regenerate NAD+, so the reduction step of p-coumaric acid metabolism would not be necessary under these circumstances. Since in homofermentative lactic acid bacteria the carbon flow from carbohydrates is directed mainly to lactate production, the formation of other fermentation products like mannitol is often only possible when strains are more or less hampered in the lactate production pathway, thus homofermentative LAB are found to produce small amounts of mannitol (Wisselink et al. 2002).A similar process occurs with the addition of fructose and the subsequent production of mannitol (via reduction of fructose).
17
In the case of heterolactic bacteria, they are unable to synthesize mannitol from glucose, therefore this via cannot be used as an alternative pathway to regenerate NAD+, thus reducing 4-VP to 4-EP for regeneration of NAD+. (Wisselink et al., 2002)
The main objective of this work was to investigate the influence of certain factors/growth conditions on the bacteria metabolic pathway by studying PAR and/or PAD / VPR activities. To this end, LAB strains from previous works were selected, regarding their ability to produce volatile phenols as well as phloretic acid.
18
2. Material and Methods
2.1. Bacterial strains and growth conditions
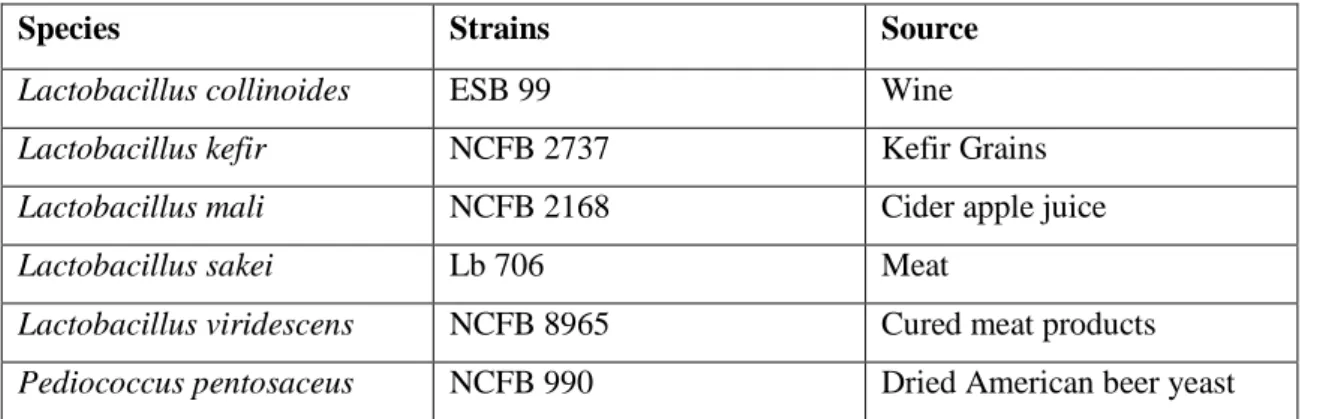
The selection of the lactic acid bacterial strains was based on previous experiments (Couto et al., 2006), regarding their capacity to produce volatile phenols as well as phloretic acid. The bacteria used in this study (Table 1) belong to the culture collection of Escola Superior de Biotecnologia da Universidade Católica Portuguesa (ESB).
Table1. List of species and strains surveyed
Species Strains Source
Lactobacillus collinoides ESB 99 Wine
Lactobacillus kefir NCFB 2737 Kefir Grains
Lactobacillus mali NCFB 2168 Cider apple juice
Lactobacillus sakei Lb 706 Meat
Lactobacillus viridescens NCFB 8965 Cured meat products
Pediococcus pentosaceus NCFB 990 Dried American beer yeast
ESB: Escola Superior de Biotecnologia, Porto, Portugal Lb: Bacteriocin producer strain
NCFB: National Collection of Food Bacteria, Reading, UK
This work was divided in two parts, where in the first different amounts of p-coumaric acid were added to the medium (table 2).
Table 2. Part I; Addition of different initial concentrations of substrate (p-coumaric acid) Part I
Parameter Strains
Initial concentration of p-coumaric acid
1.0 mg/L
L. collinoides; L. kefir; L. mali; L. sakei; L. viridiscens; P. pentosaceus
5.0 mg/L
19
In the second part of the work, three strains were selected, regarding their type of hexose metabolism. L. collinoides is strictly heterofermentative, L. sakei is facultatively heterofermentative and P. pentosaceus is strictly homofermentative. L-malic acid or fructose was added to the medium at concentrations of 4.0 and 3.0 g/L, respectively.
Table 3. Part II; Addition of L-malic acid or fructose do the growth medium. Part II
Parameter Strains
Addition of L-malic
acid (4.0 g/L) Note: Initial
Concentration of p-coumaric acid: 5 mg/L
L. collinoides; L sakei; P. pentosaceus
Addition of frutose (3.0g/L)
Bacterial growth was carried out in MRS (de Man, Rogosa &Sharpe) medium from Biokar Diagnostics (Beauvais, France), either liquid or solid. The latter was prepared by adding 20 g/L of agar (Laboratorios Conda, Madrid, Spain) to the liquid medium. The pH was adjusted to 4.5 in the liquid medium and 5.0 in the solid medium, using a hydrochloric acid 6.0 M solution. Afterwards, they were sterilized in Schott glass bottles (one cycle at 121 ºC during 15 minutes) as well as all the material used, including glass pipettes and micropipette tips. Finally, sterilized medium were transferred to plastic tubes under aseptic conditions.
Pre-cultures were obtained from stock cultures stored at -80ºC in MRS with 20% glycerol which were transferred to sterile liquid MRS broth and grown to late exponential phase for 2-3 days at 25 Cº, without agitation.
The purity of the cultures was checked by the observation of liquid cultures under the microscope and by inoculating in solid medium. Cultures were stored in MRS Agar slopes at 4°C. For each experiment, fresh cultures where prepared from these stock cultures, and grown in MRS broth in plastic tubes for 24-48h at 25ºC.
20
2.2. Inoculation of media
All samples were prepared in duplicate, under aseptic conditions.
With the intent to evaluate the production of volatile phenols and phloretic acid at different concentrations of p-coumaric acid, an experiment was conducted during the first part of this work, supplementing MRS broth with 1.0 mg/L, 5.0 mg/L and 50 mg/L of p-coumaric acid (trans-4-hydroxycinnamic acid, 98% purity), obtained from Sigma Aldrich (Stenheim, Germany).
The second part of this work consisted in separately evaluate the effects of malic acid and fructose in the production of volatile phenols and phloretic acid. L-malic acid (Sigma Aldrich Chemie GmbH, Steinheim, Germany) was added, at a concentration of 4.0 g/L, and fructose (Sigma Aldrich Chemie GmbH, Steinheim, Germany) was added at 3.0 g/L to liquid MRS medium, subsequently sterilized. In both experiments p-coumaric acid was added, at a concentration of 5.0 mg/L.
The different amounts of p-coumaric acid were weighted and dissolved in 10.0 ml of a deionised water/ethanol solutions (1:1, v/v), which were then filtered with a cellulose acetate syringe filter with 0.45 μm pore size (VWR International, USA). Afterwards, 250 μl of these solutions were added to Schott bottles (Schott AG, Mainz, Germany) containing 50 ml of MRS liquid medium, and finally, 500 μl of bacterial culture were inoculated, using fresh cultures.
All samples were incubated for 7 days, at 25 ºC without agitation. After 7 days in the incubator, the culture media was centrifuged at 3000 x g for 10 minutes to remove the supernatant for later analysis.
2.3.Volatile fraction extraction
The following procedure was executed for each sample of each experience. The supernatant was analyzed by a modified version of the method developed originally by Bertrand (1981) for analysis of volatile phenols, described as follows.
21
Samples were diluted (1:1, v/v) by mixing 25.00 ml of culture media, obtained from the centrifugation, with 25.00 ml of deionised water in a 100.0 ml volumetric flask, followed by a liquid-liquid extraction to analyze the volatile phenols.
The first step consisted in the addition of 50.0 μL of 3-octanol (447 mg/L in methanol) as internal standard. Three consecutive extractions were performed by stirring the solution for 5 minutes with 4.0 ml, 2.0 ml and 2.0 ml, respectively, with a solvent solution of diethyl-ether/hexane (1:1, v/v) (both reagents were obtained from Merck, Darmstadt, Germany). After mixing for 5 minutes, the solution was transferred to a separatory funnel where the organic phase was separated from the inorganic phase and collected to a headspace flask while the inorganic phase was recovered to repeat the extraction.
The organic phase from the consecutive extractions (transparent layer) was collected with a Pasteur pipette to a 1.50 ml vial and concentrated under a stream of nitrogen to approximately 0.50 ml for further analysis in the gas chromatograph (GC-FID)
2.4. Gas-liquid chromatography analysis
The analyses were performed with a Hewlett-Packard 5890A gas chromatograph equipped with a flame ionization detector (FID). One microlitrer (1.0 μL) of sample was injected from the vials. Compounds were separated on a FFAP-type (BP 1,50 m x 0,22 mm x 0.25 μm) obtained from SGE (Austin, TX, USA). The injector (split/splitless) was heated to 220 ºC with a split flow of 30 ml/min and a splitless time of 0.3 min. Hydrogen was used as carrier gas. The temperature program was as follows: 40 ºC for 5 minutes after injection and then increased at a rate of 2 °C/min up to 220 °C. This temperature was maintained for 30 min.
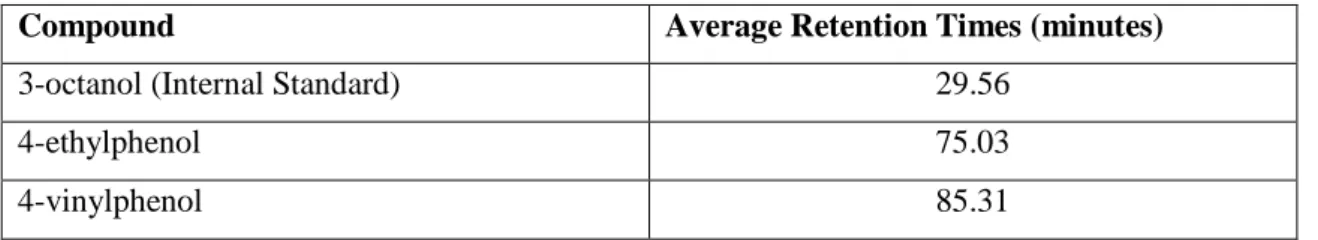
In order to obtain a calibration curve (Figure 5), five standard solutions were prepared in 50 mL volumetric flasks from a solution of 4-vinylphenol (10% purity) and a solution of 4-ethylphenol (99% purity). The final concentrations ranged from 2.03 up to 25.40 mg/L of 4-vinylphenol and 2.12 up to 26.5 mg/L of 4-ethylphenol.The internal standard was added to each standard solution and the extraction proceeded as described
22
in section 2.3. The average retention times for the analysed compounds are shown in table 4.
Table 4. Average retention times for volatile phenols and internal standard.
Compound Average Retention Times (minutes)
3-octanol (Internal Standard) 29.56
4-ethylphenol 75.03
4-vinylphenol 85.31
Statistical analysis where performed for the calibration curves (IUPAC, 2007), the detection and quantification limits for each compound are presented in table 5.
Table 5: Detection limits for 4-vinylphenol and 4-ethylphenol.
Compound Detection Limit mg/L Quantification Limit mg/L
4-vinylphenol 1.5 4.8 4-ethylphenol 0.76 2.5
Figure 5. Calibration curve for 4-ethylphenol (4-EP) and 4-vinylphenol (4-VP).
y = 1,9990x - 0,7492 R² = 0,9995 y = 0,4729x - 0,4724 R² = 0,9979 0 10 20 30 40 50 60 0 5 10 15 20 25 30 Are a Co m po un d/Area I nte rna l st a nd a rd Concentration (mg/L) 4-EP 4-VP
23
2.5. High-Performance Liquid Chromatography analysis
The analysis of residual p-coumaric left in the medium and phloretic acid produced was carried out by a Beckman Gold HPLC system (Beckman Coulter, USA) equipped with a Diode Array Detector and a Zorbax Eclipse XDB-C18 analytical column, 4.6 x 150 nm 5 micron from Agilent Techonogies (Santa Clara, CA, USA). The automatic injector was used in a full loop of 20 μl, with a mobile phase A composed of 100% acetonitrile (Fisher Scientific ,Loughborough, UK), and a mobile phase B composed of 95% ultrapure water; 5% acetonitrile; 2.0 ml/L trifluoracetic acid (98%) obtained from Sigma-Aldrich, Stenheim, Germany. The elution program was as follows: 0min: 100% B; 2min: 60%B; 28min: 100%B (during 3minutes), with flow rate fixed at 1.0 ml/min.
Both mobile phases were filtered and placed in an ultrasound bath for ten minutes to eliminate remaining air bubbles. Samples were filtered into the vials, using 0.45 μm-pore syringe filters (VWR International, USA) prior to injection.
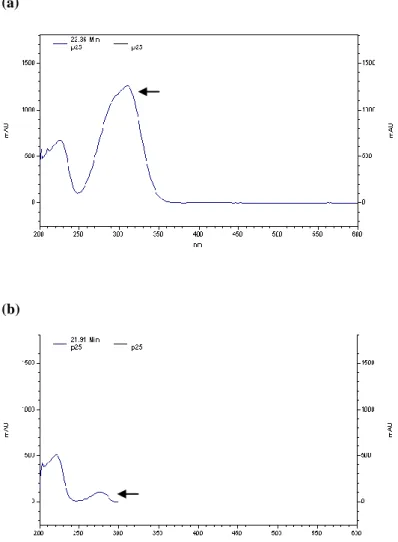
In order to identify and quantify the peaks, a calibration was performed for p-coumaric acid and phloretic acid. The UV absorption spectrum (Figure 6) and maximum wavelength absorbance (Table 6) for each acid were also used for identification of the compounds. Five standard solutions where prepared in 50.00 mL volumetric flasks containing different concentrations of phloretic acid, and p-coumaric acid.
All dilutions were microfiltered with syringe filters of 0.45 μm pore size into vials that were then injected in the HPLC-DAD system. The average retention times and calibration curves are represented in table 6 and Figure 6 respectively.
24
(a)
(b)
Figure 6. UV absorption spectrum of p-coumaric acid (a) and phloretic acid (b).
Table 6. Average retention times in the HPLC-DAD system and wavelength of
maximum absorbance obtained for phloretic acid and p-coumaric acid.
Compound Average Retention Time (minutes)
Wavelength of maximum absorbance (nm)
Phloretic acid 19.38 275-281
25
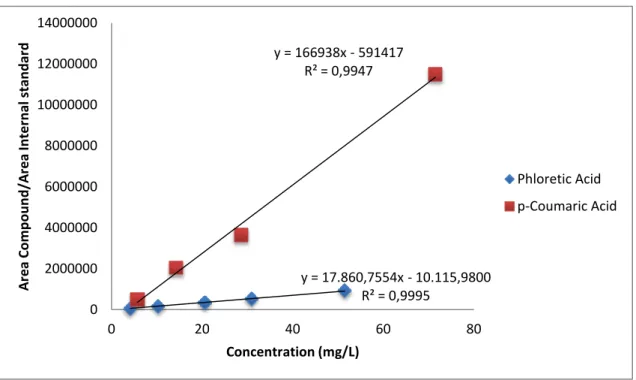
Figure 6: Calibration curves for phloretic acid and p-coumaric acid
Statistical analysis was performed for the calibration curves (IUPAC, 2007), the detection and quantification limits for each compound are presented in table 7.
Table 7. Detection limits for p-coumaric acid and phloretic acid.
Compound Detection Limit mg/L Quantification Limit mg/L p-coumaric acid 7.9 26.0 Phloretic acid 3.1 10.2 y = 17.860,7554x - 10.115,9800 R² = 0,9995 y = 166938x - 591417 R² = 0,9947 0 2000000 4000000 6000000 8000000 10000000 12000000 14000000 0 20 40 60 80 A re a Co m p o u n d /A re a In te rn al st an d ar d Concentration (mg/L) Phloretic Acid p-Coumaric Acid
26
3. Results
3.1 Volatile phenols production
In order to characterize PAR and PAD/VPR activities in the LAB surveyed, gas-liquid chromatography was used to quantify the production of volatile phenols by these bacteria (4-VP and 4-EP) from the precursor p-coumaric acid. The molar conversion rates of p-coumaric acid into volatile phenols were calculated by dividing the molar concentration of 4-VP and 4-EP by the initial molar concentrations of this precursor added to the medium. Some of the results are below the limit of detection calculated for the calibration curve and are marked in the tables. Results are the average values of two experiments.
3.1.1. Volatile phenols production from different concentrations of p-coumaric acid
In order to evaluate the bacterial behaviour, three different concentrations of p-coumaric acid were used (1.0, 5.0 and 50 mg/L) and the obtained results are presented in tables 8, 9, and 10, respectively. In some cases conversion rates higher than 100% were obtained. This may have happened due to a possible experimental error. Moreover, some of the results are below the detection limit.
Table 8. Production of 4-VP and 4-EP from p-coumaric acid at 1.0 mg/L in MRS Broth.
Bacterial Strains 4-VP (mg/L) Molar conversion (%) 4-EP (mg/L) Molar conversion (%)
Lactobacillus collinoides ESB 99 0,54* 74 0,03* 4
Lactobacillus kefir NCFB 2737 1,44 196 0,29* 39
Lactobacillus mali NCFB 2168 0,05* 7 0,49* 66
Lactobacillus sakei LB 706 1,57 215 0,04* 5
Lactobacillus viridiscens NCFB 8965 0,14* 19 nd 0
Pediococcus pentosaceus NCFB 990 0,33* 45 nd 0
27
When using 1.0 mg/L of p-coumaric acid, L. collinoides, L. kefir and L. sakei converted this acid into mostly 4-VP, while L. mali showed higher amounts of 4-EP (molar conversion rate 66%) then 4-VP. L. viridescens and P. pentosaceus did not produce 4-EP, presenting molar conversion rates for 4-VP of 19 and 45%, respectively. The decarboxylation of p-coumaric acid into 4-VP and consequent reduction to 4-EP suggests PAD and VPR activity
Table 9. Production of 4-VP and 4-EP from p-coumaric acid at 5.0 mg/L in MRS Broth.
Bacterial Strains 4-VP (mg/L) Molar conversion (%) 4-EP (mg/L) Molar conversion (%)
Lactobacillus collinoides ESB 99 0,45* 12 0,15* 4
Lactobacillus kefir NCFB 2737 0,59* 16 0,13* 3 Lactobacillus mali NCFB 2168 0,70* 19 0,16* 4 Lactobacillus sakei LB 706 0,44* 12 0,13* 3 Lactobacillus viridiscens NCFB 8965 0,52* 14 0,02* 0 Pediococcus pentosaceus NCFB 990 0,37* 10 0,30* 8
*Values below the limit of detection
In the experiments done with an initial concentration of 5.0 mg/L of p-coumaric acid, all of the strains produced higher quantities of 4-VP then 4-EP. Lactobacillus mali was the strain with higher molar conversion rate into 4-VP (19%), and Pediococcus pentosaceus showed the higher molar conversion rate into 4-EP (8%). It is noteworthy that some of the strains show lower concentrations of 4-VP and/or 4-EP at 5.0 mg/L than at 1.0 mg/L, namely L. mali, L. kefir and L. sakei.
With 50 mg/L of p-coumaric acid, L. sakei and P. pentosaceus almost fully decarboxylate this substrate into 4-VP. It can also be observed that L. collinoides, L. kefir and L. mali, reduced a high amount of 4-VP into 4-EP with molar conversion rates of 50%, 72% and 59% respectively, regardless of some 4-VP still being left in the medium. L. viridescens produced almost none of both volatile phenols. Figure 7 shows the comparison between the results with 5.0 mg/L and 50 mg/L of p-coumaric acid.
28
Table 10. Production of 4-VP and 4-EP from p-coumaric acid at 50 mg/L in MRS Broth.
Bacterial Strains 4-VP (mg/L) Molar conversion (%) 4-EP (mg/L) Molar conversion (%)
Lactobacillus collinoides ESB 99 6,41 18 18,70 50
Lactobacillus kefir NCFB 2737 0,91 2 26,84 72 Lactobacillus mali NCFB 2168 0,29* 1 22,02 59 Lactobacillus sakei LB 706 53,36 146 2,12 6 Lactobacillus viridiscens NCFB 8965 0,39* 1 0,24* 1 Pediococcus pentosaceus NCFB 990 61,26 167 0,10* 0
*Values below the limit of detection
.
Figure 7. Production of 4-VP, 4-EP and phloretic acid (PA) with different concentrations of
29
3.1.2. Volatile phenols production from p-coumaric acid with addition of L-malic acid to the medium
L-malic acid was added to the medium to a final concentration of 4.0 g/L, using an initial concentration of 5.0 mg/L of p-coumaric acid for the three strains selected. The results are shown in table 11.
To better understand the difference caused by the addiction of L-malic acid, the results were compared with the ones obtained with 5.0 mg/L of p-coumaric acid in the first part of this work, which, in this section, will be referred to as controls. Figure 8 shows the comparison between these two results.
Table 11. Production of 4-VP and 4-EP from p-coumaric acid at 5.0 mg/L in MRS Broth with
L-malic acid added to a concentration of 4.0 g/L.
Bacterial Strains 4-VP (mg/L) Molar conversion (%) 4-EP (ml/L) Molar conversion (%)
Lactobacillus collinoides ESB 99 1,71 47 0,13* 3
Lactobacillus sakei LB 706 1,60 44 0,19* 5
Pediococcus pentosaceus NCFB
990 0,79 22 0,05* 1
*Values below the limit of detection
In the presence of L-malic acid, L. collinoides produced higher quantities of 4-VP when comparing with the control, while production of 4-EP was approximately the same. P. pentosaceus showed decrease in 4-EP production (8% to 1% molar conversion rate), while 4-VP production was stimulated, doubling the conversion rate when comparing with respective control. L. sakei, on the other hand, showed an increase in both volatile phenols, more noticeable in 4-VP production.
Figure 8 presents the comparison of results for the production of volatile phenols with the addition of L-malic acid to the medium.
30
Figure 8. Production of 4-VP, 4-EP and phloretic acid (PA) with L-malic acid added to a
concentration of 4.0 g/L, and respective controls.
3.1.3. Production of volatile phenols from p-coumaric acid with addition of fructose to the medium.
To evaluate the influence of fructose in the production of volatile phenols, 3.0 g/L of this hexose was added to the medium, along with a 5 mg/L concentration of p-coumaric acid. The controls used where the same as in 3.1.2. The results are presented in table 12.
Table 12. Production of 4-VP and 4-EP from p-coumaric acid at 5.0 mg/L in MRS Broth with
fructose added to a concentration of 3.0 g/L.
Bacterial Strains 4-VP (mg/L) Molar conversion (%) 4-EP (ml/L) Molar conversion (%)
Lactobacillus collinoides ESB 99 1,55 42 0,16* 4
Lactobacillus sakei LB 706 1,22 33 0,07* 2
Pediococcus pentosaceus NCFB
990 1,19 33 nd 0
nd – not detected; *Values below the limit of detection
With fructose added to the medium, the three strains showed higher production of 4-VP. L. collinoides was the strain with higher stimulation of PAD, with a 42% of molar conversion rate when comparing with 12% of the respective control. As for 4-EP production, P. pentosaceus, production was null, showing no VPR activity, while L. sakei showed a very low decrease and L. collinoides maintained the amount produced. Figure 9 show the comparison between these results.
31
Figure 9. Production of 4-VP, 4-EP and phloretic acid (PA) with fructose added to a
concentration of 3.0 g/L, and respective controls.
3.2 Non-volatile phenolic compounds production
After one week of incubation, the samples were analysed through HPLC-DAD in order to measure the concentrations of non-volatile phenolic metabolites, namely p-coumaric acid remaining in the growth medium (after fermentation) and the presence of phloretic acid, as a result of the reduction of p-coumaric acid. Molar concentration of phloretic acid was divided by the initial molar concentration of p-coumaric acid in order to calculate the molar conversion rates. Results are the average values of two experiments.
3.2.1. Non-volatile phenolic compounds production from different concentrations of p-coumaric acid
For the initial concentration of p-coumaric acid at 1.0 mg/L, phloretic acid was not found, and also no p-coumaric acid remained in the medium (data not shown). The results for the production of phloretic acid as well as the remaining amount of p-coumaric acid with 5.0 mg/L and 50 mg/L of initial p-p-coumaric acid are shown in table 13 and table 14 respectively. Some of the results are below the limit of detection calculated for the calibration curve and are pointed in the tables. Results are the average values of two experiments.
32
With 5.0 mg/L of p-coumaric acid, phloretic acid wasn´t detected in any of the strains tested. As for residual p-coumaric acid, all of the strains appear not to fully consume this subtract.
Table 13. Production of phloretic acid from coumaric acid at 5.0 mg/L and residual
p-coumaric acid in the medium.
Bacterial Strains Phloretic acid (mg/L) Molar conversion (%) Residual p-coumaric acid (mg/L) Residual p-coumaric acid (%)
Lactobacillus collinoides ESB 99 nd 0 3.07 61
Lactobacillus kefir NCFB 2737 nd 0 1.28 26 Lactobacillus mali NCFB 2168 nd 0 2.13 43 Lactobacillus sakei LB 706 nd 0 1.84 37 Lactobacillus viridiscens NCFB 8965 nd 0 1.13 23 Pediococcus pentosaceus NCFB 990 nd 0 1.91 38
nd – not detected; *Values below the limit of detection
Table 14. Production of phloretic acid from coumaric acid at 50 mg/L and residual
p-coumaric acid in the medium.
Bacterial Strains Phloretic acid (mg/L) Molar conversion (%) Residual p-coumaric acid (mg/L) Residual p-coumaric acid (%)
Lactobacillus collinoides ESB 99 11,02 22 nd 0
Lactobacillus kefir NCFB 2737 8,81 17 nd 0 Lactobacillus mali NCFB 2168 8,62 17 nd 0 Lactobacillus sakei LB 706 9,51 19 nd 0 Lactobacillus viridiscens NCFB 8965 nd 0 13,65 27 Pediococcus pentosaceus NCFB 990 nd 0 5,73 11
nd – not detected *Values below the limit of detection
Of the six strains analysed with 50 mg/L of p-coumaric acid, four produced phloretic acid, being L. collinoides the strain with higher rate, presenting a molar
33
conversion of 22%. L. kefir and L. mali also transformed 17% of p-coumaric acid into phloretic acid, while L. sakei showed a conversion rate of 19%.
Only L. viridescens and P. pentosaceus presented residual p-coumaric in the medium. As for L. kefir and L. sakei, results suggest that p-coumaric acid was fully degraded since the total molar conversion rates where near 100%. On the other hand, L. collinoides and L. mali molar conversion rates were 90 and 77% respectively, and no residual p-coumaric acid was found in the medium, suggesting the possibility that some substrate was lost during filtration or that maybe it combined with some other component unknown at the time.
3.2.2. Non-volatile phenolic compounds production from p-coumaric acid with addition of L-malic acid to the medium.
L-malic acid was added to the medium to a final concentration of 4.0 g/L, using an initial concentration of 5.0 mg/L of p-coumaric acid for the three stains selected. The results were compared with the ones obtained with 5 mg/L of p-coumaric acid in the first part of this work, which, in this section, will be referred to as controls.
The presence of L-malic acid in the medium apparently didn´t induce the production of phloretic acid in any of the strains. Residual p-coumaric acid found after the 7 days of incubation was only detected in P. pentosaceus, with lower amount left in the medium (21%) when comparing with the control (38%). Moreover, L. collinoides and L. sakei showed no residual p-coumaric acid in the medium, while residual amounts were found in the controls, 61% and 37%, respectively. Once again, the total molar conversion rates (50 and 49%, respectively) suggest that some of the substrate was lost.
34
3.2.3. Non-volatile phenolic compounds production from p-coumaric acid with addition of fructose to the medium.
The influence of fructose in the production of non-volatile metabolites was evaluated, with 3.0 g/L of this hexose added to the medium, along with a 5.0 mg/L concentration of p-coumaric acid. The controls used where the same as in 3.1.2.
Phloretic acid wasn´t detected in any of the strains, while residual p-coumaric acid was only found in P. pentosaceus with lower amount left (12% conversion rate) when comparing with control (38% conversion rate). Furthermore, L. collinoides and L. sakei didn´t show any residual p-coumaric acid in the medium, while residual amounts were found in the controls, 61% and 37%, respectively, suggesting the possibility that some substrate was lost during filtration or that maybe it combined with some other component unknown at the time.
35
4. Discussion
4.1. Influence of p-coumaric acid concentration in the production of VP and Non-volatile phenolic compounds
All tested strains were able to produce volatile phenols (4-VP and/or 4-EP) from different initial concentrations of p-coumaric acid. Some patterns were observed, with strain dependent behaviours being perceived. Phloretic acid was only detected in four of the six strains, when using the highest amount of p-coumaric acid.
Literature indicates that L. collinoides ESB 99, isolated from wine, has both PAD and VPR activity and is a strong producer of 4-EP (Silva et al., 2011a). Couto et al. (2006) showed that 4-VP and 4-EP production by L. collinoides increased when supplementing the medium with higher amounts of p-coumaric acid (5.0, 50 and 500 mg/L). In this work, the conversion rate of 4-VP by L. collinoides did in fact increase when p-coumaric acid was augmented (from 5.0 to 50 mg/L), suggesting that the initial concentrations of substrate plays an important role in the final amount of volatile phenols produced.
Del Hoyo, 2012, studied more than thirteen LAB strains for phenolic acid reductase activity, being L. collinoides ESB 99 one of the strains that produced phloretic acid from p-coumaric acid at 50 mg/L. It can be noticed that both 4-VP and 4-EP increased from 5.0 to 50 mg/L of p-coumaric acid, but at lower concentrations, the stimulation of VPR activity seemed to be minor.
In this work, residual p-coumaric acid in the medium was quantified. Regarding L. collinoides, at 5.0 mg/L, 61% of this substrate was detected at the end of the experiment. A possible explanation for this fact is that, at lower p-coumaric acid concentration the bacteria doesn´t fully metabolize this acid, but when increasing the concentration, the toxicity also increases, leading to its transformation in 4-VP, a less toxic compound for the microorganism (Couto et al., 2006). PAR activity seemed to be stimulated as well (22% of molar conversion rate to phloretic acid), although it appears to be a less effective detoxification system according to Barthelmebs et al., (2000) study with in L. plantarum. These authors demonstrated the existence of another inducible phenolic acid decarboxylase (PAD2) that, as well as PAR activity, showed slower
36
conversion of p-coumaric acid, thus presenting a disadvantage when detoxifying the cell. Toxicity of phenolic acids is thought to be due to the dissipation of the cell ΔpH (uptake of the protonated form and the consequent release of H+ in the interior of the cell) and to a specific mechanism of phenolic acids (Barthelmebs et al., 2000).
Apart from some strains of L. collinoides, L. mali is also an important bacteria in cider production. The strain chosen for this work, L. mali NCFB 2168, was isolated from cider apple juice. Previous work (Couto et al., 2006; Buron et al., 2011) have shown that L. mali produce 4-VP at high conversion rates, thus exhibiting decarboxylation activity but not reduction activity. The results from the present work suggest the opposite, with high conversion rates of 4-EP when using 50 mg/L of p-coumaric acid. With 5.0 mg/L, it was detected a low VPR activity.
The same behaviour was observed with L. kefir, which presented high conversion rates of 4-EP, contrary to results obtained from Couto et al. (2006), where production was practically null. Although del Hoyo (2012) detected PAR activity in both L. mali and L. kefir, in agreement with this work, volatile phenols production is not consistent with previous works.
P. pentosaceus is well known for its PAD activity, Cavin et al. (1993) first demonstrated this ability, which later was confirmed by Couto et al. (2006) and de las Rivas et al. (2009). The results of the present work also indicate that P. pentosaceus NCFB 990 fully decarboxylates p-coumaric acid in to 4-VP at 50 mg/L of this substrate. At lower concentrations, results suggest some VPR activity, with 4-EP molar conversion of 8% and a much lower PAD activity when comparing with 50 mg/L results, with 4-VP molar conversion rate of 10% (Figure 7). Couto et al. (2006) also showed that higher conversion yields for 4-VP were obtained with 500 mg/L of coumaric acid than with 50 mg/L, reinforcing the idea that the initial concentration of p-coumaric acid seems to play an important role in the synthesis of volatile phenols. Despite the fact that in her work del Hoyo (2012) detected PAR activity by this strain, no production of phloretic acid was detected in this work. With 50.0 mg/L of p-coumaric acid this behaviour was expected since the 4-VP molar conversion rate demonstrates full decarboxylation of this substrate (167% of convertion rate),. The incoherence regarding this experience, is the residual p-coumaric acid left in the medium. With the high conversion rate presented for 4-VP it shouldn’t be any left.
37
There are not many studies regarding the production of volatile phenols by L. sakei and L. viridescens . Couto et al., (2006), studied a different strain of L. sakei, showing that higher p-coumaric concentration resulted in high amounts of 4-VP, while VPR activity was basically null. The results were similar with the strain used in this work. L. sakei LB 706 showed a higher PAD activity at 50 mg/L than with 5.0 mg/L, while VPR activity was very low with both concentrations used. In accordance with del Hoyo (2012), this strain showed PAR activity, producing phloretic acid with 50 mg/L of p-coumaric acid.
On the other hand, for L. viridescens NCFB 8965, which Couto et al. (2006) identified as high producer of 4-VP, no significant volatile phenols were detected in this work at 50 mg/L. The only PAD activity appear to occur at 5.0 mg/L, with a molar conversion rate of 14% for 4-VP. However, it should be pointed out that these authors used a different growth medium which was supplemented with 5% v/v ethanol. Moreover, with 50 mg/L, around 75% of p-coumaric acid was used, suggesting that the strain consumed the substrate but didn´t decarboxylate or reduced it to either 4-VP or phloretic acid, respectively. This suggests that either p-coumaric acid was lost during the experience, or that resulting metabolites are unknown at this stage.
In all strains, residual p-coumaric acid was detected in the medium supplemented with 5.0 mg/L of this phenolic acid. This may be explained by the toxicity that hydroxycinnamic acids presents to the bacteria, which increases when using higher amounts of p-coumaric acid, leading to a response from the bacteria.
4.2. Influence of L-malic acid in the production of VP and Non-volatile phenolic compounds
When adding L-malic acid to the medium, it is expected a stimulation of bacterial growth due to an increase of pH (Fugelsang et al., 2007). Silva et al. (2011a) studied some factors that may influence the volatile phenols production, including the addition of L-malic acid to the medium, where L. collinoides ESB 99 produced high quantities of 4-EP while diminishing 4-VP. In the present work, the production of 4-EP was approximately the same when comparing to the control. On the other hand, 4-VP increased, meaning that decarboxylation step was favoured. One possible explanation
38
for this occurrence is that the bacteria didn´t need to reduce 4-VP to 4-EP to regenerate NAD+. On the other hand, lactic acid bacteria are the only bacterial group that is both strictly fermentative and able to grow in the presence of oxygen (Jackson et al., 2008). If trace amounts of oxygen where present during bacterial growth, it is possible that they regenerate NAD+ from oxygen. However, there is no way of telling if the L-malic acid was consumed at all, since it wasn´t measured at the beginning or at the end of the experience.
Regarding P. pentosaceus NCFB 990, in the presence of L-malic acid, Silva et al. (2011a) didn´t register any change in the behaviour of this strain. In this study, however, this strain showed a decrease in VPR activity, while PAD activity was stimulated, but to a lesser extent then the other two strains tested. Moreover, this species showed a weak 4EP synthesis in any of the scenarios investigated, in accordance with previous studies (Couto et al., 2006; Silva et al., 2011a). Chatonnet et al, (1995) also shows that P. pentosaceus 4-EP production is almost null, and also that the consumption of L-malic acid in the presence of phenolic acids is not affected.
To our knowledge, there are not many studies regarding production of volatile phenols by L. sakei, and none about the influence of L-malic acid related to this event.. The present results show that L-malic acid stimulated this strain to produce volatile phenols, especially 4-VP. VPR activity, responsible for the reduction of 4-VP to 4-EP, was slightly stimulated, suggesting that the bacteria poorly resort to this step to obtain NAD+.
None of the three strains produced phloretic acid from the metabolism of 5 mg/L of p-coumaric acid. As for the residual p-coumaric acid found in the medium, it was only found in P. pentosaceus. The results suggest that p-coumaric was converted into metabolites that weren’t detected in this study or lost during some procedures.
In summary, at lower concentration of p-coumaric acid (5.0 mg/L) L-malic acid seemed not to stimulate VPR activity, as it was observed at higher concentration of this substrate by Silva et al. (2011a). On the contrary, PAD activity appears to increase.
39
4.3. Influence of fructose in the production of VP and Non-volatile phenolic compounds
Silva et al. (2011a) suggested that when fructose is added in combination with glucose, production of 4-EP by some lactic acid bacteria was diminished while the production of 4-VP was favoured.
As mentioned before, since L. collinoides ESB 99 is strictly heterofermentative, it may reduce fructose to mannitol as an alternative pathway to the regeneration of NAD+. In accordance with Silva et al. (2011a), the results obtained in this work suggest that production of 4-VP by L. collinoides ESB 99 was indeed stimulated, while production of 4-EP was not affected and remained low, when comparing with controls.
In the experiments done with P. pentosaceus and L. sakei, which are, respectively, homofermentative and facultatively heterofermentative,the presence of fructose increased the production of 4-VP at the expense of the production of 4-EP.
Phloretic acid wasn’t detected in any of the three strains studied, so the presence of fructose didn’t change, in this respect, the metabolism of 5.0 mg/L of p-coumaric acid. Regarding the residual p-coumaric acid found in the medium, only P. pentosaceus showed remaining amounts. According to the conversion rates, the results suggests that either p-coumaric acid was lost during the experience, or that resulting metabolites are unknown at this stage.
Once again, this is an interesting finding, suggesting that unknown metabolites might have been synthesized.
40
5. Conclusion
This work focused on characterizing PAR and PAD/VPR activities of LAB, as an attempt to clarify the metabolic pathways of p-coumaric acid degradation.
The initial concentration of p-coumaric used seems to have high importance in the extension of volatile phenols production, and also in the effect that L-malic acid has in their production. When comparing to previous studies, at low concentration of p-coumaric acid, L-malic acid appears to stimulate PAD activity at a higher extent then VPR activity. In some of the strains studied, the production of volatile phenols was higher at lower concentrations, which is an important fact since phenolic compounds exist in wine at concentrations about 0.01–0.2% (Soleas et al., 1997), much lower than the ones used in this study. Further studies need to be carried out trying to recreate wine environment.
The importance of characterizing PAD/VPR and PAR activities is that if the later one is to be induced and become the main pathway for p-coumaric degradation, this could be the basis for a strategy to diminish the concentration of volatile phenols precursors. In this work, PAR activity was only detected when using 50 mg/L of p-coumaric acid. The addition of L-malic acid or fructose didn´t show any influence on this enzyme activity. However, further experiments need to be carried out in order to have more information about this subject.
During this work, some limitations might have affected the quantification of metabolites production when using the HPLC-DAD system, since very small amounts of initial p-coumaric acid were used. Moreover, the time of waiting when using GC could also have affected the volatile fractions, including the internal standard which is more volatile than the other compounds in the extracts.
41
References
Bakker, J. and Clarke, R.J., 2012. Wine Flavour Wine Flavour 2nd ed., John Wiley & Sons, Ltd, West Sussex.
Barthelmebs, L, Divies, C. and Cavin, J. F., 2000. Knockout of the p-Coumarate Decarboxylase Gene from Lactobacillus plantarum Reveals the Existence of Two Other Inducible Enzymatic Activities Involved in Phenolic Acid Metabolism. Applied and environmental microbiology, 66(8), 3368–3375.
Buron, N, Coton, M, Desmarais, C, Ledauphin, J, Guichard, H, Barillier, D. and Coton, E., 2011. Screening of Representative Cider Yeasts and Bacteria for Volatile Phenol-Production Ability. Food microbiology, 28(7), 1243–51.
Buron, N., Coton, M., Legendre, P., Ledauphin, J., Kientz-Bouchart, V., Guichard, H., Barillier, D. and Coton, E., 2012. Implications of Lactobacillus collinoides and Brettanomyces/Dekkera anomala in Phenolic Off-flavour Defects of Ciders. International Journal of Food Microbiology, 153 159–165
Campos, F.M., Couto, J.A., and Hogg, T.A., 2003. Influence of Phenolic Acids on Growth and Inactivation of Oenococcus Oeni and Lactobacillus hilgardii. Journal of Applied Microbiology 2003, 94, 167–174.
Campos, F.M., Couto, J.A., Figueiredo, A.R., Tóth, I.V., Rangel, A.O.S.S. and Hogg, T.A., 2009. Cell Membrane Damage Induced by Phenolic Acids on Wine Lactic Acid Bacteria. International Journal of Food Microbiology, 135(2), 144–151.
Carrascosa, A.V., Munñoz, R. and González, R., 2011. Molecular Wine Microbiology 1st ed., Elsevier, London.
Cavin, J.F., Andioc, V., Etievant, P. X. and Divies, C., 1993. Ability of Wine Lactic Acid Bacteria to Metabolize Phenol Carboxylic Acids. American Society for Enology and Viticulture, 44(1), 76–80.
Cavin, J.F., Barthelmebs, L. and Divies, C., 1997. Molecular Characterization of an Inducible p-coumaric Acid Decarboxylase from Lactobacillus plantarum : Gene