Artigo
*e-mail: [email protected]
BIOPRODUCTION AND CHARACTERIZATION OF SODIUM, POTASSIUM, AND CALCIUM LACTOBIONATES
Maria G. Delagustina,*, Eduarda Gonçalvesa, Sabrina Carraa,Thiago Barcellosa, Valquíria L. Bassanib, Mauricio M.
Silveiraa e Eloane Malvessia
aUniversidade de Caxias do Sul, Instituto de Biotecnologia, Caxias do Sul – RS, Brasil bUniversidade Federal do Rio Grande do Sul, Faculdade de Farmácia, Porto Alegre – RS, Brasil
Recebido em 28/02/2017; aceito em 27/06/2017; publicado na web em 22/08/2017
Lactobionic acid and its salts are substances that have several applications in the pharmaceutical area. These products were obtained by bioconversion through the enzymatic complex glucose-fructose-oxidoreductase (GFOR)/gluconolactonase (GL) present in calcium alginate immobilized cells of Zymomonas mobilis. In the reactions catalyzed by this enzyme system, the medium pH must be controlled at slightly acid values. For this purpose, NaOH, KOH, or Ca(OH)2 were used, and as a result, the respective salts were formed. The kinetic study on the formation of sodium, potassium and calcium lactobionates was followed by the steps of purification and characterization aiming the potential use of these compounds in the pharmaceutical area. In the assays for the bioproduction of sodium, potassium or calcium lactobionates, yields of 74, 77 and 84% were obtained, respectively. In the salts purification step, purity levels of approximately 95% were achieved. The structural identities of the lactobionate salts were determined by high resolution mass spectrometry, in addition to the 13C and 1H NMR analysis. The characterization demonstrates the selectivity of the enzymatic reaction of GFOR/GL of Z. mobilis, in the production of lactobionic acid and its salts.
Keywords: Zymomonas mobilis; lactobionate; lactobionic acid; characterization; mass spectrometry; 13C and 1H NMR analysis.
INTRODUCTION
Lactobionic acid is composed by a polyhydroxy acid, gluconic acid attached to a monosaccharide, galactose.1 This substance is used in the pharmaceutical field, due its hydrating capacity of the skin, as a preventive agent for cutaneous aging, also acting as a reducer of cutaneous hyperpigmentation and as an antioxidant.1-3 It is known as the major component of the Wisconsin solution (UW) used to preserve organs to be transplanted.4-6 It can also be used as part of drug delivery system because of its binding capacity to asialoglycoprotein (ASGPR) receptors present in hepatic cells.6,7 An example is its use as a vector of the antitumor drug doxorubicin.8,9 In the food industry, it has been used as acidulant and stabilizer.6,7
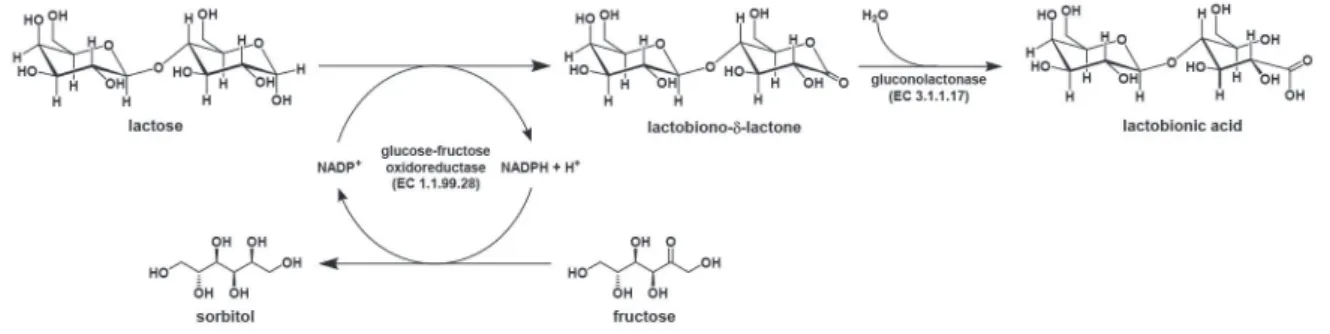
Some reports show the use of the anaerobic bacterium Zymomonas mobilis to producelactobionic acid / lactobionate.10-12 This microorganism, presents in its periplasm the glucose-fructose oxidoreductase (GFOR, EC 1.1.99.28)/glucono-lactonase (GL, EC 3.1.1.17) complex. These enzymes operate on a ping-pong mechanism, in which lactose is oxidized to lactobiono-δ-lactone while fructose, which is employed as substrate for the regeneration of the NADPH cofactor, is reduced to sorbitol. Subsequently, by the
action of GL, lactobiono-δ-lactone is hydrolyzed to lactobionic acid (Figure 1).11,13
In the bioproduction of lactobionic acid and sorbitol, using Z. mobilis GFOR/GL system, the pH of the reaction medium should be controlled in order to maintain the catalytic activity of the enzyme. As the lactobionic acid is formed, there is a tendency to decrease the pH and, for the maintenance of the catalytic activity, it should be kept at 6,4. Thus, an alkaline solution is used to control the pH, obtaining the lactobionic acid in the form of salt, the lactobionate. Depending on the base used, different salts can be obtained, for example, sodium,11,14 potassium15,16 or calcium lactobionates.17,18
For the purification of lactobionic acid or lactobionates, the precipitation technique by using ethanol is reported, since these compounds are insoluble in this solvent. On the other hand, sorbitol, lactose and fructose are soluble in ethanol in different proportions. Depending on the required purity, precipitation can be performed more than once, thus obtaining more pure substances.14-19
Due to the lack of information in the literature regarding the physical-chemical characterization of sodium, potassium and calcium lactobionates, and aiming to employ these ingredients in the pharmaceutical and food industries, the elucidation of these
parameters is fundamental to bring safety about the use of these compounds. In this context, the present work had the objective of conducting bioproduction assays of sodium, potassium and calcium lactobionates by Z. mobilis immobilized enzymatic system, to evaluate the purification and to carry out the physical and chemical characterization of the obtained products.
EXPERIMENTAL
Cell biomass production
The bacterium Zymomomas mobilis ATCC 29191 (DSM 3580) was used in this work. The media composition and growth condition was described in previous studies.20
Cell production and permeabilization
Inocula were prepared in flasks containing 450 mL of medium and kept under orbital agitation of 200 rpm (Certomat U, Sartorius Stedim Biotech, Germany) at 30 °C under anaerobic conditions for approximately 10 h. Batch cultivation were carried out in mechanical agitation bioreactor with 5.0 L of medium, under impeller speed of 450 rpm, at 30 °C and automatic pH control in 5.5 with 5.0 mol L-1 NaOH. In the end of the cultivation, the cells mass was harvested from the medium by centrifugation at 6000 rpm (Sigma 4K-15 centrifuge, Sartorius Stedim Biotech, Germany) for 10 min, concentrated to 25 g L-1 and permeabilized with cetyl trimethylammonium bromide (CTAB). CTAB (0.2% w/v) was added to the cell suspension and kept under magnetic stirring at 4 °C for 10 min. In the end, the blend was centrifuged at 6000 rpm (Sigma 4K-15 centrifuge, Sartorius Stedim Biotech, Germany) for 10 min. The cells were then concentrated to 50 g L-1 and 25% (w/v) glutaraldehyde volume added to give a concentration of 0.5% (w/v). After stirring for 10 min, the mixture was again centrifuged and re-suspended to 70 g L-1.14
Cell immobilization
To immobilize Z. mobilis cells in calcium alginate, a mixture of equal volumes of 4% (w/v) sodium alginate (Algogel 5540, Degussa Flavor & Fruit Systems of Brazil Ltda) and Z. mobilis cell suspension (70 g L-1) was maintained under mechanical stirring (50 rpm) for 2 h. For the formation of the calcium alginate beads and cell immobilization, the entire volume of the suspension was added drop-wise onto a 0.3 mol L-1 CaCl
2 solution through hypodermic needles with the aid of a peristaltic pump. The beads were then cross-linked with 0.5% (w/v) glutaraldehyde under magnetic stirring at room temperature.14
Bioconversion assays
The bioproduction assays of sorbitol and lactobionate were performed in a jacketed reactor containing 0.35 L of fructose solution (600 mmol L-1) and lactose (700 mmol L1), 20 g L-1 of immobilized biocatalyst, at 39 °C and pH controlled at 6.4 (Dosatronic PH 2900 coupled to a Dosamini 100 peristaltic pump - Provitec, Brazil). The reaction mixture was maintained under magnetic stirring, with pH controlled by the automatic addition of 7.0 mol L-1 solution of NaOH or KOH, whereby sodium or potassium lactobionate, respectively, were obtained. To obtain calcium lactobionate calcium hydroxide [Ca(OH)2] was used to control the pH of the enzymatic reaction. In this case, due to the low solubility in water and, therefore, difficulty of obtaining a concentrated solution (7.0 mol L-1), the alkali was added as a powder in small fractions. The Ca(OH)2 consumption
during the reaction was evaluated by the mass change, determined in a semi-analytical balance, as a function of the bioconversion time.
Parameters of evaluation
The conversion yield in relation to initial substrate (YP/S0, mmol of product/mmol of initial substrate) was determined by dividing the number of mmol of lactobionic acid formed by the number of mmol of substrate in the initial solution. The molar productivity (Pm, mmol of product /h) was determined by dividing the number of mmol of lactobionic acid formed by the process time, while the specific productivity (q, mmol of product/gram of cell/h) was calculated by dividing Pm by the mass of dry cell biomass used. The specific rate of lactobionic acid formation (µP, mmol of product/ gram of cell/h) was determined by the derivation of curves relating molar amount (mmol) of the product formed as a function of the process time and as a function of the lactose concentration, and the velocity values obtained were divided by the mass of Z. mobilis cells used in the tests.
Purification step
The resulting broth from the bioconversion (30 mL) was subjected to purification by the solvent precipitation process. For this, a volume of 96% (v/v) hydro alcoholic solution was added until the obtainment of a final concentration of 75% (v/v). The solvent was added to the solution in a flow rate of 9 ml min-1, controlled by means of a peristaltic pump (Dosamini 100-Provitec, Brazil) at 25 °C under magnetic stirring. Subsequently, the material resulting from the precipitation was stored below 0 °C for 24 h. After this time, the supernatant was removed and the precipitate solubilized in distilled water. This step was repeated to obtain a higher degree of purity of the lactobionates. In the end of the three successive purification steps, the remaining solvent was evaporated, and then the samples were oven dried at 25 °C.
Quantification and identification of lactobionates, sorbitol, lactose and fructose
The determination of the concentrations of lactobionate, sorbitol, lactose and fructose was performed by reverse-phase high-performance liquid chromatography (Agilent Technology 9100) using the Aminex HPX-87H (BioRad) column, mobile phase H2SO4, 0.05 mmol L-1, flow rate of 0.4 mL min-1 at 60 °C, with refractive index detector and injection volume of 10 µL.21 Samples were quantified through standard curve with reference solution in concentration from 1.0 to 14.0 g L-1.
1H and 13C nuclear magnetic resonance analysis
13C NMR spectra of sodium, potassium and calcium lactobionates and lactobionic acid were obtained on a Bruker Fourier 300 spectrometer, (300 MHz for the 1H nucleus and 75 MHz for the 13C nucleus) using deuterated water (D2O) as solvent. Chemical shifts (δ) are expressed in part per million (ppm).
High resolution mass spectrometry analysis
were processed an analyzed using the Bruker Daltonics softwares - Compass Data Analysis and Isotope Pattern.
Statistical analysis
The results were analyzed statistically by the analysis of variance (ANOVA), at a 5% probability level and Tukey’s post-test, using GraphPad Prism 5.01® software.
RESULTS AND DISCUSSION
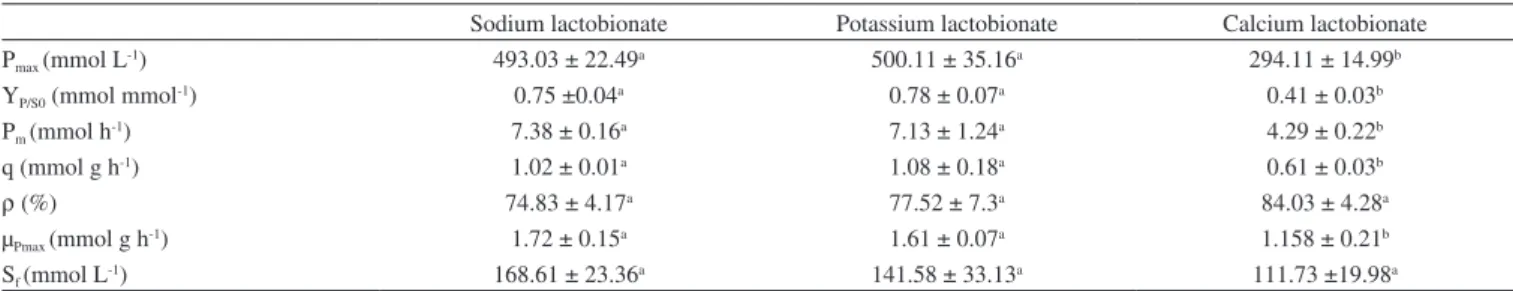
Three bioconversion tests were conducted in order to evaluate the bioproduction kinetics of sodium, potassium and calcium lactobionates by Z. mobilis enzyme system GFOR/GL immobilized in calcium alginate. The assays were conducted in parallel, in triplicate, and with cells / enzymes from the same cultivation. Table 1 shows the results of the kinetic parameters obtained in the bioconversion assays.
According to the data presented in Table 1, a significant difference in terms of production of sodium and potassium lactobionates was not observed. A production of 500 mmol L-1 of the products was achieved within 24 h of reaction, with a conversion of 75% and residual lactose concentration of 150 mmol L-1. For Y
P/S0, values of 0.75 and 0.78 mmol mmol-1 were reached, for each mmol of substrate consumed (lactose), 0.75 mmol of sodium lactobionate or 0.78 of potassium lactobionate were formed, respectively. For Pm, 7.38 and 7.13 mmol of the sodium or potassium lactobionates, respectively, were produced per hour of reaction. About 1.0 mmol of sodium and potassium lactobionates were obtained per gram of cell per hour (specific productivity).
When compared with calcium lactobionate, there was a significant difference in the parameters Pmax, YP/S0, Pm, q and µPmax, with no significant difference in terms of conversion and Sf (Table 1). The parameters that take into account the molar amount of product formed (Pmax, YP/S0, Pm, q and µPmax), presented a significant difference. The stoichiometry calcium lactobionate ratio formation is 2:1, for every 2 moles of lactose consumed, 1.0 mol of calcium lactobionate is produced. This is different for sodium and potassium lactobionates, where the ratio is 1:1. Therefore, it is justifiable that the values of Pmax, YP/S0, Pm, q and µPmax are lower when compared to the production of sodium and potassium lactobionates.
Concerning product yield, the results obtained corroborate the studies carried out by Carra14 who, in a bioproduction test of lactobionic acid by immobilized cells of Z. mobilis, under the same operating conditions, reports the achievement of 72% yield in 24 h of reaction and concentration of residual lactose of 200 mmol L-1.
In the case of yield and Sf, no significant differences were observed between the three bioconversion tests, it should be noted that the yield takes into account the maximum theoretical production in relation to the mass produced. As for the Sf value, as the yields were also similar, the residual lactose concentration was proportional.
Another parameter to be analyzed is the rate of product formation (µP). Figure 2 shows the kinetic profiles of specific product formation velocity as a function of lactose concentration (Figure 2A) and also as a function of time (Figure 2B).
Analyzing the kinetic profiles showed in Figure 2, it is verified that the rate of the reaction is controlled by the concentration of lactose which, as it is consumed, the rate tends to decrease. In this case, as the rate is calculated in terms of mmol, the calcium lactobionate formation
Figure 2. Specific rate of product formation (µP) as a function of lactose concentration [A] and as a function of time [B] in bioconversion assays with immobilized
cells of Zymomonas mobilis (S0=700 mmol L-1 of lactose and 600 mmol L-1 of fructose, X =20 g L-1, pH 6.4, 39 oC, reaction volume 0.35 L)
Table 1. General results of sodium, potassium and calcium lactobionates produced by Zymomonas mobilis immobilized cells (S0 = 700 mmol L
-1 of lactose and 600 mmol L-1 of fructose, biocatalyst concentration = 20 g L-1, pH controlled at 6.4, 39 °C, 24 h)
Sodium lactobionate Potassium lactobionate Calcium lactobionate Pmax (mmol L-1) 493.03 ± 22.49a 500.11 ± 35.16a 294.11 ± 14.99b
YP/S0 (mmol mmol-1) 0.75 ±0.04a 0.78 ± 0.07a 0.41 ± 0.03b
Pm (mmol h-1) 7.38 ± 0.16a 7.13 ± 1.24a 4.29 ± 0.22b
q (mmol g h-1) 1.02 ± 0.01a 1.08 ± 0.18a 0.61 ± 0.03b
ρ (%) 74.83 ± 4.17a 77.52 ± 7.3a 84.03 ± 4.28a
µPmax (mmol g h
-1) 1.72 ± 0.15a 1.61 ± 0.07a 1.158 ± 0.21b
Sf (mmol L
-1) 168.61 ± 23.36a 141.58 ± 33.13a 111.73 ±19.98a
profile, although at a slower rate, follows the same profile in relation to sodium and potassium lactobionates. This rate reduction may have occurred due to the lower affinity of the GFOR/GL system for lactose, when compared to the substrates glucose, maltose and galactose.11
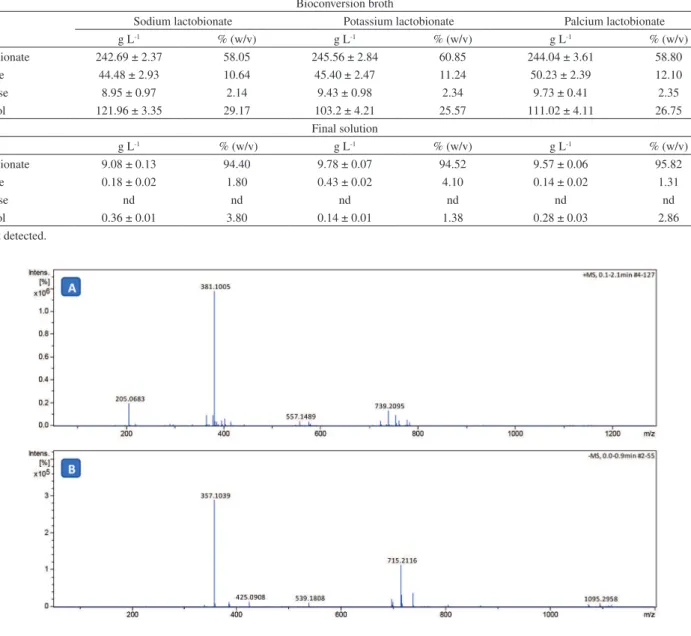
At the end of the respective bioconversion processes, the beads were removed from the medium and the broth content was evaluated by liquid chromatography and subsequently destined to purification step. With the dried and crushed products obtained from the purification, solutions of 10.0 g L-1 were prepared, which were also analyzed by liquid chromatography. The results in terms of substrate concentration and proportions of the final broth of the bioconversion and final product are shown in Table 2.
Analyzing the results for the final production of sodium, potassium and calcium lactobionates, stands out the average yield of 60% (w/v) for lactobionates, 11% (w/v) for lactose, 2% (w/v) for fructose and 27% (w/v) for sorbitol. These results were expected, since the yield and Sf values in the three bioproduction conditions were similar, as observed in Table 1.
However, by analyzing the results of the final products, different proportions of the components were detected. For sodium and calcium
lactobionates, the proportion was found to be 94.40 and 95.82% (w/v) of lactobionate, 1.8 and 1.31% (w/v) lactose and 3.80 and 2.86% (w/v) sorbitol, respectively. For the potassium lactobionate broth, the profile observed in terms of purification was different, in which the lactobionate was also quantified in 95% (w/v), however, a higher percentage of lactose was observed 4.0%, (w/v) and about 1.3% (w/v) of sorbitol.
Sodium lactobionates,14 potassium and calcium are practically insoluble in ethanol, sorbitol is classified as poorly soluble and lactose very little soluble in 75% ethanol.23 Taking into account these characteristics, precipitation, in a higher percentage would be reached for the lactobionates, compared to lactose and sorbitol. Fructose was not detected in the final product of the three trials, which is justifiable since this substance has high solubility in ethanol.22
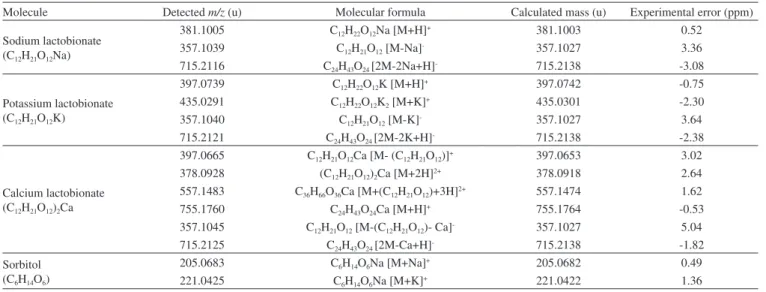
The chemical structures of sodium, potassium and calcium lactobionates were confirmed by high resolution mass spectrometry (HRMS-ESI-TOF) and 13C nuclear magnetic resonance spectroscopy. Figure 3 shows the high-resolution mass spectrum of sodium lactobionate obtained in both the positive and negative modes (see Supplementary Material for other spectrum).
Figure 3. High-resolution mass spectra in positive (A) and negative (B) mode of sodium lactobionate after purification
Table 2. Results regarding the purification of the bioconversion broth from ethanol precipitation (ethanol volume up to 75% (v/v), ethanol addition flow rate of 9 mL min-1 at 25 °C)
Bioconversion broth
Sodium lactobionate Potassium lactobionate Palcium lactobionate
g L-1 % (w/v) g L-1 % (w/v) g L-1 % (w/v)
Lactobionate 242.69 ± 2.37 58.05 245.56 ± 2.84 60.85 244.04 ± 3.61 58.80
Lactose 44.48 ± 2.93 10.64 45.40 ± 2.47 11.24 50.23 ± 2.39 12.10
Fructose 8.95 ± 0.97 2.14 9.43 ± 0.98 2.34 9.73 ± 0.41 2.35
Sorbitol 121.96 ± 3.35 29.17 103.2 ± 4.21 25.57 111.02 ± 4.11 26.75
Final solution
g L-1 % (w/v) g L-1 % (w/v) g L-1 % (w/v)
Lactobionate 9.08 ± 0.13 94.40 9.78 ± 0.07 94.52 9.57 ± 0.06 95.82
Lactose 0.18 ± 0.02 1.80 0.43 ± 0.02 4.10 0.14 ± 0.02 1.31
Fructose nd nd nd nd nd nd
Sorbitol 0.36 ± 0.01 3.80 0.14 ± 0.01 1.38 0.28 ± 0.03 2.86
In the positive mode it was identified the presence of the ion with m/z of 381.1005 corresponding to the protonated sodium lactobionate molecule ([M+H]+, Table 3). Additionally it was observed in the spectrum the ion with m/z of 205.0683 related to sorbitol [M+Na]+. The corresponding sorbitol ion was only observed in the mass spectrum of sodium lactobionate, which was obtained in a purity of 94% (Table 2). In the spectrum obtained in the negative mode (Figure 3B), were observed the ion with m/z of 357.1039, which was attributed to the [M-Na]- ion, and the ion with m/z 715.2116 attributed to the ion [2M-2Na+H]-.
In the mass spectrum of potassium lactobionate (Figure 2S) in the positive mode were detected the ions with m/z of 397.0739, attributed to the protonated ion [M+H] +, and the ion with m/z of 435.0291 related to the ion [M+K]+. It is still possible to observe the ion of m/z 381.0802 which is attributed to sodium lactobionate [M + Na]+.The sodium salt present in the potassium lactobionate may be due to the use of sodium salts in the previous steps of production. In the negative mode, the ions with m/z 357.1040 [M-K] - and the ion with m/z 715.2121 [2M-2K+H]- confirm the structural identity of potassium lactobionate. In this analysis, the m/z corresponding to the cationized sorbitol [M+K]+ with m/z of 221.0425 was also identified (Table 2).
For the calcium lactobionate (Figure 3S) the mass spectrum showed the m/z ions of 397.0665, which was attributed to the ion [M-(C
12H21O12)]
+. The presence of the calcium or potassium atom can be elucidated by the small mass difference for the ion of greater intensity, but mainly by the isotope pattern presented for the ion of m/z 397 (Figure 4S). The ions of m/z 378.0928 [M+2H]2+, m/z 557.1483 [M+(C12H21O12)+3H]
2+ and m/z 755.1760 [M+H]+ were also observed for calcium lactobionate in the positive mode. In the negative mode the ions m/z 357.1045 [M-(C12H21O12)-Ca]
- and m/z 715.2125 [2M-Ca+H]- were observed. Structural confirmation of the lactobionic acid salts was also performed by assigning the signals on 1H and 13C RMN spectrum, as shown in Table 4.
In all 1H NMR spectra, obtained in D
2O, the signal corresponding to the anomeric hydrogen is clearly identified which is presented as a doublet at 4.52 ppm and J = 7.7 Hz (1H). The signal at 4.15 ppm, J = 2.8 Hz (1H), is attributed to the hydrogen attached to the carbon which makes the glycosidic bond. The other signals are presented as multiplets in the region between 4.10 and 3.50 ppm. In 13C NMR spectrum the chemical shifts (δ) of sodium, potassium and calcium lactobionates (Table 4) also show a consistent relationship between
the signals for both lactobionate salts. In the spectrum it was identified the twelve signals referring to the twelve carbon atoms present in the molecule. The signal observed at 178 ppm is attributed to the carbonyl carbon and the signal at 103 ppm is attributed to the anomeric carbon of the galactosidic moiety. The other signals are located between 61 and 81 ppm. The data are in agreement with those previously reported.23
CONCLUSION
In the contextualization of the data presented and discussed in this work, it is highlighted the high yield in the bioproduction of sodium, potassium and calcium lactobionates. Regarding the purification of the lactobionates, average purity of the order of 95% (m/v) is achieved. The chemical identity of the lactobionate salts Table 3. High-resolution mass analysis of sodium, potassium and calcium lactobionates
Molecule Detected m/z (u) Molecular formula Calculated mass (u) Experimental error (ppm) Sodium lactobionate
(C12H21O12Na)
381.1005 C12H22O12Na [M+H]+ 381.1003 0.52
357.1039 C12H21O12 [M-Na]- 357.1027 3.36
715.2116 C24H43O24 [2M-2Na+H]
- 715.2138 -3.08
Potassium lactobionate (C12H21O12K)
397.0739 C12H22O12K [M+H]
+ 397.0742 -0.75
435.0291 C12H22O12K2 [M+K]
+ 435.0301 -2.30
357.1040 C12H21O12 [M-K]- 357.1027 3.64
715.2121 C24H43O24 [2M-2K+H]- 715.2138 -2.38
Calcium lactobionate (C12H21O12)2Ca
397.0665 C12H21O12Ca [M- (C12H21O12)]+ 397.0653 3.02 378.0928 (C12H21O12)2Ca [M+2H]2+ 378.0918 2.64 557.1483 C36H66O36Ca [M+(C12H21O12)+3H]2+ 557.1474 1.62 755.1760 C24H43O24Ca [M+H]
+ 755.1764 -0.53
357.1045 C12H21O12 [M-(C12H21O12)- Ca]
- 357.1027 5.04
715.2125 C24H43O24 [2M-Ca+H]
- 715.2138 -1.82
Sorbitol (C6H14O6)
205.0683 C6H14O6Na [M+Na]
+ 205.0682 0.49
221.0425 C6H14O6Na [M+K]+ 221.0422 1.36
u: unified atomic mass unit.
Table 4. 13C NMR chemical shifts of sodium, potassium and calcium lac-tobionates
Chemical shifts (δ) Sodium lactobionate Potassium lactobionate Calcium lactobionate
C1 178.5 ppm 178.5 ppm 178.5 ppm
C1’ 103.4 ppm 103.4 ppm 103.3 ppm
C2 72.5 ppm 72.5 ppm 73.4 ppm
C2’ 72.7 ppm 72.7 ppm 72.3 ppm
C3 71.0 ppm 71.0 ppm 70.9 ppm
C3’ 81.5 ppm 81.5 ppm 81.5 ppm
C4 71.6 ppm 71.6 ppm 71.4 ppm
C4’ 68.6 ppm 68.6 ppm 68.5 ppm
C5 71.4 ppm 71.4 ppm 71.4 ppm
C5’ 75.3 ppm 75.3 ppm 75.3 ppm
C6 61.9 ppm 61.9 ppm 61.7 ppm
C6’ 61.0 ppm 61.0 ppm 60.9 ppm
Table 4. 13C NMR chemical shifts of sodium, potassium and calcium lac-tobionates
Chemical shifts (δ) Sodium lactobionate Potassium lactobionate Calcium lactobionate
C1 178.5 ppm 178.5 ppm 178.5 ppm
C1’ 103.4 ppm 103.4 ppm 103.3 ppm
C2 72.5 ppm 72.5 ppm 73.4 ppm
C2’ 72.7 ppm 72.7 ppm 72.3 ppm
C3 71.0 ppm 71.0 ppm 70.9 ppm
C3’ 81.5 ppm 81.5 ppm 81.5 ppm
C4 71.6 ppm 71.6 ppm 71.4 ppm
C4’ 68.6 ppm 68.6 ppm 68.5 ppm
C5 71.4 ppm 71.4 ppm 71.4 ppm
C5’ 75.3 ppm 75.3 ppm 75.3 ppm
C6 61.9 ppm 61.9 ppm 61.7 ppm
was confirmed by high-resolution mass spectrometry and NMR analysis. The set of technical information of the products formed, here presented, and potentiates the applicability of lactobionates and lactobionic acid, obtained through the enzymatic system of Z. mobilis in the pharmaceutical and food areas.
SUPPLEMENTARY MATERIAL
The supplemental material shows the HRMS and 1H and 13C MNR spectra for the sodium, potassium and calcium lactobionates.
ACKNOWLEDGMENTS
The authors are grateful to the financial and structural support of UCS, UFRGS, CNPq, FAPERGS and CAPES.
REFERENCES
1. Yu, R. J.; Van Scott, E. J.; Journal of Cosmetic Dermatology 2004, 3, 76. 2. Charloux, C.; Paul, M.; Loisance, D.; Astier, A.; Free Radical Biol. Med.
1995, 15, 699.
3. Kornhauser, A.; Coelho, S. G.; Hearing, V. J.; Clin. Cosmet. Inv. Dermatol. 2010, 3, 135.
4. Sumimoto, R.; Kamada, N.; Transplant. Proc. 1990, 22, 2198. 5. Southard, J. D. H.; Belzer, F. O.; Ann. Rev. Med. 1995, 46, 235. 6. Alonso, S.; Rendueles, M.; Díaz, M.; Biotechnol. Adv. 2013, 31, 1275. 7. Gutierrez, L. F.; Hamoudi, S.; Belkacemi, K.; Int. Dairy. J. 2012, 26,
103.
8. Villa, R.; Cerroni, B.; Viganò, L.; Margheritelli, S.; Abolafio, G.; Oddo, L.; Paradossi, G.; Zaffaroni, N.; Colloids Surf., B 2013, 110, 434. 9. Chen, G.; Liz, D.; Li, J.; Luo, Y.; Wang, J.; Shi, X.; Guo, R.; J. Control.
Release 2015, 21, e8.
10. Pedruzzi, I.; da Silva, E. A. B.; Rodrigues, A. E.; Enzyme Microb. Technol. 2011, 49, 183.
11. Malvessi, E.; Carra, S.; Pasquali, F. C.; Kern, D. B.; Silveira, M. M.; Ayub, M. A. Z.; J. Ind. Microbiol. Biotechnol. 2013, 40, 1.
12. Satory, M.; Fuerling, M.; Haltrich, D.; Kulbe, K. D.; Pittner, F.; Nidetzky, B.; Biotechnol. Lett. 1997, 19, 1205.
13. Zachariou, M.; Scopes, R. K.; J. Bacteriol. 1986, 3, 863.
14. Carra, S.; Dissertação de Mestrado, Universidade de Caxias do Sul, Brasil, 2012.
15. Gonçalves, E.; Delagustin, M. G.; Carra, S.; Silveira, M. M.; Malvessi, E.; Resumos do XII Seminário Brasileiro de Tecnologia Enzimática ENZITEC. Caxias do Sul, Brasil, 2016.
16. Zagonel, T. P.; Dissertação de Mestrado, Universidade Federal do Paraná, Brasil, 2013.
17. Delagustin, M. G.; Gonçalves, E.; Carra, S.; Silveira, M. M.; Malvessi, E.; Resumos do XII Seminário Brasileiro de Tecnologia Enzimática ENZITEC, Caxias do Sul, Brasil, 2016.
18. Murakami, H.; Seko, A.; Azumi, M.; Kiso, T.; Kiryu, T.; Kitahata, S.; Shimada, Y.; Nakano, H.; J.Appl. Glycosci. 2008, 50, 117.
19. Silveira, M. M.; Malvessi, E.; Carra, S.; Pasquali, F. C.; Polidoro, T. A; Resumos do XII Seminário Brasileiro de Tecnologia Enzimática ENZITEC, Caxias do Sul, Brasil, 2016.
20. Malvessi, E.; Concatto, K.; Carra, S.; Silveira, M. M.; Braz. Arch. Biol. Technol. 2006, 49, 139.
21. Demoliner, M.; Oliveira, A. P.; Carra, S.; Silveira, M. M.; Malvessi, E.; Resumos do XXIII Encontro de Jovens Pesquisadores e IV Mostra Acadêmica de Inovação e Tecnologia, Caxias do Sul, Brasil, 2016. 22. European Pharmacopoeia, 6th ed., European Department for Quality of
Medicines: Strasbourg, 2007.